. 2022 Dec 1;71(12):2513-2529.
doi: 10.2337/db21-1131.

Systemic LSD1 Inhibition Prevents Aberrant Remodeling of Metabolism in Obesity

Affiliations

Systemic LSD1 Inhibition Prevents Aberrant Remodeling of Metabolism in Obesity

Bastian Ramms et al. Diabetes. .

Abstract

The transition from lean to obese states involves systemic metabolic remodeling that impacts insulin sensitivity, lipid partitioning, inflammation, and glycemic control. Here, we have taken a pharmacological approach to test the role of a nutrient-regulated chromatin modifier, lysine-specific demethylase (LSD1), in obesity-associated metabolic reprogramming. We show that systemic administration of an LSD1 inhibitor (GSK-LSD1) reduces food intake and body weight, ameliorates nonalcoholic fatty liver disease (NAFLD), and improves insulin sensitivity and glycemic control in mouse models of obesity. GSK-LSD1 has little effect on systemic metabolism of lean mice, suggesting that LSD1 has a context-dependent role in promoting maladaptive changes in obesity. In analysis of insulin target tissues we identified white adipose tissue as the major site of insulin sensitization by GSK-LSD1, where it reduces adipocyte inflammation and lipolysis. We demonstrate that GSK-LSD1 reverses NAFLD in a non-hepatocyte-autonomous manner, suggesting an indirect mechanism potentially via inhibition of adipocyte lipolysis and subsequent effects on lipid partitioning. Pair-feeding experiments further revealed that effects of GSK-LSD1 on hyperglycemia and NAFLD are not a consequence of reduced food intake and weight loss. These findings suggest that targeting LSD1 could be a strategy for treatment of obesity and its associated complications including type 2 diabetes and NAFLD.


Figures

None
Graphical abstract
Figure 1
Figure 1
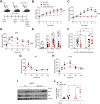
Systemic LSD1 inhibition prevents the development of hyperglycemia and improves insulin sensitivity in db/db mice. A: Four-week-old male and female db/db mice received daily intraperitoneal injections of GSK-LSD1 or veh for 6 weeks. As a control, lean db/+ mice were injected with veh. Metabolic measurements were conducted at the indicated time points. Body weight (B) and blood glucose levels (C) were measured weekly (n = 10 mice/group). D: Blood glucose levels at indicated time points after a glucose bolus via oral gavage (n = 10 mice/group). E: Fasting plasma insulin levels at baseline and after 1, 3, and 6 weeks of GSK-LSD1 or veh treatment (n = 6–10 mice/group). F: Plasma insulin levels before and 10 min after glucose gavage (n = 8–10 mice/group). G: Blood glucose levels at indicated time points after insulin injection (2.0 units/kg body wt i.p.) (n = 10 mice/group). H: Blood glucose levels at indicated time points after intraperitoneal pyruvate injection (n = 10 mice/group). I: Immunoblot analysis of p-AktSer473, Akt, and vinculin in gWAT of GSK-LSD1– or veh-treated db/db mice injected with insulin or saline. J: Quantification of p-AktSer473–to–Akt ratio as fold change compared with veh-treated mice without insulin injection (n = 4 mice/group). Data are presented as mean ± SEM. Statistical differences were calculated with two-way ANOVA with Tukey post hoc analysis (in BD, FH, and J). One-way ANOVA with Tukey post hoc analysis was performed to analyze statistical differences between three or more groups (E). Unless otherwise indicated, significance is shown between GSK-LSD1– and veh-treated mice. *P < 0.05; **P < 0.01; ***P < 0.001; #P < 0.05; ##P < 0.01; ###P < 0.001. AU, arbitrary units; GTT, glucose tolerance test; ITT, insulin tolerance test; ns, not significant; PTT, pyruvate tolerance test; wks, weeks.
Figure 2
Figure 2
LSD1 inhibition reduces adipose tissue inflammation and lipolysis in db/db mice. Representative images of gWAT sections stained with H-E (A) and detection of CLS using an F4/80 antibody in gWAT (B) after 6 weeks of daily GSK-LSD1 or veh administration to male and female db/db mice. As a control, lean db/+ mice were injected with veh. Red arrows highlight CLS. Scale bars = 100 μm. C: Quantification of F4/80+ CLS in gWAT relative to tissue size (n = 4 mice/group). D: Quantitative PCR analysis of inflammatory genes in gWAT. Transcript levels in GSK-LSD1–treated relative to veh-treated db/db mice (Rel. to veh.) (n = 6–11 mice/group). E and F: Lipolysis in differentiated adipocytes isolated from db/db mice after preincubation with GSK-LSD1 or veh and stimulation with isoproterenol. FFA release (E) and glycerol release (F) (n = 3 mice). G: Plasma NEFA levels (n = 6–10 mice/group). H: Networks of genes upregulated (network nodes in red) or downregulated (network nodes in blue) by GSK-LSD1 compared with vehicle (P < 0.01 by Cuffdiff) in gWAT from db/db mice following 6 weeks of treatment, shown as clustered functional categories (n = 4 mice/group). Data are presented as mean ± SEM. One-way ANOVA with Tukey post hoc analysis was performed to analyze statistical differences between three or more groups (C and G) or multiple unpaired t tests were performed to determine differences between two groups (DF). *P < 0.05; **P < 0.01; ***P < 0.001; #P < 0.05.
Figure 3
Figure 3
LSD1 inhibition protects against liver steatosis in db/db mice. A: Representative images of livers in db/db mice treated daily with GSK-LSD1 or veh for 6 weeks. As a control, lean db/+ mice were injected with veh (n = 13–14 mice/group). B: H-E stain of liver sections. Scale bars = 100 μm. C: Liver weight (n = 13–14 mice/group). D: Fasting plasma triglyceride levels at indicated time points (n = 9–10 mice/group). E: Hepatic triglyceride levels (n = 4 mice/group). AST (F) and ALT (G) activity in plasma of GSK-LSD1– or veh-treated mice for 6 weeks (n = 8–10 mice/group). H: Quantitative PCR analysis of genes associated with hepatic lipid metabolism in liver. Transcript levels relative to (Rel.) db/+ mice. (n = 3–4 mice/group). Data are presented as mean ± SEM. Statistical differences were calculated with one-way ANOVA (C and EH) or two-way ANOVA (D) with Tukey post hoc analysis. *P < 0.05; **P < 0.01; ***P < 0.001. ns, not significant; wks, weeks.
Figure 4
Figure 4
Food intake is reduced in GSK-LSD1–treated db/db mice. A: Male and female mice were injected daily with GSK-LSD1 or vehicle (veh) for 5 weeks and then placed into metabolic cages. With use of CLAMS, food intake was monitored over 48 h and is shown as food consumed per day (n = 4–5 mice/group/day). Oxygen consumption (VO2) (B) and carbon dioxide production (VCO2) (C) (n = 4–5 mice/group). Data presented as mean ± SEM. Statistical differences between two groups were calculated with an unpaired two-tailed Student t test (A) or two-way ANOVA (B and C) with Tukey post hoc analysis. *P < 0.05.
Figure 5
Figure 5
GSK-LSD1–mediated improvement of metabolic dysfunction is independent of reduced food intake. A: Study design of pair-feeding experiment. Four-week-old male and female db/db mice were injected daily with veh or GSK-LSD1 for 6 weeks and fed a normal chow diet ad libitum. A third group of mice received veh and was pair-fed to GSK-LSD1–treated mice. B: Food consumption was monitored daily and is shown as cumulative food intake over the 6-week study (n = 8–11 mice/group). C: Blood glucose levels measured weekly. Asterisks indicate statistical differences between veh (black) and GSK-LSD1 (red) groups. D: Blood glucose levels at indicated time points after a glucose bolus via oral gavage (n = 8–11 mice/group). E: Fasting plasma insulin levels at the indicated time points (n = 8–11 mice/group). F: Fasting plasma triglycerides levels at indicated time points (n = 8–11 mice/group). G: Representative images of liver sections stained with H-E. Scale bars = 100 μm (n = 4 mice/group). H: Liver weight (n = 8–11 mice/group). I: Representative images of gWAT sections stained against F4/80 for detection of CLS. Red arrows indicate CLS. Scale bars = 100 μm. J: Quantification of F4/80+ CLS in gWAT relative to tissue size (n = 8–9 mice/group). Data presented as mean ± SEM. Statistical differences were calculated with one-way ANOVA (D, F, H, and J) or two-way ANOVA (B, C, and E) with Tukey post hoc analysis. *P < 0.05; **P < 0.01; ***P < 0.001; ###P < 0.001. GTT, glucose tolerance test; wks, weeks.
Figure 6
Figure 6
GSK-LSD1 reverses metabolic dysfunction due to diet-induced obesity. A: Ten-week-old male C57BL/6J wild-type mice fed a Western diet (WD) were injected daily with GSK-LSD1 or veh for 11 weeks. As a control, a group of WT mice received veh and was kept on a normal chow diet (NCD). Body weight (B) and blood glucose levels (C) measured weekly (n = 7–8 mice/group). Asterisks indicate statistical differences between GSK-LSD1– and veh-treated mice on WD unless otherwise stated. D: Fasting plasma insulin levels at indicated time points (n = 6–8 mice/group). E: Overview of intervention treatment protocol. After 11 weeks of veh administration, the veh group was split into one group continuing veh administration (black), whereas the other half began to receive GSK-LSD1 daily for another 7 weeks (blue). Likewise, the GSK-LSD1 group was split into one group continuing GSK-LSD1 administration after 11 weeks (red), whereas the other half began to receive veh daily for another 7 weeks (brown). F: Body weight across all treatment groups (Western diet, n = 4 mice/group for week 11–16, n = 2–4 mice/group, for weeks 17 and 18, and n = 7 mice for normal chow diet group). Asterisks indicate statistical differences between WD-fed mice administered veh (black) and the intervention group (blue). G: Fasting plasma insulin levels 2 weeks after drug intervention (normal chow diet veh, n = 7 mice, and Western diet, n = 4 mice). H: Blood glucose levels at indicated time points after insulin injection (0.8 units/kg body wt i.p.) at week 17. Data shown relative (rel.) to time point 0 min (n = 2–4 mice/group). I: Body weight (Western diet, n = 4 mice/group for week 11–16, n = 2–4 mice/group for weeks 17 and 18). Data are shown as mean ± SEM. Statistical differences were calculated with one-way ANOVA (G and J) or two-way ANOVA (BD, F, H, and I) with Tukey post hoc analysis. *P < 0.05; **P < 0.01; ***P < 0.001; #P < 0.05; ##P < 0.01; ###P < 0.001. ITT, insulin tolerance test; ns, not significant; wks, weeks.

References

    1. Saltiel AR, Olefsky JM. Inflammatory mechanisms linking obesity and metabolic disease. J Clin Invest 2017;127:1–4 - PMC - PubMed
    1. Sarma S, Sockalingam S, Dash S. Obesity as a multisystem disease: trends in obesity rates and obesity-related complications. Diabetes Obes Metab 2021;23(Suppl. 1):3–16 - PubMed
    1. Lee YS, Wollam J, Olefsky JM. An integrated view of immunometabolism. Cell 2018;172:22–40 - PMC - PubMed
    1. Weisberg SP, McCann D, Desai M, Rosenbaum M, Leibel RL, Ferrante AW Jr. Obesity is associated with macrophage accumulation in adipose tissue. J Clin Invest 2003;112:1796–1808 - PMC - PubMed
    1. Czech MP. Insulin action and resistance in obesity and type 2 diabetes. Nat Med 2017;23:804–814 - PMC - PubMed

Publication types