

Citywide wastewater SARS-CoV-2 levels strongly correlated with multiple disease surveillance indicators and outcomes over three COVID-19 waves
- PMID: 36162580
- PMCID: PMC9507781
- DOI: 10.1016/j.scitotenv.2022.158967
Citywide wastewater SARS-CoV-2 levels strongly correlated with multiple disease surveillance indicators and outcomes over three COVID-19 waves
Abstract
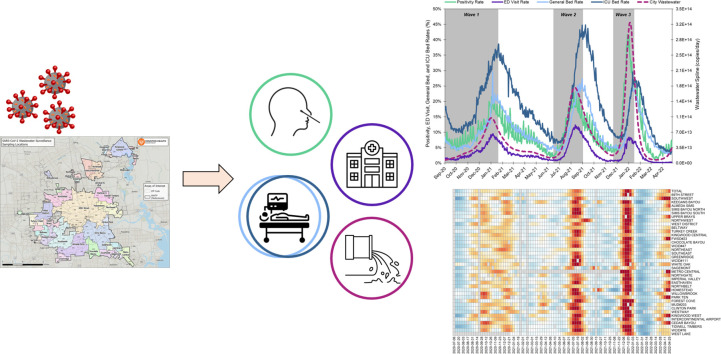
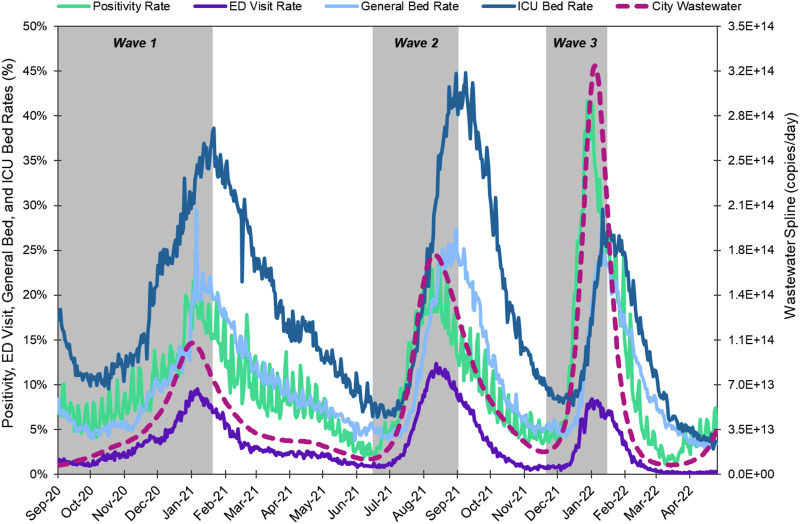
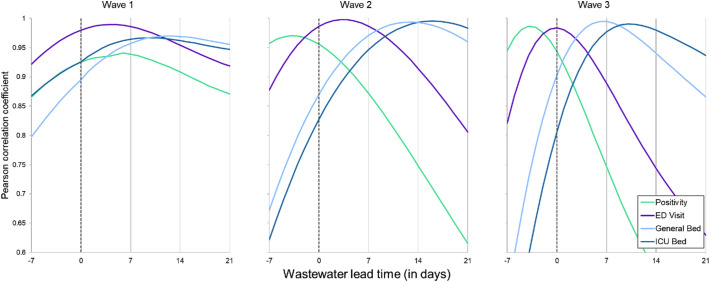
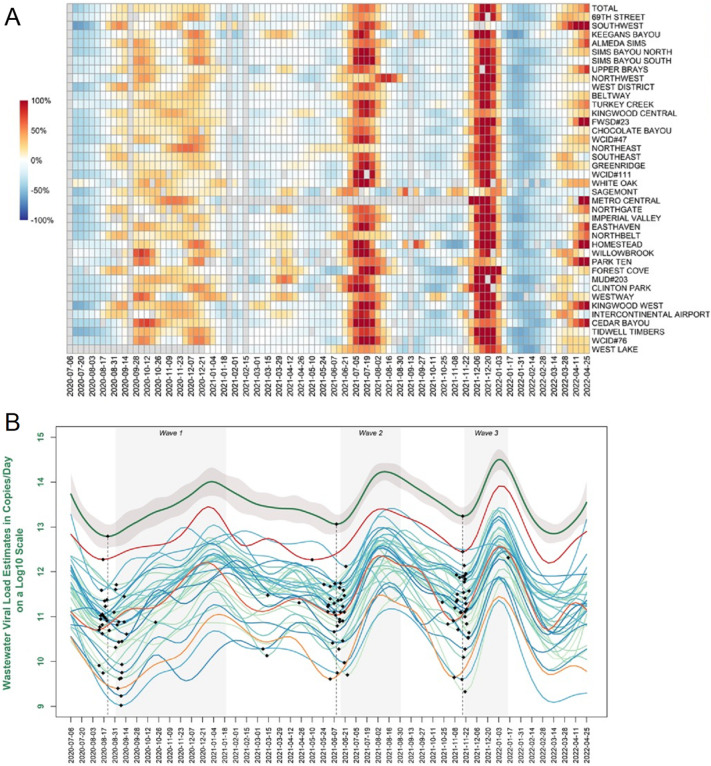
Public health surveillance systems for COVID-19 are multifaceted and include multiple indicators reflective of different aspects of the burden and spread of the disease in a community. With the emergence of wastewater disease surveillance as a powerful tool to track infection dynamics of SARS-CoV-2, there is a need to integrate and validate wastewater information with existing disease surveillance systems and demonstrate how it can be used as a routine surveillance tool. A first step toward integration is showing how it relates to other disease surveillance indicators and outcomes, such as case positivity rates, syndromic surveillance data, and hospital bed use rates. Here, we present an 86-week long surveillance study that covers three major COVID-19 surges. City-wide SARS-CoV-2 RNA viral loads in wastewater were measured across 39 wastewater treatment plants and compared to other disease metrics for the city of Houston, TX. We show that wastewater levels are strongly correlated with positivity rate, syndromic surveillance rates of COVID-19 visits, and COVID-19-related general bed use rates at hospitals. We show that the relative timing of wastewater relative to each indicator shifted across the pandemic, likely due to a multitude of factors including testing availability, health-seeking behavior, and changes in viral variants. Next, we show that individual WWTPs led city-wide changes in SARS-CoV-2 viral loads, indicating a distributed monitoring system could be used to enhance the early-warning capability of a wastewater monitoring system. Finally, we describe how the results were used in real-time to inform public health response and resource allocation.
Keywords: COVID-19; Hospitalizations; Lead time; Positivity rate; SARS-CoV-2; Syndromic surveillance; Wastewater-based epidemiology.
Copyright © 2022 Elsevier B.V. All rights reserved.
Conflict of interest statement
Declaration of competing interest The authors declare that they have no known competing financial interests or personal relationships that could have appeared to influence the work reported in this paper.
Figures
References
-
- Acosta N., Bautista M.A., Waddell B.J., McCalder J., Beaudet A.B., Man L., Pradhan P., Sedaghat N., Papparis C., Bacanu A., Hollman J., Krusina A., Southern D.A., Williamson T., Li C., Bhatnagar S., Murphy S., Chen J., Kuzma D., Clark R., Meddings J., Hu J., Cabaj J.L., Conly J.M., Dai X., Lu X., Chekouo T., Ruecker N.J., Achari G., Ryan M.C., Frankowski K., Hubert C.R.J., Parkins M.D. Longitudinal SARS-CoV-2 RNA wastewater monitoring across a range of scales correlates with Total and regional COVID-19 burden in a well-defined urban population. Water Res. 2022;220 doi: 10.1016/j.watres.2022.118611. - DOI - PMC - PubMed
-
- van Boven M., Hetebrij W.A., Swart A.M., Nagelkerke E., van der Beek R.F.H.J., Stouten S., Hoogeveen R.T., Miura F., Kloosterman A., van der Drift A.-M.R., Welling A., Lodder W.J., de Roda Husman A.M. medRxiv; 2022. Modelling Patterns of SARS-CoV-2 Circulation in the Netherlands, August 2020-February 2022, Revealed by a Nationwide Sewage Surveillance Program. 2022.05.25.22275569. - DOI - PMC - PubMed
MeSH terms
Substances
LinkOut - more resources
Full Text Sources
Medical
Miscellaneous
