. 2022 Dec;13(6):3028-3047.
doi: 10.1002/jcsm.13076. Epub 2022 Sep 26.

Brazilian green propolis improves gut microbiota dysbiosis and protects against sarcopenic obesity

Affiliations

Brazilian green propolis improves gut microbiota dysbiosis and protects against sarcopenic obesity

Takuro Okamura et al. J Cachexia Sarcopenia Muscle. 2022 Dec.

Abstract

Introduction: Brazilian green propolis is an important honeybee product that is considered beneficial for health. Here, we examined the therapeutic potential of dietary supplementation with propolis against sarcopenic obesity using Db/Db mice.

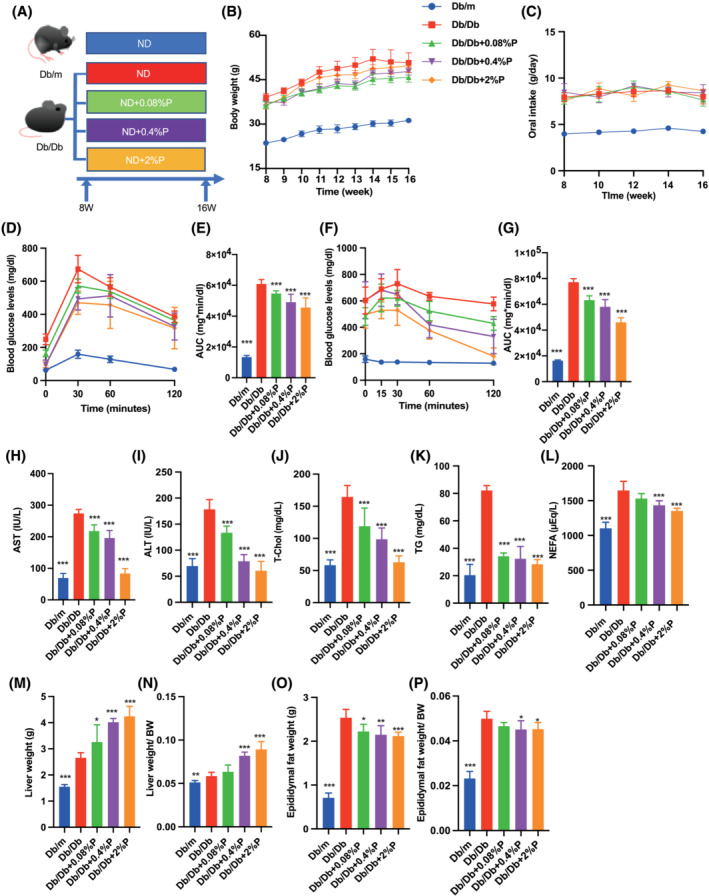
Methods: Db/m mice fed a normal diet alone and Db/Db mice fed normal diet alone, or supplemented with different amounts of propolis (0.08, 0.4 and 2%), were examined for effects on sarcopenic obesity.

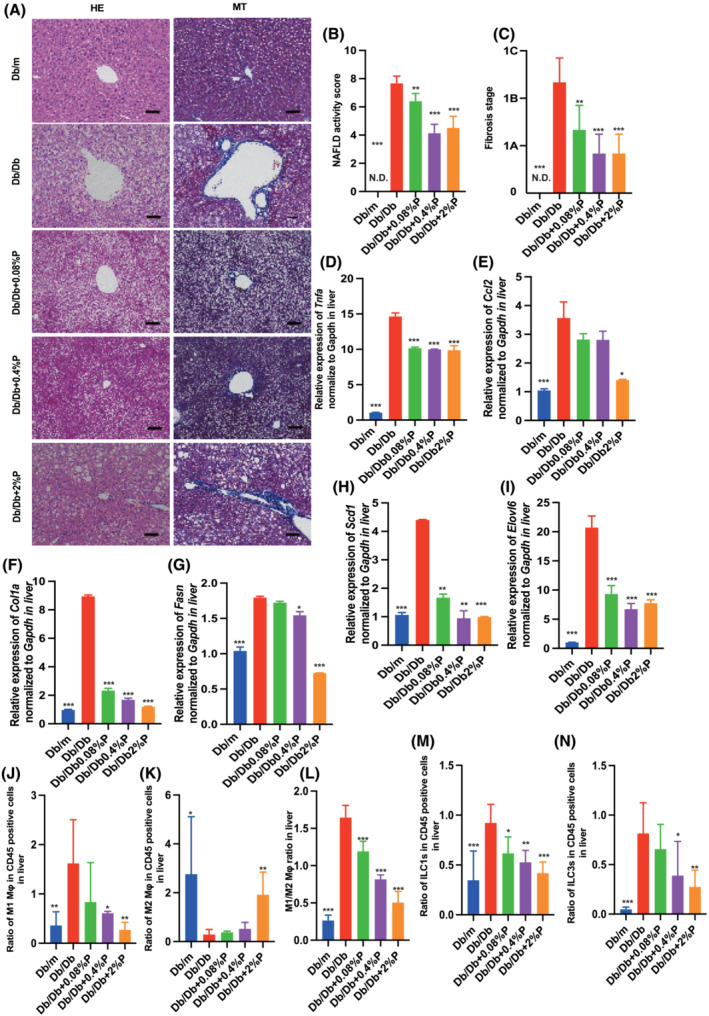
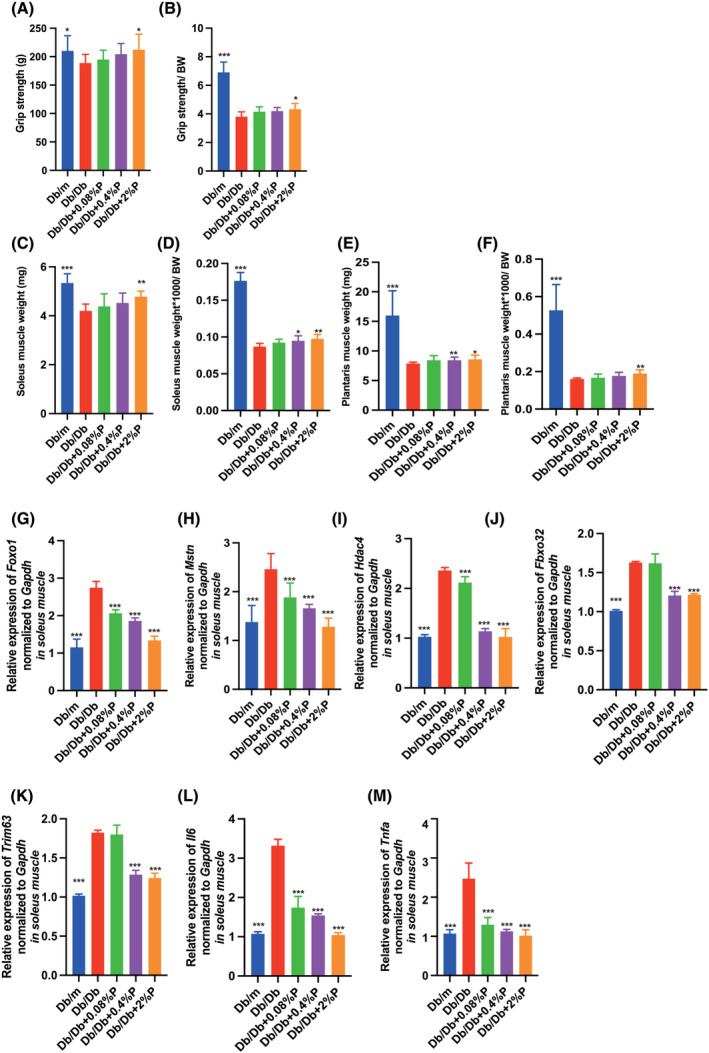
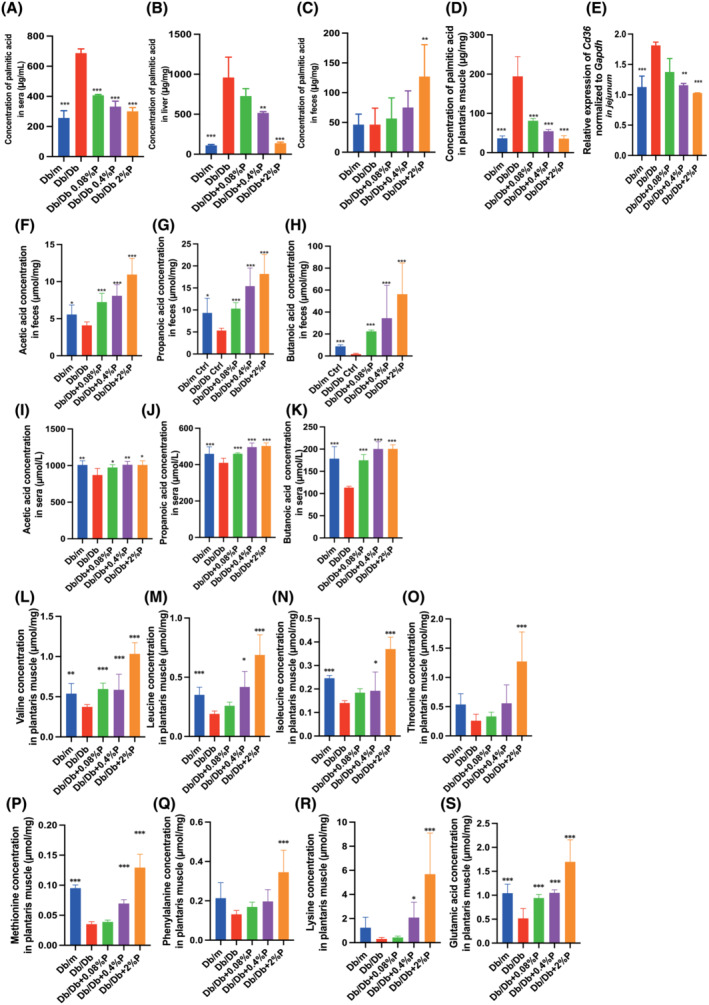
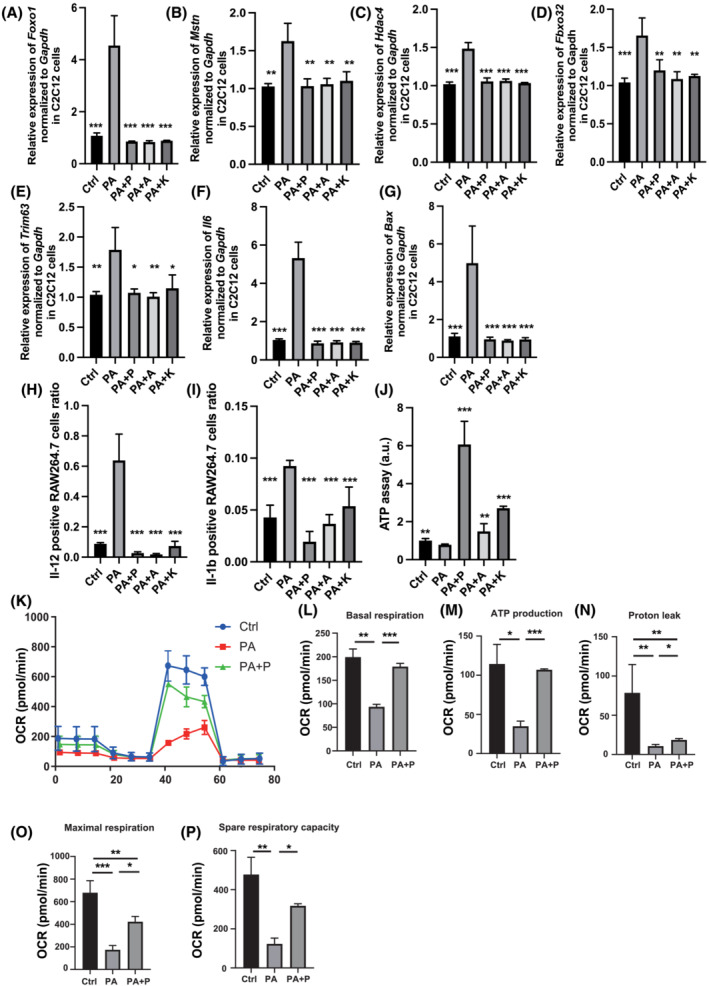
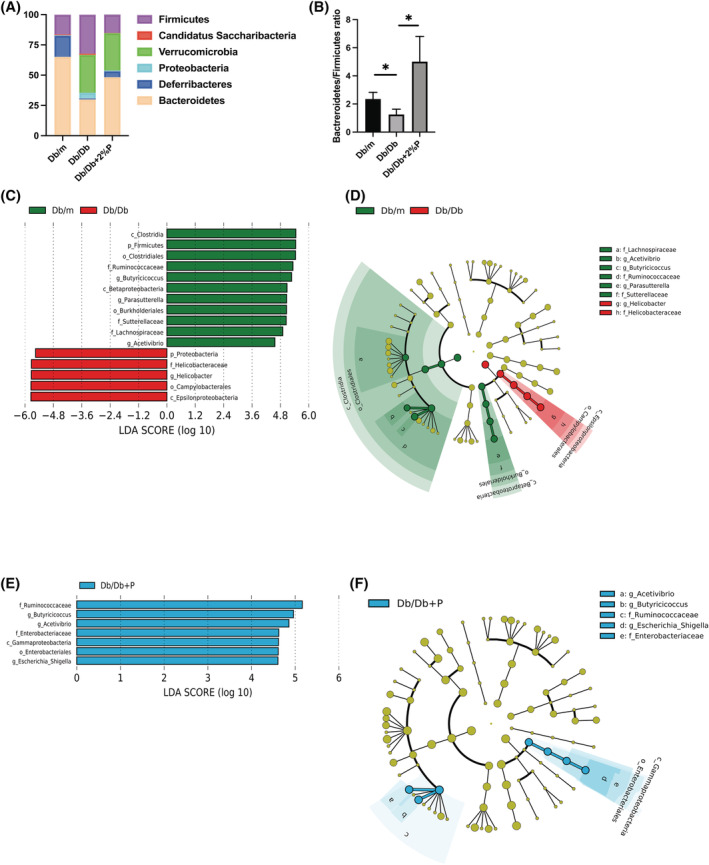
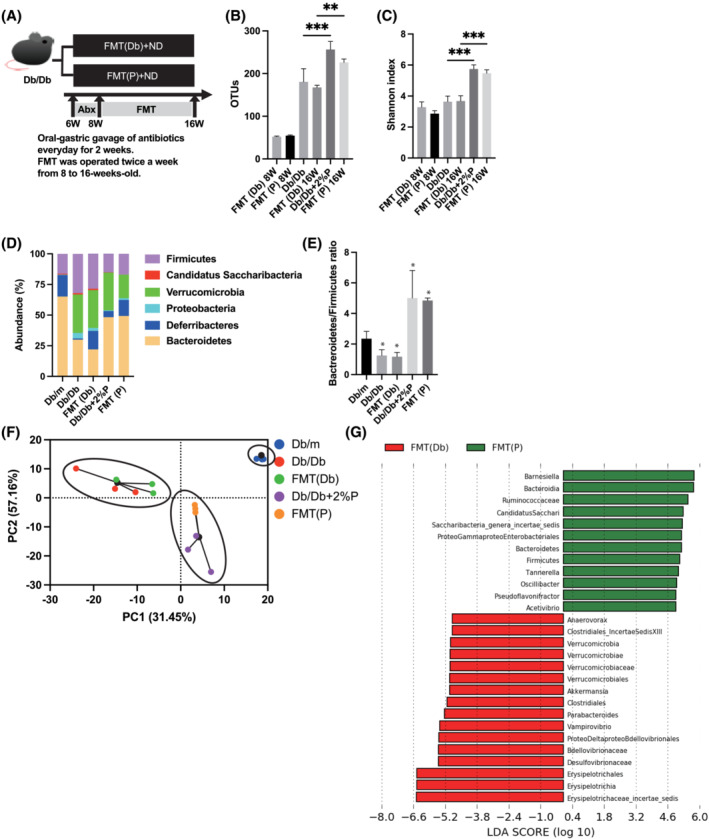
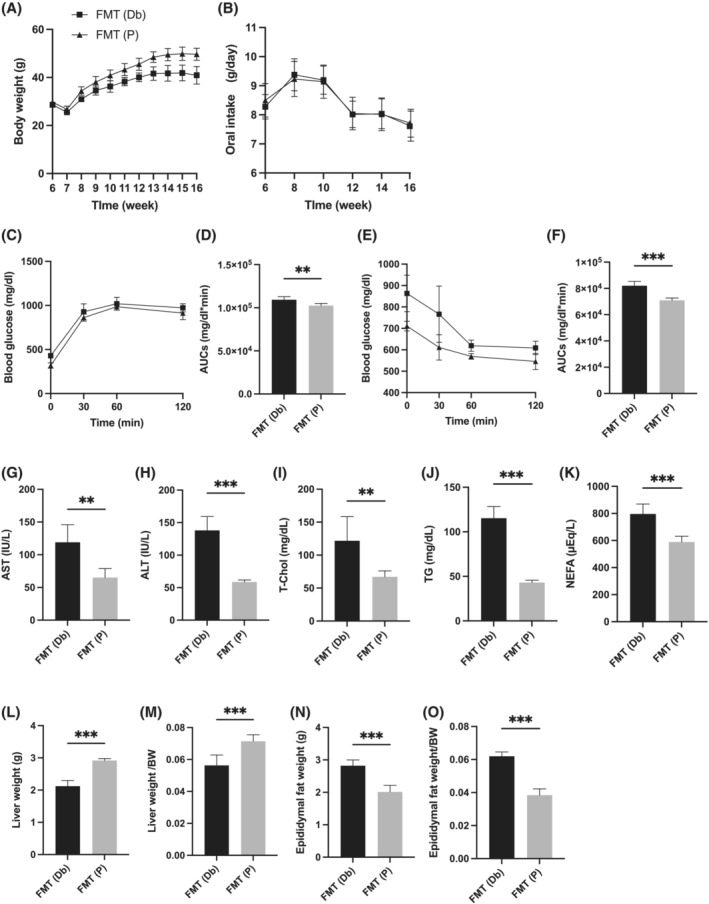
Results: Propolis improved the glucose tolerance (P < 0.001), increased the grip strength (P < 0.001) and the weight of soleus (P = 0.006) and plantaris muscles (P = 0.008). Moreover, propolis improved the non-alcoholic fatty liver disease activity score (P < 0.001) and decreased the expression of genes related to inflammation, liver fibrosis and fatty acid metabolism. Propolis decreased the accumulation of saturated fatty acids in the liver and increased their excretion in faeces. With regard to the innate immunity, propolis decreased the ratio of M1 macrophages (P = 0.008) and Type 1 and 3 innate lymphoid cells to CD45-positive cells (P < 0.001) and increased the ratio of M2 macrophages (P = 0.002) and ILC2s (P = 0.007) in the liver. Additionally, propolis decreased the expression of genes related to muscle atrophy and inflammation and the concentration of saturated fatty acids in the soleus muscle. 16S rRNA phylogenetic sequencing revealed that propolis increased the Bacteroidetes/Firmicutes ratio, and the abundance of Butyricicoccus and Acetivibrio genera. Gut microbiota related to the pentose phosphatase pathway and glycerolipid metabolism was more prevalent after the administration of propolis.

Conclusions: This is the first study to demonstrate that propolis can improve sarcopenic obesity by improving dysbiosis due to overeating and provides new insights into diet-microbiota interactions during sarcopenic obesity.

Keywords: Brazilian green propolis; Gut microbiota; Metabolite; Propolis; Sarcopenic obesity.


Conflict of interest statement

Takuro Okamura declares that he has no conflict of interest. Masahide Hamaguchi has received grants from Asahi Kasei Pharma, Nippon Boehringer Ingelheim Co., Ltd., Mitsubishi Tanabe Pharma Corporation, Daiichi Sankyo Co., Ltd., Sanofi K.K., Takeda Pharmaceutical Company Limited, Astellas Pharma Inc., Kyowa Kirin Co., Ltd., Sumitomo Dainippon Pharma Co., Ltd., Novo Nordisk Pharma Ltd. and Eli Lilly Japan K.K., outside the submitted work. Ryo Bamba declares that he has no conflict of interest. Hanako Nakajima declares that he has no conflict of interest. Yuta Yoshimura declares that he has no conflict of interest. Tomonori Kimura declares that he has no conflict of interest. Yoshitaka Hashimoto has received grants from Asahi Kasei Pharma, personal fees from Daiichi Sankyo Co., Ltd., personal fees from Mitsubishi Tanabe Pharma Corp., personal fees from Sanofi K.K. and personal fees from Novo Nordisk Pharma Ltd., outside the submitted work. Saori Majima declares that he has no conflict of interest. Takafumi Senmaru has received personal fees from Ono Pharma Co., Ltd., Mitsubishi Tanabe Pharma Co, Astellas Pharma Inc., Kyowa Hakko Kirin Co., Ltd., Sanofi K.K., MSD K.K., Kowa Pharma Co., Ltd., Taisho Toyama Pharma Co., Ltd., Takeda Pharma Co., Ltd., Kissei Pharma Co., Ltd., Novo Nordisk Pharma Ltd. and Eli Lilly Japan K.K. outside the submitted work. Emi Ushigome has received grants from the Japanese Study Group for Physiology and Management of Blood Pressure, the Astellas Foundation for Research on Metabolic Disorders (grant number: 4024). Donated Fund Laboratory of Diabetes therapeutics is an endowment department, supported with an unrestricted grant from Ono Pharmaceutical Co., Ltd., and received personal fees from AstraZeneca plc, Astellas Pharma Inc., Daiichi Sankyo Co., Ltd., Kyowa Hakko Kirin Company Ltd., Kowa Pharmaceutical Co., Ltd., MSD K.K., Mitsubishi Tanabe Pharma Corp., Novo Nordisk Pharma Ltd., Taisho Toyama Pharmaceutical Co., Ltd., Takeda Pharmaceutical Co., Ltd., Nippon Boehringer Ingelheim Co., Ltd. and Sumitomo Dainippon Pharma Co., Ltd., outside the submitted work. Naoko Nakanishi declares that he has no conflict of interest. Mai Asano Mai Asano received personal fees from Novo Nordisk Pharma Ltd., Abbott Japan Co., Ltd., AstraZeneca plc, Kowa Pharmaceutical Co., Ltd., Ono Pharmaceutical Co., Ltd., and Takeda Pharmaceutical Co., Ltds., outside the submitted work. Masahiro Yamazaki reports personal fees from MSD K.K., Sumitomo Dainippon Pharma Co., Ltd., Kowa Company, Limited, AstraZeneca PLC, Takeda Pharmaceutical Company Limited, Kyowa Hakko Kirin Co., Ltd., Daiichi Sankyo Co., Ltd., Kowa Pharmaceutical Co., Ltd., and Ono Pharma Co., Ltd., outside the submitted work. Yuichiro Nishimoto was employed by Metabologenomics Inc. Takuji Yamada was employed by Metabologenomics Inc. Chizuru Fujikura was employed by Yamada Bee Company, Inc. Takashi Asama was employed by Yamada Bee Company, Inc. Nobuaki Okumura was employed by Yamada Bee Company, Inc. Hiroshi Takakuwa was employed by Agilent Technologies. Ryoichi Sasano declares that he has no conflict of interest. Michiaki Fukui has received grants from Nippon Boehringer Ingelheim Co., Ltd., Kissei Pharma Co., Ltd., Mitsubishi Tanabe Pharma Co, Daiichi Sankyo Co., Ltd., Sanofi K.K., Takeda Pharma Co., Ltd., Astellas Pharma Inc., MSD K.K., Kyowa Hakko Kirin Co., Ltd., Sumitomo Dainippon Pharma Co., Ltd., Kowa Pharmaceutical Co., Ltd., Novo Nordisk Pharma Ltd., Ono Pharma Co., Ltd., Sanwa Kagaku Kenkyusho Co., Ltd. Eli Lilly Japan K.K., Taisho Pharma Co., Ltd., Terumo Co., Teijin Pharma Ltd., Nippon Chemiphar Co., Ltd., and Johnson & Johnson K.K. Medical Co., Abbott Japan Co., Ltd., and received personal fees from Nippon Boehringer Ingelheim Co., Ltd., Kissei Pharma Co., Ltd., Mitsubishi Tanabe Pharma Corp., Daiichi Sankyo Co., Ltd., Sanofi K.K., Takeda Pharma Co., Ltd., Astellas Pharma Inc., MSD K.K., Kyowa Kirin Co., Ltd., Sumitomo Dainippon Pharma Co., Ltd., Kowa Pharma Co., Ltd., Novo Nordisk Pharma Ltd., Ono Pharma Co., Ltd., Sanwa Kagaku Kenkyusho Co., Ltd., Eli Lilly Japan K.K., Taisho Pharma Co., Ltd., Bayer Yakuhin, Ltd., AstraZeneca K.K., Mochida Pharma Co., Ltd., Abbott Japan Co., Ltd., Medtronic Japan Co., Ltd., Arkley Inc., Teijin Pharma Ltd. and Nipro Cor., outside the submitted work.

Figures

Figure 1
Figure 1
Administration of propolis improved obesity, glucose tolerance, hepatic enzymes, lipid metabolism and visceral fat obesity. (A) Administration of propolis (0.08, 0.4 and 2% per feed weight) started at 8 weeks of age. (B) Changes in the body weight (n = 12). (C) Oral intake (g/day) (n = 12). (D and E) Results of intraperitoneal glucose tolerance test (2 g/kg body weight) for 15‐week‐old mice and the area under the curve (AUC) analysis (n = 12). (F and G) Results of insulin tolerance test (0.75 U/kg body weight) for 15‐week‐old mice and the AUC analysis (n = 12). (H–L) Serum aspartate aminotransferase (AST), alanine aminotransferase (ALT), total cholesterol (T‐Chol), triglyceride (TG) and non‐esterified fatty acid (NEFA) levels (n = 12). (M and N) Absolute and relative weights of liver (n = 12). (O and P) Absolute and relative weights of epididymal fat (n = 12). Data are represented as the mean ± SD values. Data were analysed using one‐way ANOVA with Holm–Šídák's multiple‐comparisons test. *P < 0.05, **P < 0.01, ***P < 0.001.
Figure 2
Figure 2
Administration of propolis improved fatty liver and decreased the expression of genes related to inflammation, liver fibrosis, and fatty acid metabolism, and decreased the ratio of M1 macrophages, ILC1, and ILC3, and increased the ratio of M2 macrophages and ILC2. (A) Representative images of haematoxylin and eosin‐stained and Masson trichrome‐stained liver sections. Liver tissues were collected at 16 weeks of age. The scale bar shows 100 μm. (B and C) Non‐alcoholic fatty liver disease (NAFLD) activity scores and the fibrosis stage of NAFLD activity score (n = 12). Relative mRNA expression of (D) Tnfa, (E) Ccl2, (F) Col1a, (G) Fasn, (H) Scd1 and (I) Elovl6 in the liver normalized to the expression of Gapdh (n = 12). Ratio of (J) M1 macrophages to CD45‐positive cells, (K) M2 macrophages to CD45‐positive cells, (L) M1 to M2 macrophages, (M) ILC1s to CD45‐positive cells, (N) ILC3s to CD45‐positive cells in the liver (n = 12 in each case). Data are represented as the mean ± SD values. Data were analysed using one‐way ANOVA with Holm–Šídák's multiple‐comparisons test. *P < 0.05, **P < 0.01, ***P < 0.001. ND, not detected.
Figure 3
Figure 3
Administration of propolis increased the grip strength and muscle weight. (A and B) Absolute and relative grip strength, (C and D) absolute and relative soleus muscle weight, (E and F) absolute and relative plantaris muscle weight in 16‐week‐old mice (n = 12 in each case). Relative mRNA expression of (G) Foxo1, (H) Mstn, (I) Hdac4, (J) Fbxo32, (K) Trim63, (L) Il6 and (I) Tnfa in the soleus muscle normalized to the expression of Gapdh (n = 12). Data are represented as the mean ± SD values. Data were analysed using one‐way ANOVA with Holm–Šídák's multiple‐comparisons test. *P < 0.05, **P < 0.01, ***P < 0.001.
Figure 4
Figure 4
Administration of propolis decreased the Cd36 mRNA levels, which resulted in decreased concentration of saturated fatty acids in sera, liver and soleus muscle and increased concentration in faeces. The administration of propolis increased the concentration of short‐chain fatty acid in faeces and sera and the concentration of the amino acids related to muscle biosynthesis. The concentration of palmitic acid in (A) sera, (B) liver, (C) faeces and (D) soleus muscle (n = 12). (E) Relative mRNA expression of Cd36 in the jejunum normalized to the expression of GAPDH (n = 12). The concentrations of (F) acetic acid, (G) propanoic acid and (H) butanoic acid in faeces (n = 12). The concentrations of (I) acetic acid, (J) propanoic acid and (K) butanoic acid in sera (n = 12). The concentrations of (L) valine, (M) leucine, (N) isoleucine, (O) threonine, (P) methionine, (Q) phenylalanine, (R) lysine and (S) glutamic acid in the plantaris muscle (n = 12). Data are represented as the mean ± SD values. Data were analysed using one‐way ANOVA with Holm–Šídák's multiple‐comparisons test. *P < 0.05, **P < 0.01, ***P < 0.001.
Figure 5
Figure 5
Administration of propolis protected against muscle atrophy and mitochondrial dysfunction induced by saturated fatty acid in C2C12 myotube cells. Relative mRNA expression of (A) Foxo1, (B) Mstn, (C) Hdac4, (D) Fbxo32, (E) Trim63, (F) Il6 and (G) Bax in C2C12 myotube cells treated with ethanol (Ctrl), 200 μM palmitic acid (PA), 200 μM PA and 100 μg/mL propolis (PA + P) normalized to the expression of Gapdh (n = 6). (H) Ratio of Il‐12 + RAW264.7 cells in F4/80 + CD11b + cells treated with ethanol (Ctrl), 200 μM palmitic acid (PA), 200 μM PA and 100 μg/mL propolis (PA + P) (n = 6). (I) Ratio of Il‐1β + RAW264.7 cells in F4/80 + CD11b + cells treated with ethanol (Ctrl), 200 μM PA, 200 μM PA and 100 μg/mL propolis (PA + P) (n = 6). (J) ATP assay following treatment with ethanol (Ctrl), 200 μM palmitic acid (PA) or 200 μM PA and 100 μg/mL of propolis (PA + P), 10.6 μg/mL of artepillin C (PA + A) or 1.89 μg/mL of kaempferide (PA + K) (n = 6). (K) Raw data for oxygen consumption rate (OCR), (L) basal respiration, (M) ATP‐linked respiration (oligomycin‐sensitive OCR), (N) proton leak, (O) maximal mitochondrial respiration (FCCP‐stimulated OCR) and (P) spare respiratory capacity. OCRs were normalized to the total number of cells. Data are represented as the mean ± SD values. Data were analysed using one‐way ANOVA with Holm–Šídák's multiple‐comparisons test. *P < 0.05, **P < 0.01, ***P < 0.001.
Figure 6
Figure 6
Components and functional profiles of the gut microbiota. (A) Relative abundance of gut microbiota at the phylum level (n = 3). (B) Ratio of the phylum Bacteroidetes in Firmicutes (n = 3). Data are the mean ± SD values. Data were analysed using one‐way ANOVA with Holm–Šídák's multiple‐comparisons test. *P < 0.05, as determined by one‐way ANOVA. The influence of genera on unique gut microbiota in Db/m mice, Db/Db mice and Db/Db + 2%P mice was assessed by LEfSe analysis (n = 3). (C and E) LDA scores of gut microbiota of Db/m and Db/Db + 2%P (green) and Db/Db (red) mice. (D and F) LEfSe was used to identify the taxa with the greatest differences in abundance between the gut microbiota of Db/m (Db/Db + 2%P) and Db/Db mice. Db/m mice (green); Db/Db mice (red); Db/Db + 2%P mice (blue). The brightness of each dot is proportional to the effect size. Only taxa with a significant LDA threshold value >2 are shown.
Figure 7
Figure 7
Faecal microbiota transplantation of Db/Db mice and Db/Db+2%P mice to recipient mice. (A) Oral‐gastric gavage of antibiotics was performed every day for 2 weeks. FMT was operated twice a week from 8 to 16 weeks old. (B) OTUs (n = 3). (C) Shannon‐index (n = 3). (D) Relative abundance of gut microbiota at the phylum level (n = 3). (E) Ratio of the phylum Bacteroidetes in Firmicutes (n = 3). (F) PCA and k‐means clustering for gut microbiota. (G) LDA scores of gut microbiota of FMT (Db) (green) and FMT(P) mice (red). Data are represented as the mean ± SD values. Data were analysed using one‐way ANOVA with Holm–Šídák's multiple‐comparisons test. Abx, antibiotics; FMT, faecal microbiota transplantation; LDA, linear discriminant analysis; ND, normal diet; PCA, principal component analysis.
Figure 8
Figure 8
Faecal microbiota transplantation of Db/Db+2%P mice improved obesity, glucose tolerance, hepatic enzymes, lipid metabolism and visceral fat obesity. (A) Changes in the body weight (n = 6). (B) Oral intake (g/day) (n = 6). (C and D) Results of intraperitoneal glucose tolerance test (2 g/kg body weight) for 15‐week‐old mice and the area under the curve (AUC) analysis (n = 6). (E and F) Results of insulin tolerance test (0.75 U/kg body weight) for 15‐week‐old mice and the AUC analysis (n = 6). (G–K) Serum aspartate aminotransferase (AST), alanine aminotransferase (ALT), total cholesterol (T‐Chol), triglyceride (TG) and non‐esterified fatty acid (NEFA) levels (n = 6). (L and M) Absolute and relative weights of liver (n = 6). (N and O) Absolute and relative weights of epididymal fat (n = 6). Data are represented as the mean ± SD values. Data were analysed using unpaired t‐test. *P < 0.05, **P < 0.01, ***P < 0.001. FMT, faecal microbiota transplantation.

References

    1. Zheng Y, Ley SH, Hu FB. Global aetiology and epidemiology of type 2 diabetes mellitus and its complications. Nat Rev Endocrinol 2017;14:88–98. - PubMed
    1. Okamura T, Miki A, Hashimoto Y, Kaji A, Sakai R, Osaka T, et al. Shortage of energy intake rather than protein intake is associated with sarcopenia in elderly patients with type 2 diabetes: A cross‐sectional study of the KAMOGAWA‐DM cohort. J Diabetes 2018;67:477–483. - PubMed
    1. Park S, Na W, Sohn C. Relationship between osteosarcopenic obesity and dietary inflammatory index in postmenopausal Korean women: 2009 to 2011 Korea National Health and Nutrition Examination Surveys. J Clin Biochem Nutr 2018;63:211–216. - PMC - PubMed
    1. Hashimoto Y, Osaka T, Fukuda T, Tanaka M, Yamazaki M, Fukui M. The relationship between hepatic steatosis and skeletal muscle mass index in men with type 2 diabetes. Endocr J 2016;63:877–884. - PubMed
    1. Lim S, Kim JH, Yoon JW, Kang SM, Choi SH, Park YJ, et al. Sarcopenic obesity: Prevalence and association with metabolic syndrome in the Korean Longitudinal Study on Health and Aging (KLoSHA). Diabetes Care 2010;33:1652–1654. - PMC - PubMed

Publication types