

Enhancing the BOADICEA cancer risk prediction model to incorporate new data on RAD51C, RAD51D, BARD1 updates to tumour pathology and cancer incidence
- PMID: 36162851
- PMCID: PMC9691826
- DOI: 10.1136/jmedgenet-2022-108471
Enhancing the BOADICEA cancer risk prediction model to incorporate new data on RAD51C, RAD51D, BARD1 updates to tumour pathology and cancer incidence
Abstract
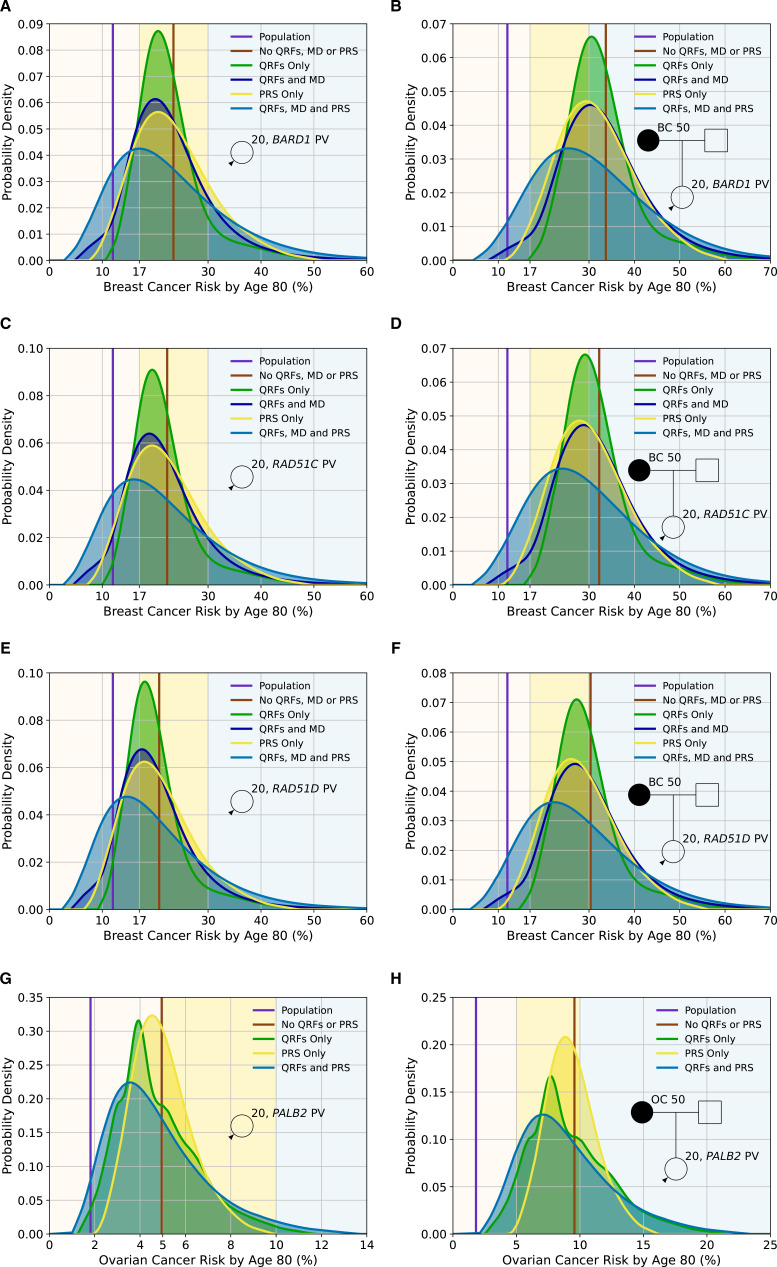
Background: BOADICEA (Breast and Ovarian Analysis of Disease Incidence and Carrier Estimation Algorithm) for breast cancer and the epithelial tubo-ovarian cancer (EOC) models included in the CanRisk tool (www.canrisk.org) provide future cancer risks based on pathogenic variants in cancer-susceptibility genes, polygenic risk scores, breast density, questionnaire-based risk factors and family history. Here, we extend the models to include the effects of pathogenic variants in recently established breast cancer and EOC susceptibility genes, up-to-date age-specific pathology distributions and continuous risk factors.
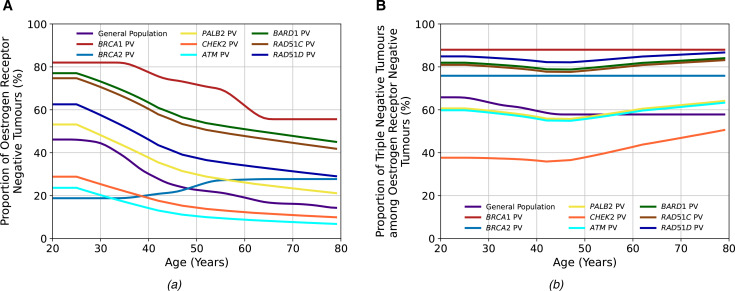
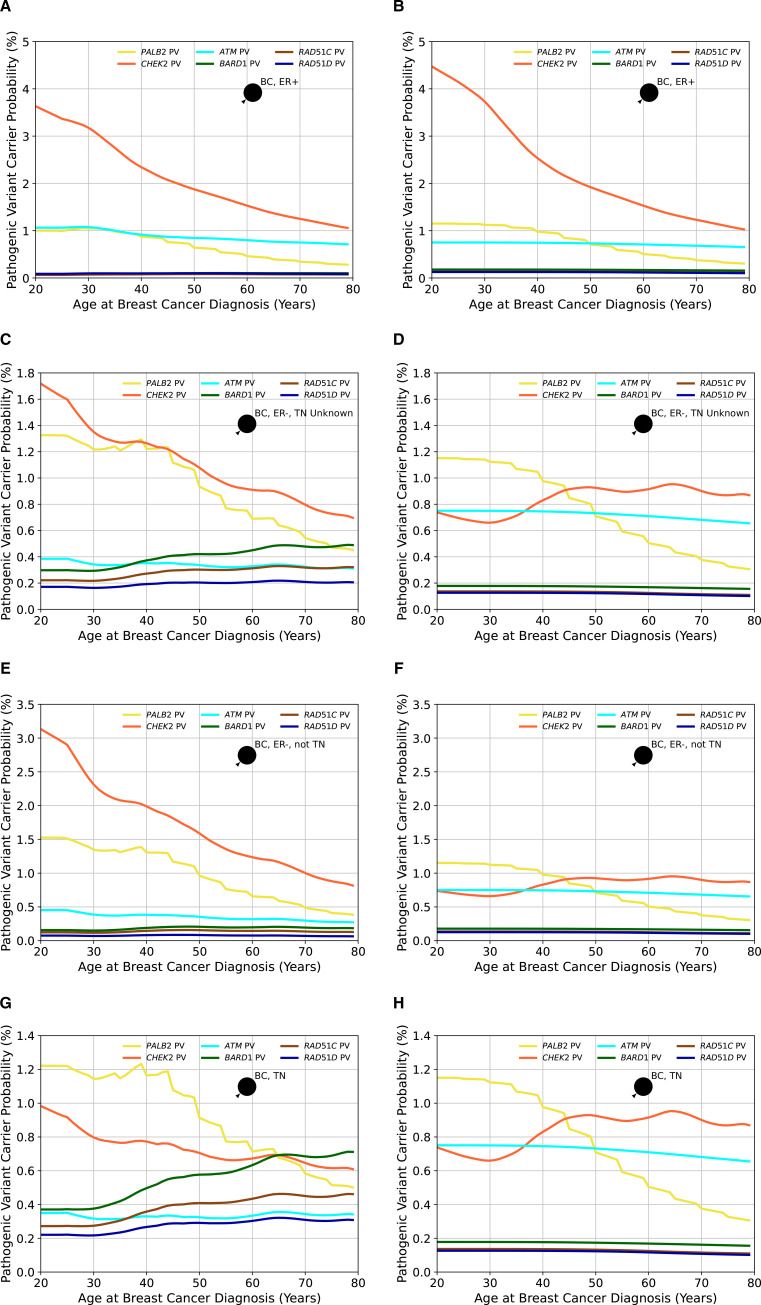
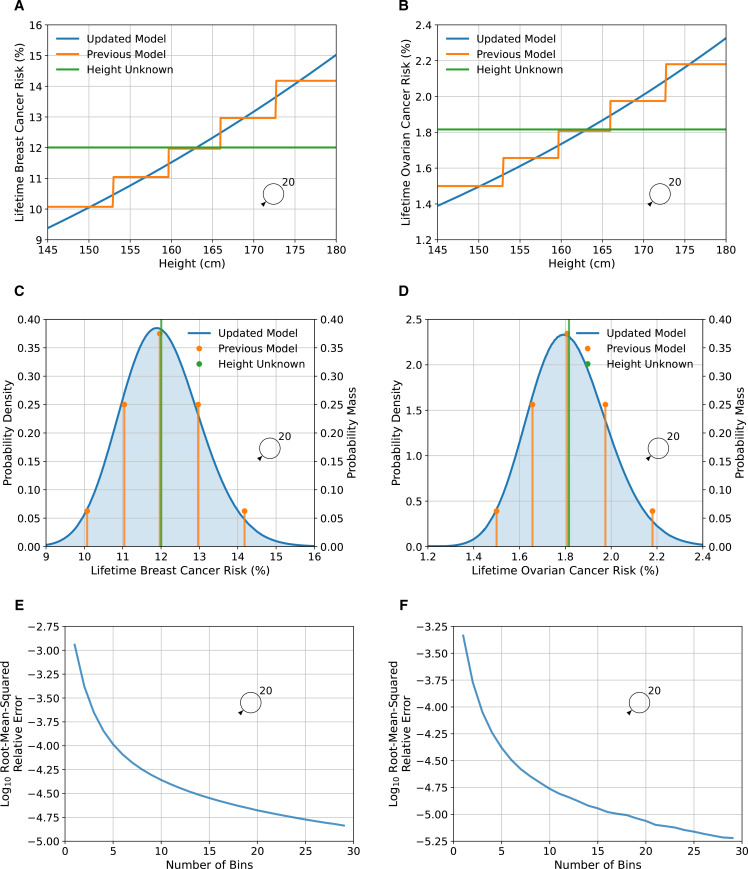
Methods: BOADICEA was extended to further incorporate the associations of pathogenic variants in BARD1, RAD51C and RAD51D with breast cancer risk. The EOC model was extended to include the association of PALB2 pathogenic variants with EOC risk. Age-specific distributions of oestrogen-receptor-negative and triple-negative breast cancer status for pathogenic variant carriers in these genes and CHEK2 and ATM were also incorporated. A novel method to include continuous risk factors was developed, exemplified by including adult height as continuous.
Results: BARD1, RAD51C and RAD51D explain 0.31% of the breast cancer polygenic variance. When incorporated into the multifactorial model, 34%-44% of these carriers would be reclassified to the near-population and 15%-22% to the high-risk categories based on the UK National Institute for Health and Care Excellence guidelines. Under the EOC multifactorial model, 62%, 35% and 3% of PALB2 carriers have lifetime EOC risks of <5%, 5%-10% and >10%, respectively. Including height as continuous, increased the breast cancer relative risk variance from 0.002 to 0.010.
Conclusions: These extensions will allow for better personalised risks for BARD1, RAD51C, RAD51D and PALB2 pathogenic variant carriers and more informed choices on screening, prevention, risk factor modification or other risk-reducing options.
Keywords: genetic counseling.
© Author(s) (or their employer(s)) 2022. Re-use permitted under CC BY. Published by BMJ.
Conflict of interest statement
Competing interests: The authors ACA, DFE, AL, AC and TC are named inventors of BOADICEA v5 commercialised by Cambridge Enterprise. AL is now employed by Illumina.
Figures

References
-
- Cancer Research UK . Ovarian Cancer Statistics [Ovarian cancer statistics for the UK]. Available: https://www.cancerresearchuk.org/health-professional/cancer-statistics/s... [Accessed 21 June 2021].
-
- Cancer Research UK . Breast cancer statistics [Breast cancer statistics for the UK]. Available: http://www.cancerresearchuk.org/health-professional/cancer-statistics/st... [Accessed 21 June 2021].
-
- The UK Government . Breast screening: programme overview. Available: https://www.gov.uk/guidance/breast-screening-programme-overview [Accessed 15 July 2021].
-
- Pashayan N, Antoniou AC, Ivanus U, Esserman LJ, Easton DF, French D, Sroczynski G, Hall P, Cuzick J, Evans DG, Simard J, Garcia-Closas M, Schmutzler R, Wegwarth O, Pharoah P, Moorthie S, De Montgolfier S, Baron C, Herceg Z, Turnbull C, Balleyguier C, Rossi PG, Wesseling J, Ritchie D, Tischkowitz M, Broeders M, Reisel D, Metspalu A, Callender T, de Koning H, Devilee P, Delaloge S, Schmidt MK, Widschwendter M. Personalized early detection and prevention of breast cancer: ENVISION consensus statement. Nat Rev Clin Oncol 2020;17:687–705. 10.1038/s41571-020-0388-9 - DOI - PMC - PubMed
-
- Maas P, Barrdahl M, Joshi AD, Auer PL, Gaudet MM, Milne RL, Schumacher FR, Anderson WF, Check D, Chattopadhyay S, Baglietto L, Berg CD, Chanock SJ, Cox DG, Figueroa JD, Gail MH, Graubard BI, Haiman CA, Hankinson SE, Hoover RN, Isaacs C, Kolonel LN, Le Marchand L, Lee I-M, Lindström S, Overvad K, Romieu I, Sanchez M-J, Southey MC, Stram DO, Tumino R, VanderWeele TJ, Willett WC, Zhang S, Buring JE, Canzian F, Gapstur SM, Henderson BE, Hunter DJ, Giles GG, Prentice RL, Ziegler RG, Kraft P, Garcia-Closas M, Chatterjee N. Breast cancer risk from modifiable and Nonmodifiable risk factors among white women in the United States. JAMA Oncol 2016;2:1295–302. 10.1001/jamaoncol.2016.1025 - DOI - PMC - PubMed
Publication types
MeSH terms
Substances
Grants and funding
LinkOut - more resources
Full Text Sources
Medical
Research Materials
Miscellaneous