Review
. 2022 Oct;37(10):1945-1950.
doi: 10.1016/j.arth.2022.05.026. Epub 2022 Sep 6.

P-Values and Power in Orthopedic Research: Myths and Reality

Affiliations
Review

P-Values and Power in Orthopedic Research: Myths and Reality

Isabella Zaniletti et al. J Arthroplasty. 2022 Oct.

Abstract

The results of statistical tests in orthopedic studies are typically reported using P-values. If a P-value is smaller than the pre-determined level of significance (eg, < .05), the null hypothesis is rejected in support of the alternative. This automaticity in interpreting statistical results without consideration of the power of the study has been denounced over the years by statisticians, since it can potentially lead to misinterpretation of the study conclusions. In this paper, we review fundamental misconceptions and misinterpretations of P-values and power, along with their connection with confidence intervals, and we provide guidelines to orthopedic researchers for evaluating and reporting study results. We provide real-world orthopedic examples to illustrate the main concepts. Please visit the followinghttps://youtu.be/bdPU4luYmF0for videos that explain the highlights of the paper in practical terms.

Keywords: P-value; arthroplasty; orthopedics; power; sample size; significance test.


Figures

Figure 1 –
Figure 1 –. Confidence intervals for the estimated difference between females and males change in KOOS score.
The interpretation of confidence interval width can lead to different study conclusion.
Figure 2 –
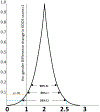
Figure 2 –. Relationship between p-values and confidence intervals.
As the confidence interval decreases, the p-value increases and vice versa.
Figure 3 –
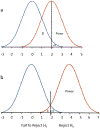
Figure 3 –. Trade-off between Alpha (probability of type I error) and Beta (or 1-Power, probability of type II error).
Figure 3b shows how a shift in the distribution under the new alternative hypothesis (H1: μtc=0.4) causes a reduction of Type II error, and therefore an increase in power.

References

    1. Greenland S, Senn SJ, Rothman KJ, et al. Statistical tests, P values, confidence intervals, and power: a guide to misinterpretations. Eur J Epidemiol. 2016;31(4):337–350. - PMC - PubMed
    1. Yaddanapudi LN. The American Statistical Association statement on P-values explained. J Anaesthesiol Clin Pharmacol. 2016;32(4):421–423. - PMC - PubMed
    1. Devick KL, Zaniletti I, Larson DL, Lewallen DG, Berry DJ, Maradit Kremers H. Avoiding Systematic Bias in Orthopedics Research through Informed Variable Selection: A Discussion of Confounders, Mediators, and Colliders Journal of Arthroplasty. 2022;under review. - PMC - PubMed
    1. Zaniletti I, Devick KL, Larson DL, Lewallen DG, Berry DJ, Maradit Kremers H. Measurement Error and Misclassification in Orthopedics: when study subjects are categorized in the wrong exposure or outcome groups. Journal of Arthroplasty. 2022;under review. - PMC - PubMed
    1. Zaniletti I, Devick KL, Larson DL, Lewallen DG, Berry DJ, Maradit Kremers H. Study Types in Orthopedics Research. Journal of Arthroplasty. 2022;under review. - PMC - PubMed

Publication types