. 2022 Sep 26;13(1):5652.
doi: 10.1038/s41467-022-32914-9.

McaA and McaB control the dynamic positioning of a bacterial magnetic organelle

Affiliations

McaA and McaB control the dynamic positioning of a bacterial magnetic organelle

Juan Wan et al. Nat Commun. .

Abstract

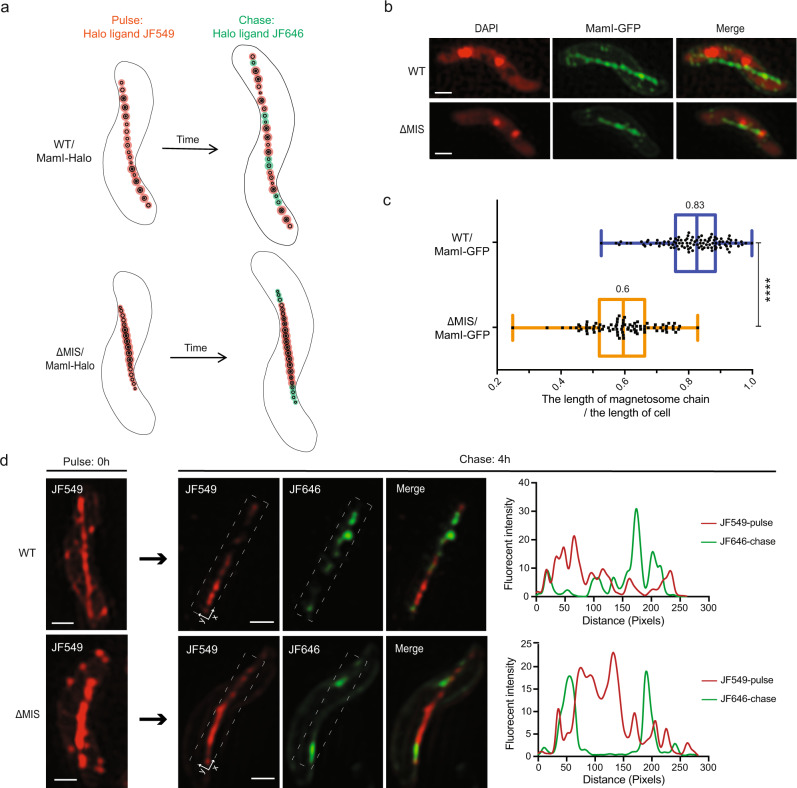
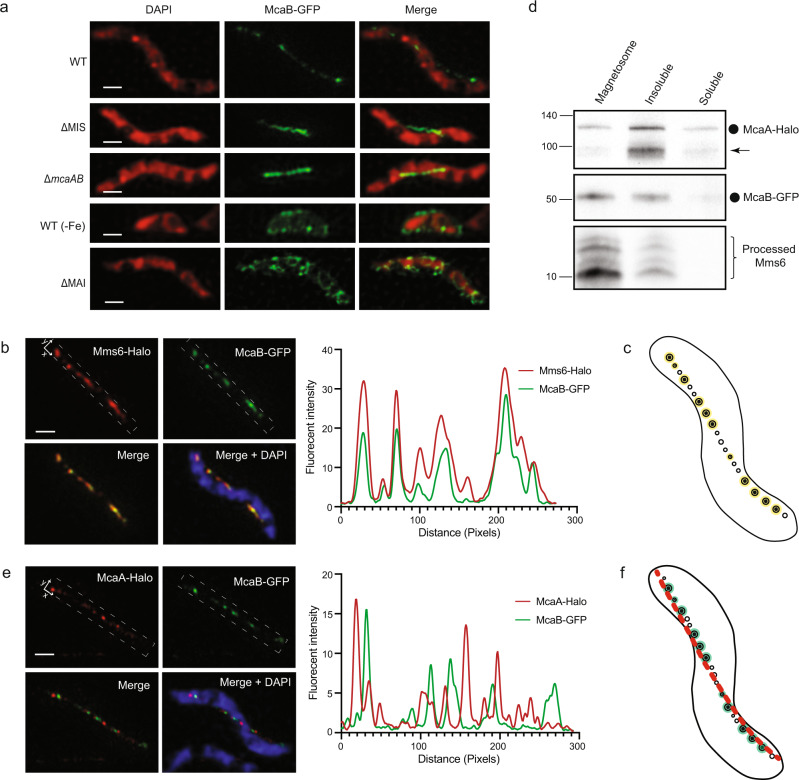
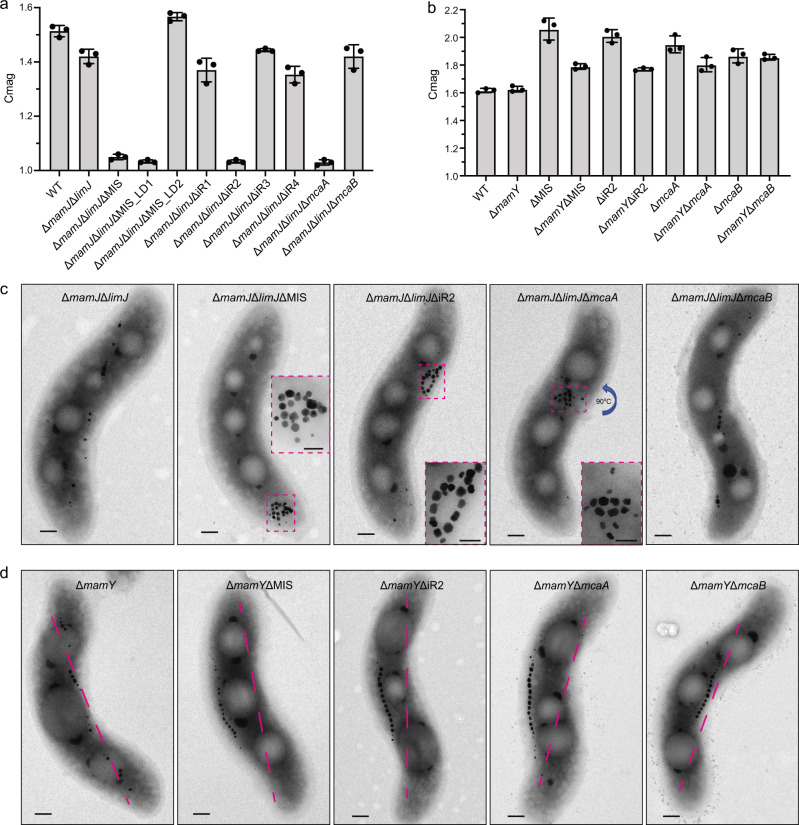
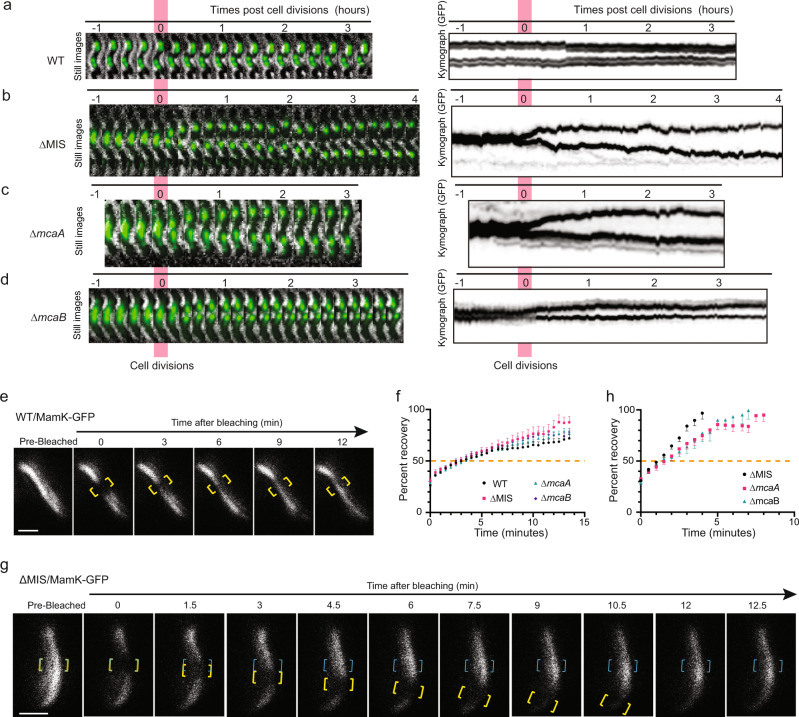
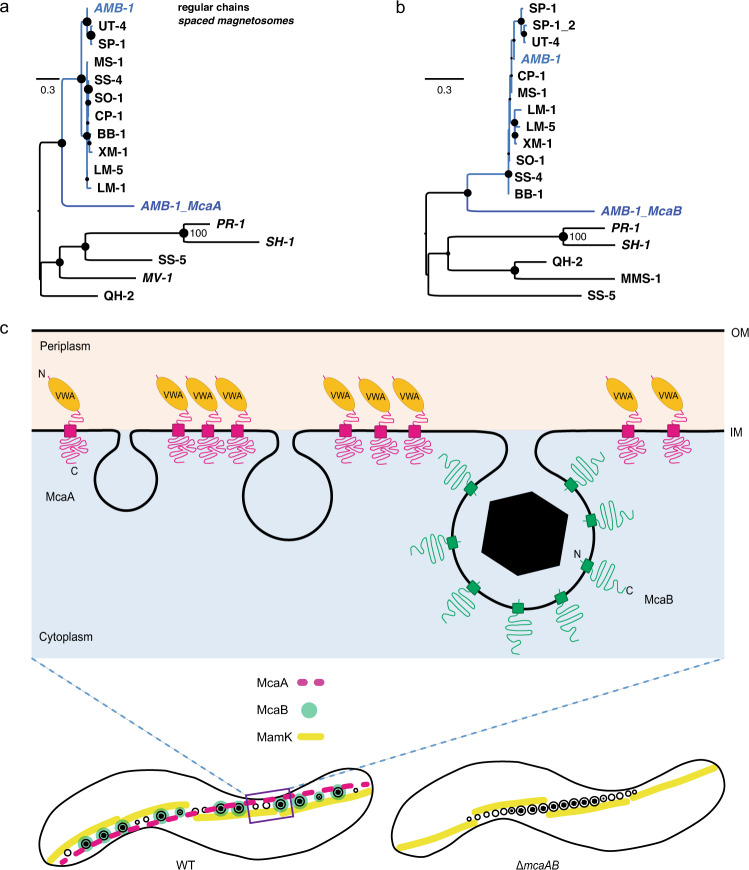
Magnetotactic bacteria are a diverse group of microorganisms that use intracellular chains of ferrimagnetic nanocrystals, produced within magnetosome organelles, to align and navigate along the geomagnetic field. Several conserved genes for magnetosome formation have been described, but the mechanisms leading to distinct species-specific magnetosome chain configurations remain unclear. Here, we show that the fragmented nature of magnetosome chains in Magnetospirillum magneticum AMB-1 is controlled by genes mcaA and mcaB. McaA recognizes the positive curvature of the inner cell membrane, while McaB localizes to magnetosomes. Along with the MamK actin-like cytoskeleton, McaA and McaB create space for addition of new magnetosomes in between pre-existing magnetosomes. Phylogenetic analyses suggest that McaA and McaB homologs are widespread among magnetotactic bacteria and may represent an ancient strategy for magnetosome positioning.


Conflict of interest statement

The authors declare no competing interests.

Figures

Fig. 1
Fig. 1. MIS genes contribute to the magnetosome chain assembly.
a Magnetic response (Cmag) of WT and ΔMIS cultures grown under microaerobic conditions. Each measurement represents the average and standard deviation from three independent growth cultures. b TEM micrographs of WT and ΔMIS cells. Scale bars = 0.2 µm. Insets: magnification of the magnetic crystals in magenta rectangles. Insets scale bars = 100 nm. c, d Segmented 3D models (upper panels) and selected area of tomographic slices (lower panels, Box i and ii) showing phenotypes of WT and ΔMIS strains. Magenta arrows point to the MamK filaments on the tomographic slices. The outer and inner cell membranes are depicted in dark blue, magnetosome membranes in yellow, magnetic particles in magenta, and magnetosome-associated filaments in green. Scale bars = 100 nm. Full tomograms are shown in Supplementary Movies 1 and 2. e, f Relative size and location of magnetosome vesicles in WT and ΔMIS cells, respectively (lower panels). EMs empty magnetosomes, CMs crystal-containing magnetosomes. Upper panels are 2D projections of magnetosomes from the 3D models in c and d. The magnetosome membranes are shown in light blue and magnetic particles are shown in red. g, h Edge-to-edge distance (the magenta two-end arrows on the tomographic slices of c and d) between all of the magnetosomes (g) and the EMs (h) that were measured from neighboring magnetosome membranes in WT (blue) and ΔMIS (orange) strains. Values represent the median. n = 199 (WT) and 206 (ΔMIS) in g, n = 26 for both WT and ΔMIS in h. Box plots indicate median (middle line), 25th, 75th percentile (box), and min/max (whiskers). P values were calculated by the two-sided Mann–Whitney U test. No statistically significant difference (P > 0.05, N.S.), significant difference (****P < 10−4). The source data of a, e, f, g, and h are provided as a Source Data file.
Fig. 2
Fig. 2. Pulse-chase experiments that characterize the addition of newly formed magnetosomes to the chain.
a Model of the pulse-chase experiment shows how the newly formed EMs are added to the magnetosome chains in WT and ΔMIS cells. b Representative maximum-intensity projection of 3D-SIM micrographs (generated from 3D z-stacks) of WT and ΔMIS cells expressing MamI-GFP under standard growth conditions. MamI-GFP proteins are located in the magnetosome chain and cytoplasmic membrane. Here and below: 4′,6-Diamidino-2-phenylindole (DAPI) is a fluorescent dye that binds to DNA, and used as an indicator of AMB-1 cell contour. The DAPI staining is shown in false-color red, and MamI-GFP is shown in green. c Quantification of the length of magnetosome chain versus the length of cell in WT (blue) and ΔMIS (orange) strains. Values represent the median. n = 103 for WT, n = 82 for ΔMIS. Box plots indicate median (middle line), 25th, 75th percentile (box), and min/max (whiskers). P value was calculated by the two-sided Mann–Whitney U test. Significant difference (****P < 10−4). The source data are provided as a Source Data file. d Representative maximum-intensity projection of 3D-SIM micrographs and fluorescent intensity maps (white dashed rectangular area) of the pulse-chase experiments with MamI-Halo fusion protein for analyzing the addition of newly formed magnetosomes in WT and ΔMIS cells. The JF549 staining is shown in red, and the JF646 staining is shown in green. Scale bars = 0.5 µm in b and d.
Fig. 3
Fig. 3. Comprehensive genetic dissection of the MIS genes.
a Schematic depicting the MIS region of AMB-1, including the predicted magnetosome gene homologs (black), the gene of a phage-associated protein (gray), the genes of transposases (white), and the hypothetical genes (yellow). LD1 and LD2, large domains 1 and 2. iR1-iR4, small islet regions 1–4. K, mamK-like; D, mamD-like; L, mamL-like; J, mamJ-like; E, mamE-like; I, mamI-like; F, mamF-like; Q, mamQ-like. mcaA, magnetosome chain assembly gene A. mcaB, magnetosome chain assembly gene B. b Cmag of WT and different mutants in the MIS region. Each measurement represents the average and standard deviation from three independent growth cultures. The source data are provided as a Source Data file. c TEM micrographs of ΔMIS_LD1 and ΔMIS_LD2 cells. Scale bars = 0.2 µm. d TEM micrographs of ΔiR1-ΔiR4, ΔmcaA, and ΔmcaB cells. Scale bars = 0.2 µm.
Fig. 4
Fig. 4. Localization of McaA.
a Predicted secondary structure and topology of McaA. The whole protein is shown in a light gray line. The conserved C-terminus region is highlighted in blue. SP signal peptide (magenta line), VWA von Willebrand factor type A domain (purple oval), TM transmembrane domain (black rectangle), MIDAS metal ion-dependent adhesion site (orange star). b Representative maximum-intensity projection of 3D-SIM micrographs shows a WT AMB-1 cell expressing McaA-GFP. c Consecutive z-slices with a distant spacing of 100 nm from the merged channel of b. d A model of magnetosome production and McaA (green) localization in a WT AMB-1 cell. e Representative maximum-intensity projection of 3D-SIM micrographs shows cells expressing McaA-GFP in different genetic backgrounds or growth conditions. f Models of magnetosome production and McaA (green) localization from e. g Representative maximum-intensity projection of 3D-SIM micrographs shows a ΔMAIΔMIS cell expressing McaA-GFP. h Consecutive z-slices with a distant spacing of 100 nm from the merged channel of g. i A model of magnetosome production and McaA (green) localization in a ΔMAIΔMIS cell. j Cmag of WT and mutated McaA-GFP expressed in ΔmcaA cells. The colors of the mutated regions correspond to the colored regions in a. Each measurement represents the average and standard deviation from three independent growth cultures. The source data are provided as a Source Data file. k Representative maximum-intensity projection of 3D-SIM micrographs of mutated McaA-GFP expressed in ΔmcaA cells. The DAPI staining is shown in false-color red and the GFP fusion proteins are shown in green. Scale bars = 0.5 µm.
Fig. 5
Fig. 5. Localization of McaB.
a Representative maximum-intensity projection of 3D-SIM micrographs shows the localization of McaB-GFP in WT and different genetic backgrounds. The DAPI staining is shown in false-color red and the GFP fusion proteins are shown in green. b Representative maximum-intensity projection of 3D-SIM micrographs and fluorescent intensity map (white dashed rectangular area) show the localization of Mms6-Halo and McaB-GFP in WT. c A model of the colocalization (yellow) of Mms6 and McaB at CMs from b. d Immunoblotting shows that McaA and McaB are enriched in different cellular fractionations. McaA-Halo was detected with anti-Halo antibodies, McaB-GFP was detected with anti-GFP antibodies, and Mms6 was detected with anti-Mms6 antibodies. Full-length McaA-Halo (~118 kDa) and McaB-GFP (~52 kDa) proteins are marked with a circle. The unknown McaA-Halo-related bands are marked with an arrow. The four proteolytically processed Mms6 fragments are marked with a right brace. The source data are provided as a Source Data file. See more details and controls in Supplementary Fig. 10e–h. e Representative maximum-intensity projection of 3D-SIM micrographs and fluorescent intensity map (white dashed rectangular area) show the localization of McaA-Halo and McaB-GFP in WT. f A model of the association of McaA (red) and McaB (green) with magnetosomes from e. In b and e, the DAPI staining is shown in blue, the JF549-stained Halo proteins are shown in red, and the GFP fusion proteins are shown in green. Scale bars = 0.5 µm.
Fig. 6
Fig. 6. Addition of newly formed magnetosomes to the chain from iron starvation to standard iron growth conditions.
a Representative maximum-intensity projection of 3D-SIM micrographs of WT, ΔMIS, and ΔmcaAB cells expressing MamI-GFP under iron starvation growth conditions. The DAPI staining is shown in false-color red, and MamI-GFP is shown in green. MamI-GFP proteins are located in the magnetosome chain and cytoplasmic membrane. b A model of how McaA and McaB coordinate to control the addition of newly formed magnetosomes in WT and ΔMIS/ΔmcaAB cells. A continuous chain of EMs is generated in the middle of both WT and McaAB deficient cells under iron starvation conditions. After the iron is added to the medium, magnetic crystals are mineralized in the existing EMs,. Once EMs become CMs, the McaB is recruited to CMs and helps locating CMs to the gaps of dashed McaA, thereby increasing the distance between CMs, which allows the addition of newly formed EMs between CMs in WT AMB-1. In the absence of McaAB, CMs are closely located with each other, and the newly formed EMs have to be added at both ends of the chain. c Representative maximum-intensity projection of 3D-SIM micrographs and fluorescent intensity maps (white dashed rectangular area) of the pulse-chase experiments with MamI-Halo fusion protein for analyzing the addition of newly formed magnetosomes in different AMB-1 genetic backgrounds from iron starvation to standard iron growth conditions. The JF549 staining is shown in red, and the JF646 staining is shown in green. Scale bars = 0.5 µm in a and c.
Fig. 7
Fig. 7. McaA prevents magnetosome chain aggregation and directs the chain to the positively curved cytoplasmic membrane in AMB-1.
a, b Cmag of WT and different mutants in the ΔmamJΔlimJ (a) and ΔmamY (b) backgrounds. Each measurement represents the average and standard deviation from three independent growth cultures. The source data are provided as a Source Data file. c TEM micrographs of ΔmamJΔlimJ, ΔmamJΔlimJΔMIS, ΔmamJΔlimJΔiR2 (also called ΔmamJΔlimJΔmacAB), ΔmamJΔlimJΔmcaA, and ΔmamJΔlimJΔmcaB cells. Scale bars = 0.2 µm. Insets: magnification of the magnetic crystals in magenta rectangles. Insets scale bars = 100 nm. d TEM micrographs of ΔmamY, ΔmamYΔMIS, ΔmamYΔiR2 (also called ΔmamYΔmacAB), ΔmamYΔmcaA, and ΔmamYΔmcaB cells. The magenta dashed lines indicate the positive inner curvature of AMB-1 cells where magnetosomes are normally located. Scale bars = 0.2 µm.
Fig. 8
Fig. 8. Live-cell imaging shows the behavior of magnetosome chains and dynamics of MamK filaments.
ad Effects of mcaA and mcaB deletions on magnetosome segregation. Live-cell time-lapse imaging of magnetosome segregation in WT (a), ∆MIS (b), ∆mcaA (c), and ∆mcaB (d) cells during cell division. Magnetosomes were labeled with Mms6-GFP. Left: GFP fluorescence and bright-field merged time-lapse still images. Right: kymographs of Mms6-GFP signals in maximum projection. e A FRAP experiment time course with a WT AMB-1 cell expressing MamK-GFP. Yellow brackets indicate the portion of the MamK-GFP filament designated for photobleaching. g A FRAP experiment time course with an ∆MIS cell expressing MamK-GFP where the bleached area moved from its original position toward the cell pole. Yellow and blue brackets indicate the portion of the MamK-GFP filament designated for photobleaching. Blue brackets indicate the original bleaching area, and yellow brackets track the movement of the bleached area. The MamK-GFP is shown in false-color white in e and g. Scale bars = 1 µm in e and g. f, h Normalized (average mean and standard error of mean [SEM]) percent recovery of each strain’s recovering cells with non-moving (f) and moving (h) bleached area. n = 23 (WT), 20 (ΔMIS), 28 (ΔmacA), and 24 (ΔmcaB) cells in f. n = 15 (ΔMIS), 8 (ΔmacA), and 10 (ΔmcaB) cells in h. See more details in Supplementary Fig. 14. The 50% mark is noted with a dashed orange line. The source data are provided as a Source Data file.
Fig. 9
Fig. 9. Phylogenetic analysis and model of McaAB-mediated magnetosome chain assembly.
a, b Maximum likelihood trees showing the ancestry of McaA (a) and McaB (b) proteins in relation to their homologs in freshwater magnetotactic Rhodospirillaceae (blue clade) and the external groups of other Proteobacteria. All strains’ accession numbers are given in Supplementary Dataset 1. Trees were drawn to scale and branch length refers to the number of substitutions per site. Robustness of the internal branches is symbolized by a circle whose size is proportional to the bootstrap value estimated from 500 nonparametric replicates. The magnetosome chains in these strains were previously characterized. If magnetosomes are spaced from each other similarly to strain AMB-1, names are in italics. c McaA serves as a landmark on the positively curved inner membrane and coordinates with McaB to control the location of CMs to the gap region of dashed McaA. As a consequence, the neighboring CMs are separated from each other, which allows the addition of newly formed EMs to multiple sites of the magnetosome chain in WT AMB-1. Alternatively, the CMs are located closely together without McaAB, leaving no space for the addition of newly formed EMs between CMs but at both ends of the magnetosome chain. McaAB also influences the dynamics of MamK filaments to control the dynamic positioning of magnetosomes during the whole cell cycle. OM outer membrane, IM inner membrane.

Similar articles

Cited by

References

    1. van Bergeijk P, Hoogenraad CC, Kapitein LC. Right time, right place: probing the functions of organelle positioning. Trends Cell Biol. 2016;26:121–134. doi: 10.1016/j.tcb.2015.10.001. - DOI - PubMed
    1. Grant CR, Wan J, Komeili A. Organelle formation in bacteria and archaea. Annu Rev. Cell Dev. Biol. 2018;34:217–238. doi: 10.1146/annurev-cellbio-100616-060908. - DOI - PubMed
    1. Grant, C. R. et al. Distinct gene clusters drive formation of ferrosome organelles in bacteria. Nature606, 160–164 (2022). - PMC - PubMed
    1. Racki LR, et al. Polyphosphate granule biogenesis is temporally and functionally tied to cell cycle exit during starvation in Pseudomonas aeruginosa. Proc. Natl Acad. Sci. USA. 2017;114:E2440–e2449. doi: 10.1073/pnas.1615575114. - DOI - PMC - PubMed
    1. Dobro, M. J. et al. Uncharacterized bacterial structures revealed by electron cryotomography. J. Bacteriol.199, e00100–17 (2017). - PMC - PubMed

Publication types