. 2022 Sep 26;13(1):5546.
doi: 10.1038/s41467-022-33223-x.

Battery-free wireless imaging of underwater environments

Affiliations

Battery-free wireless imaging of underwater environments

Sayed Saad Afzal et al. Nat Commun. .

Erratum in

Abstract

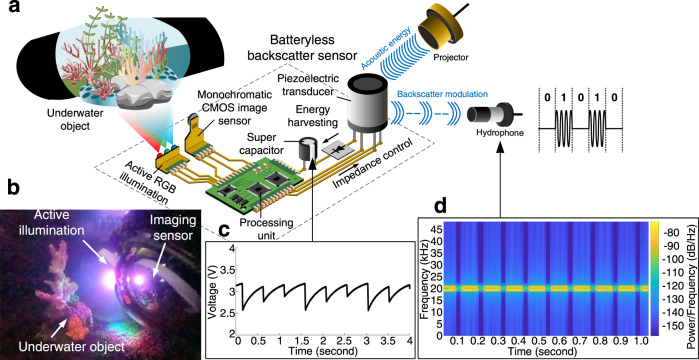
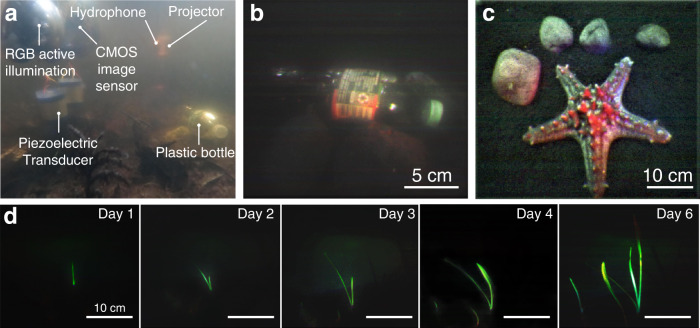
Imaging underwater environments is of great importance to marine sciences, sustainability, climatology, defense, robotics, geology, space exploration, and food security. Despite advances in underwater imaging, most of the ocean and marine organisms remain unobserved and undiscovered. Existing methods for underwater imaging are unsuitable for scalable, long-term, in situ observations because they require tethering for power and communication. Here we describe underwater backscatter imaging, a method for scalable, real-time wireless imaging of underwater environments using fully-submerged battery-free cameras. The cameras power up from harvested acoustic energy, capture color images using ultra-low-power active illumination and a monochrome image sensor, and communicate wirelessly at net-zero-power via acoustic backscatter. We demonstrate wireless battery-free imaging of animals, plants, pollutants, and localization tags in enclosed and open-water environments. The method's self-sustaining nature makes it desirable for massive, continuous, and long-term ocean deployments with many applications including marine life discovery, submarine surveillance, and underwater climate change monitoring.


Conflict of interest statement

F.A. is a founder of Cartesian Systems. R.G. is an employee at Apple. The remaining authors declare no competing interests.

Figures

Fig. 1
Fig. 1. Overview of underwater backscatter imaging.
a A remote acoustic projector (top right) transmits sound on the downlink. The acoustic energy is harvested by a piezoelectric transducer and converted to electrical energy that powers up the batteryless backscatter sensor node. The energy accumulates in a super-capacitor that powers up an FPGA unit, a monochromatic CMOS sensor that captures an image, and three LEDs which enable RGB active illumination. The captured image is communicated via acoustic backscatter modulation on the uplink, and a remote hydrophone measures the reflection patterns to reconstruct the transmitted image. b The batteryless sensor is shown in an experimental trial where it is used to image an underwater object with active illumination that enables capturing color images. c The plot shows the voltage in the supercapacitor, which is harvested from acoustic energy and varies over time as a function of the power consumption of different processing stages. d The spectrogram shows the frequency response of the signal received by the hydrophone over time, demonstrating its ability to capture reflection patterns due to backscatter modulation and decode them into binary to recover the transmitted image.
Fig. 2
Fig. 2. Active illumination in underwater backscatter imaging.
a To recover color images with a monochrome sensor, the camera alternates between activating three LEDs—red, green, and blue. The top figures show the illuminated scene, while the bottom figures show the corresponding captured monochromatic images, which are transmitted to a remote receiver. b The figure shows the color image output synthesized by the receiver using multi-illumination pixels which are constructed by combining the monochromatic image output for each of the three active illumination LEDs. c A side view of the camera prototype demonstrates a larger dome which houses the CMOS image sensor and a smaller dome which contains the RGB LEDs for active illumination. The structure is connected to a piezoelectric transducer. d The circuit schematic demonstrates how the imaging method operates at net-zero power by harvesting acoustic energy and communicating via backscatter modulation. e The plots show the power consumption over time. The power consumption peaks during active imaging and drops when the captured images are being backscattered.
Fig. 3
Fig. 3. Sample images obtained using underwater backscatter imaging.
a The figure shows a photo of a prototype deployed in Keyser Pond for monitoring pollution from plastic bottles on the lakebed. b The RGB image output obtained from the imaging method while monitoring pollution in Keyser Pond. c RGB image output for Protoreaster linckii, demonstrating qualitative success in recovering its color and numerous tubercles along the starfish’s five arms. d The imaging method was used to monitor the growth of an Aponogeton ulvaceus over a week. The figures show the captured images on different days of the week.
Fig. 4
Fig. 4. Captured images of AprilTag markers demonstrate successful underwater inference and localization.
a The prototype was used to detect and localize submerged localization tags. b An image of the AprilTag obtained using a batteryless prototype. c The estimated location of the AprilTag is plotted in red as a function of its actual location, and the detection rate of AprilTag is plotted in green as a function of distance. d Harvested voltage is plotted as a function of distance between the transmitter and the batteryless camera prototype. The dots indicate the voltage at depths, while the contour indicates the maximum voltage obtained when the node’s depth is varied over the entire water column at the corresponding distance. e SNR and BER of the imaging method are plotted as a function of distance. The lower and upper bound of the orange band around the SNR plot indicate the 10th and 90th percentile of the collected SNR data at the corresponding distance. The dotted and solid lines show the BER of the imaging method before and after equalization, respectively.

References

    1. Nagelkerken I, Russell BD, Gillanders BM, Connell SD. Ocean acidification alters fish populations indirectly through habitat modification. Nat. Clim. Change. 2016;6:89–93. doi: 10.1038/nclimate2757. - DOI
    1. Mullen AD, et al. Underwater microscopy for in situ studies of benthic ecosystems. Nat. Commun. 2016;7:1–9. doi: 10.1038/ncomms12093. - DOI - PMC - PubMed
    1. Payne NL, et al. Great hammerhead sharks swim on their side to reduce transport costs. Nat. Commun. 2016;7:1–5. doi: 10.1038/ncomms12289. - DOI - PMC - PubMed
    1. Katija K, Choy CA, Sherlock RE, Sherman AD, Robison BH. From the surface to the seafloor: How giant larvaceans transport microplastics into the deep sea. Sci. Adv. 2017;3:e1700715. doi: 10.1126/sciadv.1700715. - DOI - PMC - PubMed
    1. Corliss JB, et al. Submarine thermal springs on the Galapagos Rift. Science. 1979;203:1073–1083. doi: 10.1126/science.203.4385.1073. - DOI - PubMed

Publication types