. 2023 Jan;17(1):47-58.
doi: 10.1038/s41396-022-01319-3. Epub 2022 Sep 26.

Diazotrophs are overlooked contributors to carbon and nitrogen export to the deep ocean

Affiliations

Diazotrophs are overlooked contributors to carbon and nitrogen export to the deep ocean

Sophie Bonnet et al. ISME J. 2023 Jan.

Abstract

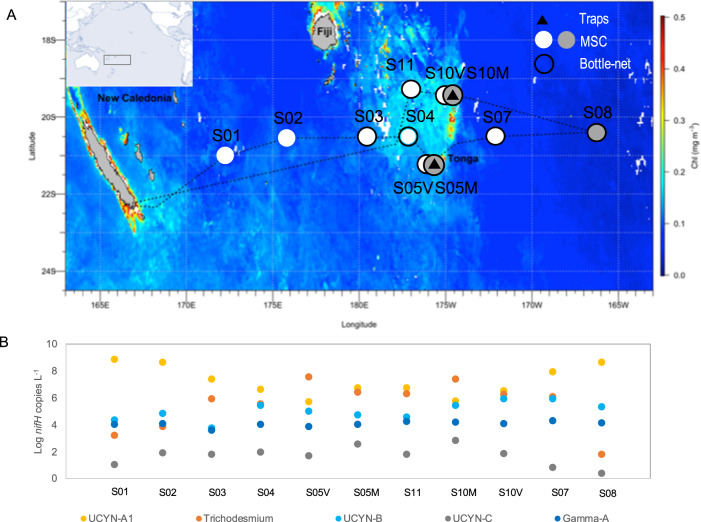
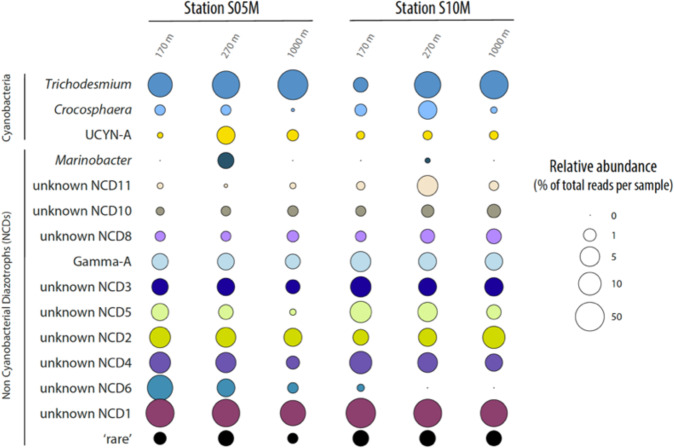
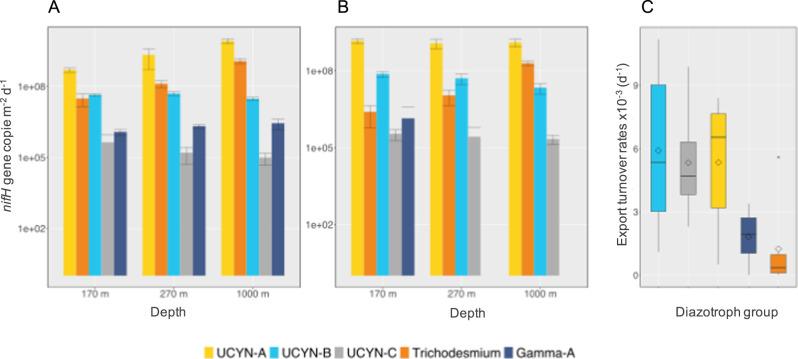
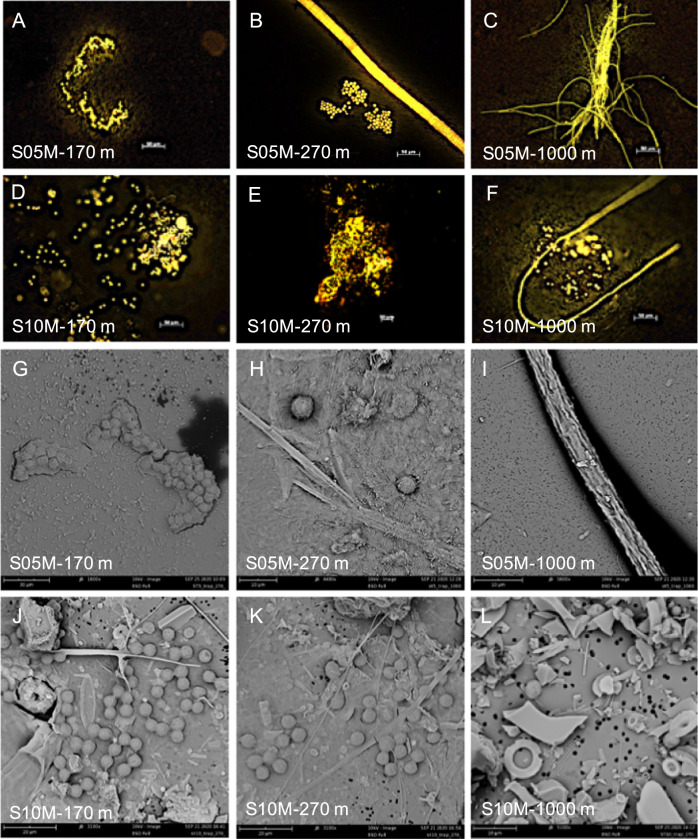
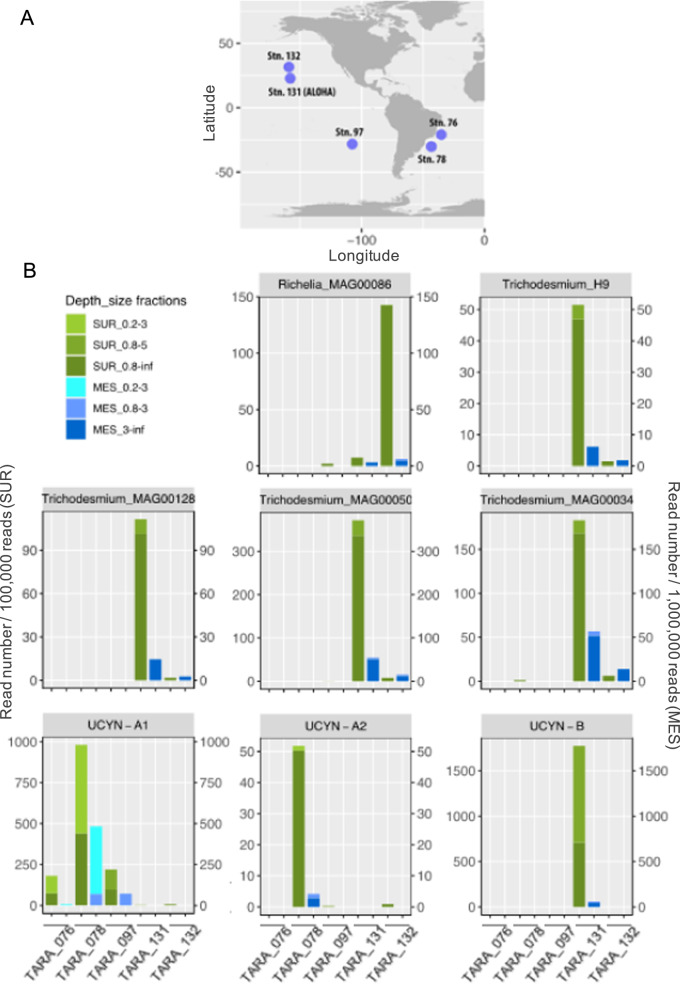
Diazotrophs are widespread microorganisms that alleviate nitrogen limitation in 60% of our oceans, thereby regulating marine productivity. Yet, the group-specific contribution of diazotrophs to organic matter export has not been quantified, which so far has impeded an accurate assessment of their impact on the biological carbon pump. Here, we examine the fate of five groups of globally-distributed diazotrophs by using an original combination of mesopelagic particle sampling devices across the subtropical South Pacific Ocean. We demonstrate that cyanobacterial and non-cyanobacterial diazotrophs are exported down to 1000 m depth. Surprisingly, group-specific export turnover rates point to a more efficient export of small unicellular cyanobacterial diazotrophs (UCYN) relative to the larger and filamentous Trichodesmium. Phycoerythrin-containing UCYN-B and UCYN-C-like cells were recurrently found embedded in large (>50 µm) organic aggregates or organized into clusters of tens to hundreds of cells linked by an extracellular matrix, presumably facilitating their export. Beyond the South Pacific, our data are supported by analysis of the Tara Oceans metagenomes collected in other ocean basins, extending the scope of our results globally. We show that, when diazotrophs are found in the euphotic zone, they are also systematically present in mesopelagic waters, suggesting their transport to the deep ocean. We thus conclude that diazotrophs are a significant part of the carbon sequestered in the deep ocean and, therefore, they need to be accounted in regional and global estimates of export.


Conflict of interest statement

The authors declare no competing interests.

Figures

Fig. 1
Fig. 1. Sampling stations and surface diazotroph abundances.
A Satellite-derived surface chlorophyll a concentrations during the GPpr14 cruise (1 November-6 December 2019) (MODIS Aqua, 4 km, 8-days composite, level 3 product). Black triangles correspond to stations where surface-tethered drifting sediment traps were deployed (170 m, 270 m, 1000 m). Grey dots correspond to stations where Marine Snow Catcher (MSC) casts were performed at three depths (see Methods), and white dots to MSC casts performed at one depth (200 m). Black circles correspond to stations where the bottlenet profiles were performed between 2000 m and 200 m. B Abundances (Log10 nifH gene copies L−1) of the five nifH phylotypes targeted over the transect (dots represent abundances averaged over the photic layer, ~0–100 m).
Fig. 2
Fig. 2. Relative abundance of diazotroph groups in sediment trap samples across depths (170 m, 270 m, 1000 m) at stations S05M and S10M.
Diazotroph groups are defined as ASVs sharing more than 95% nucleotide identity. Diazotroph groups contributing less than 1% were pooled together and are shown as ‘rare’. Values are presented in log10 scale.
Fig. 3
Fig. 3. Quantification of diazotrophs in sediment traps.
Export flux (nifH gene copies m−2 d−1) of the five diazotroph groups targeted by qPCR (UCYN-A1 symbiosis, UCYN-B, UCYN-C, Trichodesmium and Gamma-A) in sediment trap samples at 170 m, 270 m and 1000 m at A station S05M and B station S10M. Error bars represent strandard deviations from triplicate aliquotes analyzed in duplicates. C Export turnover rates (d−1)=export flux (nifH copies m−2 d−1)/integrated abundance over the photic layer (nifH copies m−2). The average export flux of the 3 sediment trap depths was used for the calculation.
Fig. 4
Fig. 4. Microscopy images showing examples of phycoerythrin-containing UCYN-like cells and Trichodesmium in sediment trap samples collected at 170 m, 270 m, and 1000 m at stations S05M and S10M.
AF Images taken by epifluorescence microscopy (green excitation 510–560 nm, scale bar: 50 µm). GL Images taken by scanning electron microscopy (SEM).
Fig. 5
Fig. 5. Diazotroph communities collected from Marine Snow Catcher (MSC) samples.
A Relative contribution of diazotroph groups detected in different MSC fractions (suspended, fast sinking and slow sinking). As in Fig. 2, diazotroph groups are defined as ASVs sharing more than 95% nucleotide identity. Diazotroph groups contributing less than 0.5% on average across samples were pooled together and are shown as ‘other Cyanobacteria’ and ‘other NCDs’ if they were taxonomically classified as ‘Cyanobacteria’ and as ‘Non-Cyanobacteria’ respectively. B Non- metric multidimensional scaling (NMDS) plot based on Bray–Curtis distances of taxonomic composition of diazotroph communities. Symbols indicate diazotroph communities from different MSC fractions. Sampling stations are colored based on the distance to the Tonga volcanic arc (mesotrophic stations), i.e., darker colors indicate samples located closer to the arc area than lighter colors.
Fig. 6
Fig. 6. Distribution of diazotrophic cyanobacteria in surface and mesopelagic waters during the Tara Oceans expedition.
A Geographical location of the Tara oceans stations used in this study. Only stations in which metagenomic reads belonging to nifH gene sequences from distinct cyanobacterial diazotrophs were present in surface and metagenomes were available both from surface and mesopelagic waters were selected. B Abundance of metagenomic reads recruited against different diazotrophic cyanobacteria genomes in surface and mesopelagic samples. See Table S3 for the complete dataset. Note that to better visualize the data, read abundance was expressed as number of reads per 100,000 total reads for surface samples (left axis) and per 1,000,000 total reads for mesopelagic samples (right axis).

References

    1. Moore CM, Mills MMM, Arrigo KR, Berman-Frank I, Bopp L, Boyd PW, et al. Processes and patterns of oceanic nutrient limitation. Nat Geosci. 2013;6:701–10. doi: 10.1038/ngeo1765. - DOI
    1. Gruber N. The marine nitrogen cycle: overview and challenges. Nitrogen in the marine environment. 2008;2:1–50.
    1. Eppley RW, Peterson BJ. The flux of particulate organic matter to the deep ocean and its relation to planktonic new production. Nature. 1979;282:677–80. doi: 10.1038/282677a0. - DOI
    1. Mulholland MR. The fate of nitrogen fixed by diazotrophs in the ocean. Biogeosciences. 2007;4:37–51. doi: 10.5194/bg-4-37-2007. - DOI
    1. Zehr JP, Capone DG. Changing perspectives in marine nitrogen fixation. Science. 2020;368:eaay9514. doi: 10.1126/science.aay9514. - DOI - PubMed

Publication types