. 2022 Oct;54(10):1564-1571.
doi: 10.1038/s41588-022-01180-2. Epub 2022 Sep 26.

Single-cell genome sequencing of human neurons identifies somatic point mutation and indel enrichment in regulatory elements

Affiliations

Single-cell genome sequencing of human neurons identifies somatic point mutation and indel enrichment in regulatory elements

Lovelace J Luquette et al. Nat Genet. 2022 Oct.

Abstract

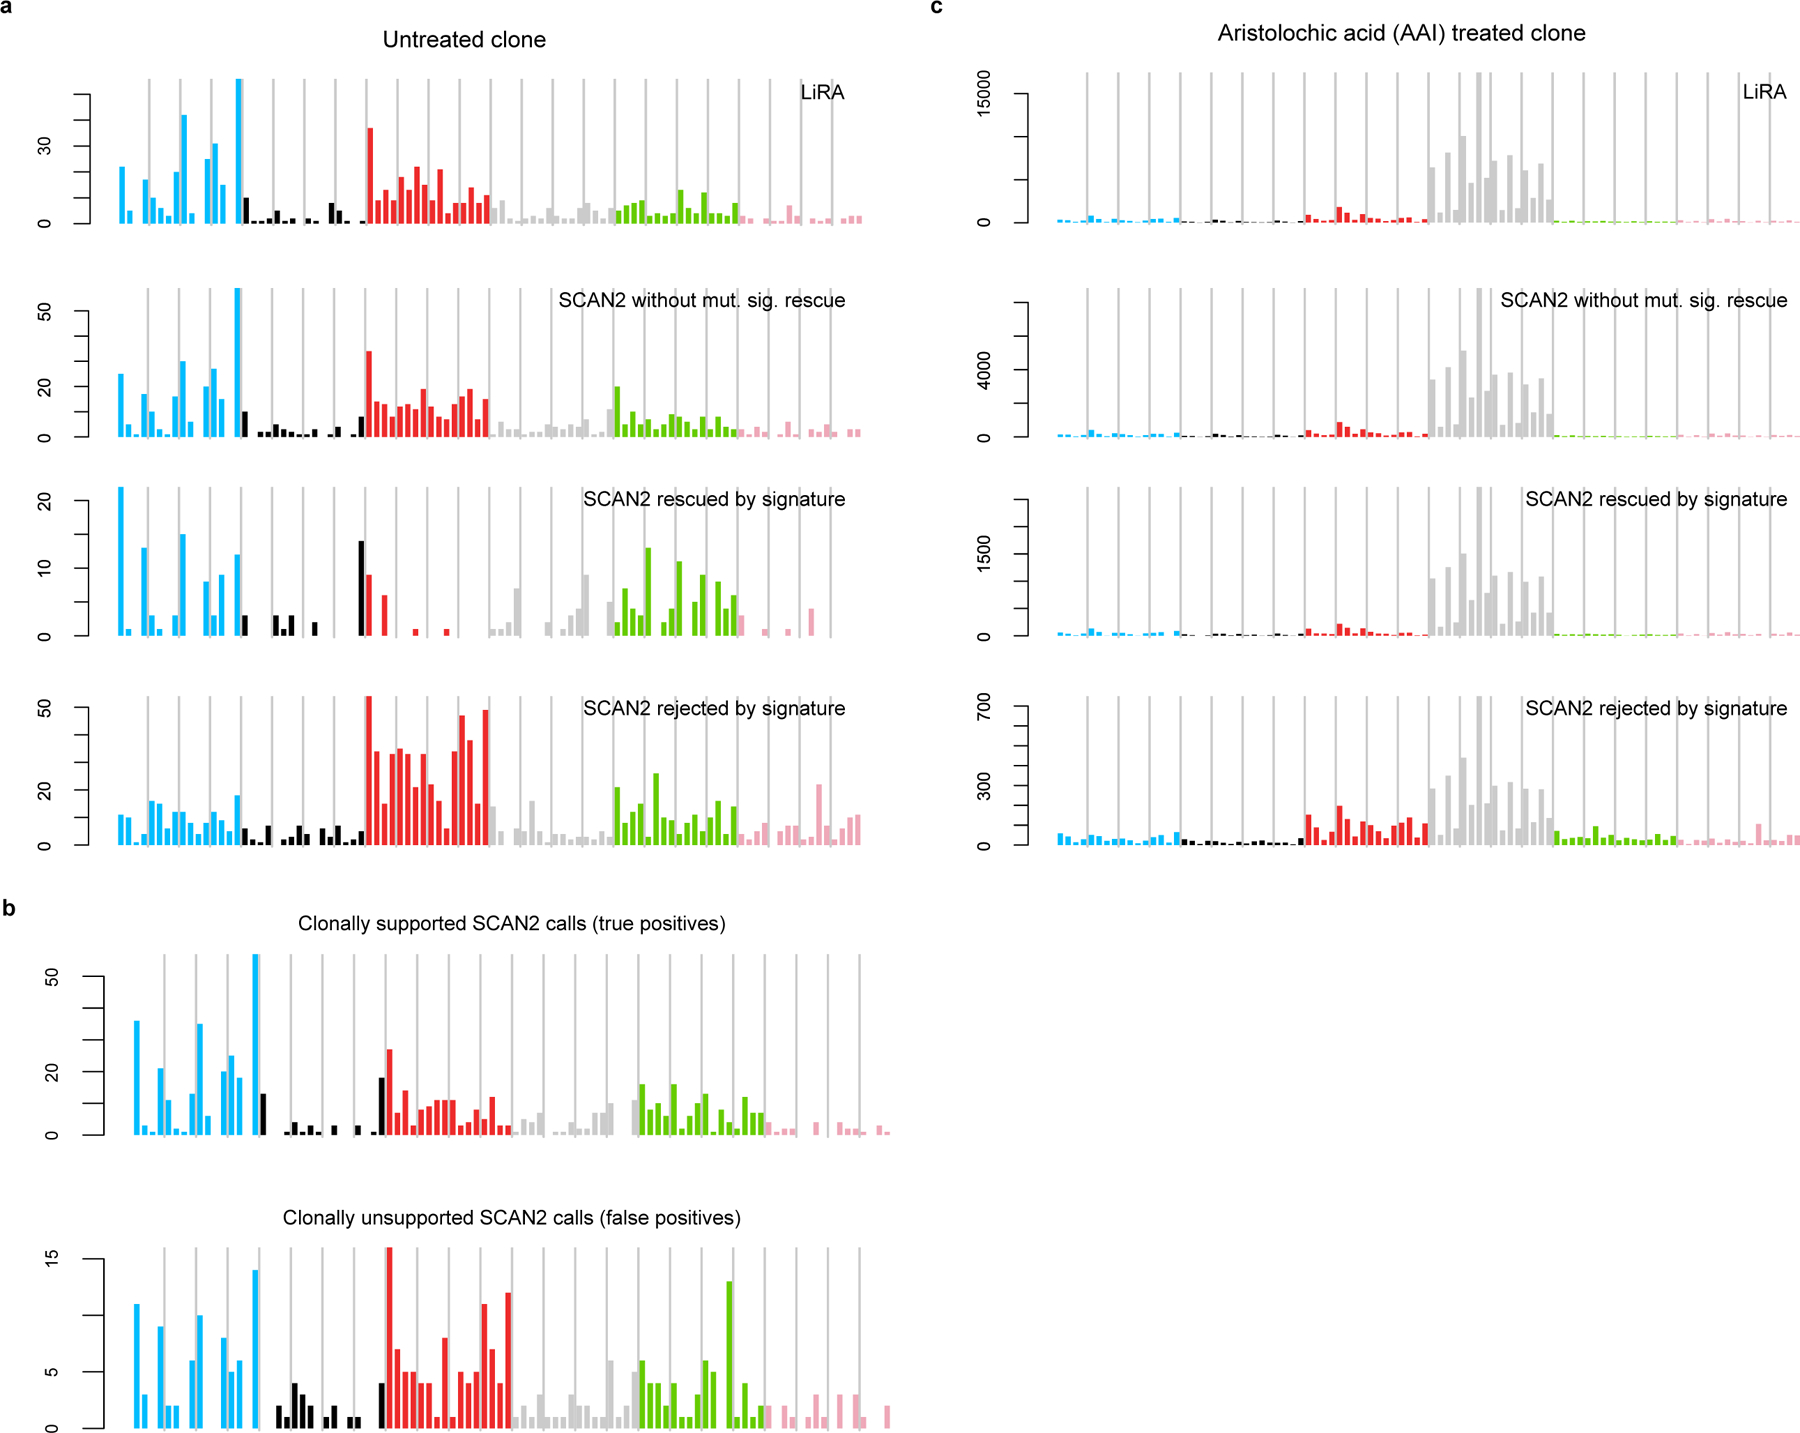
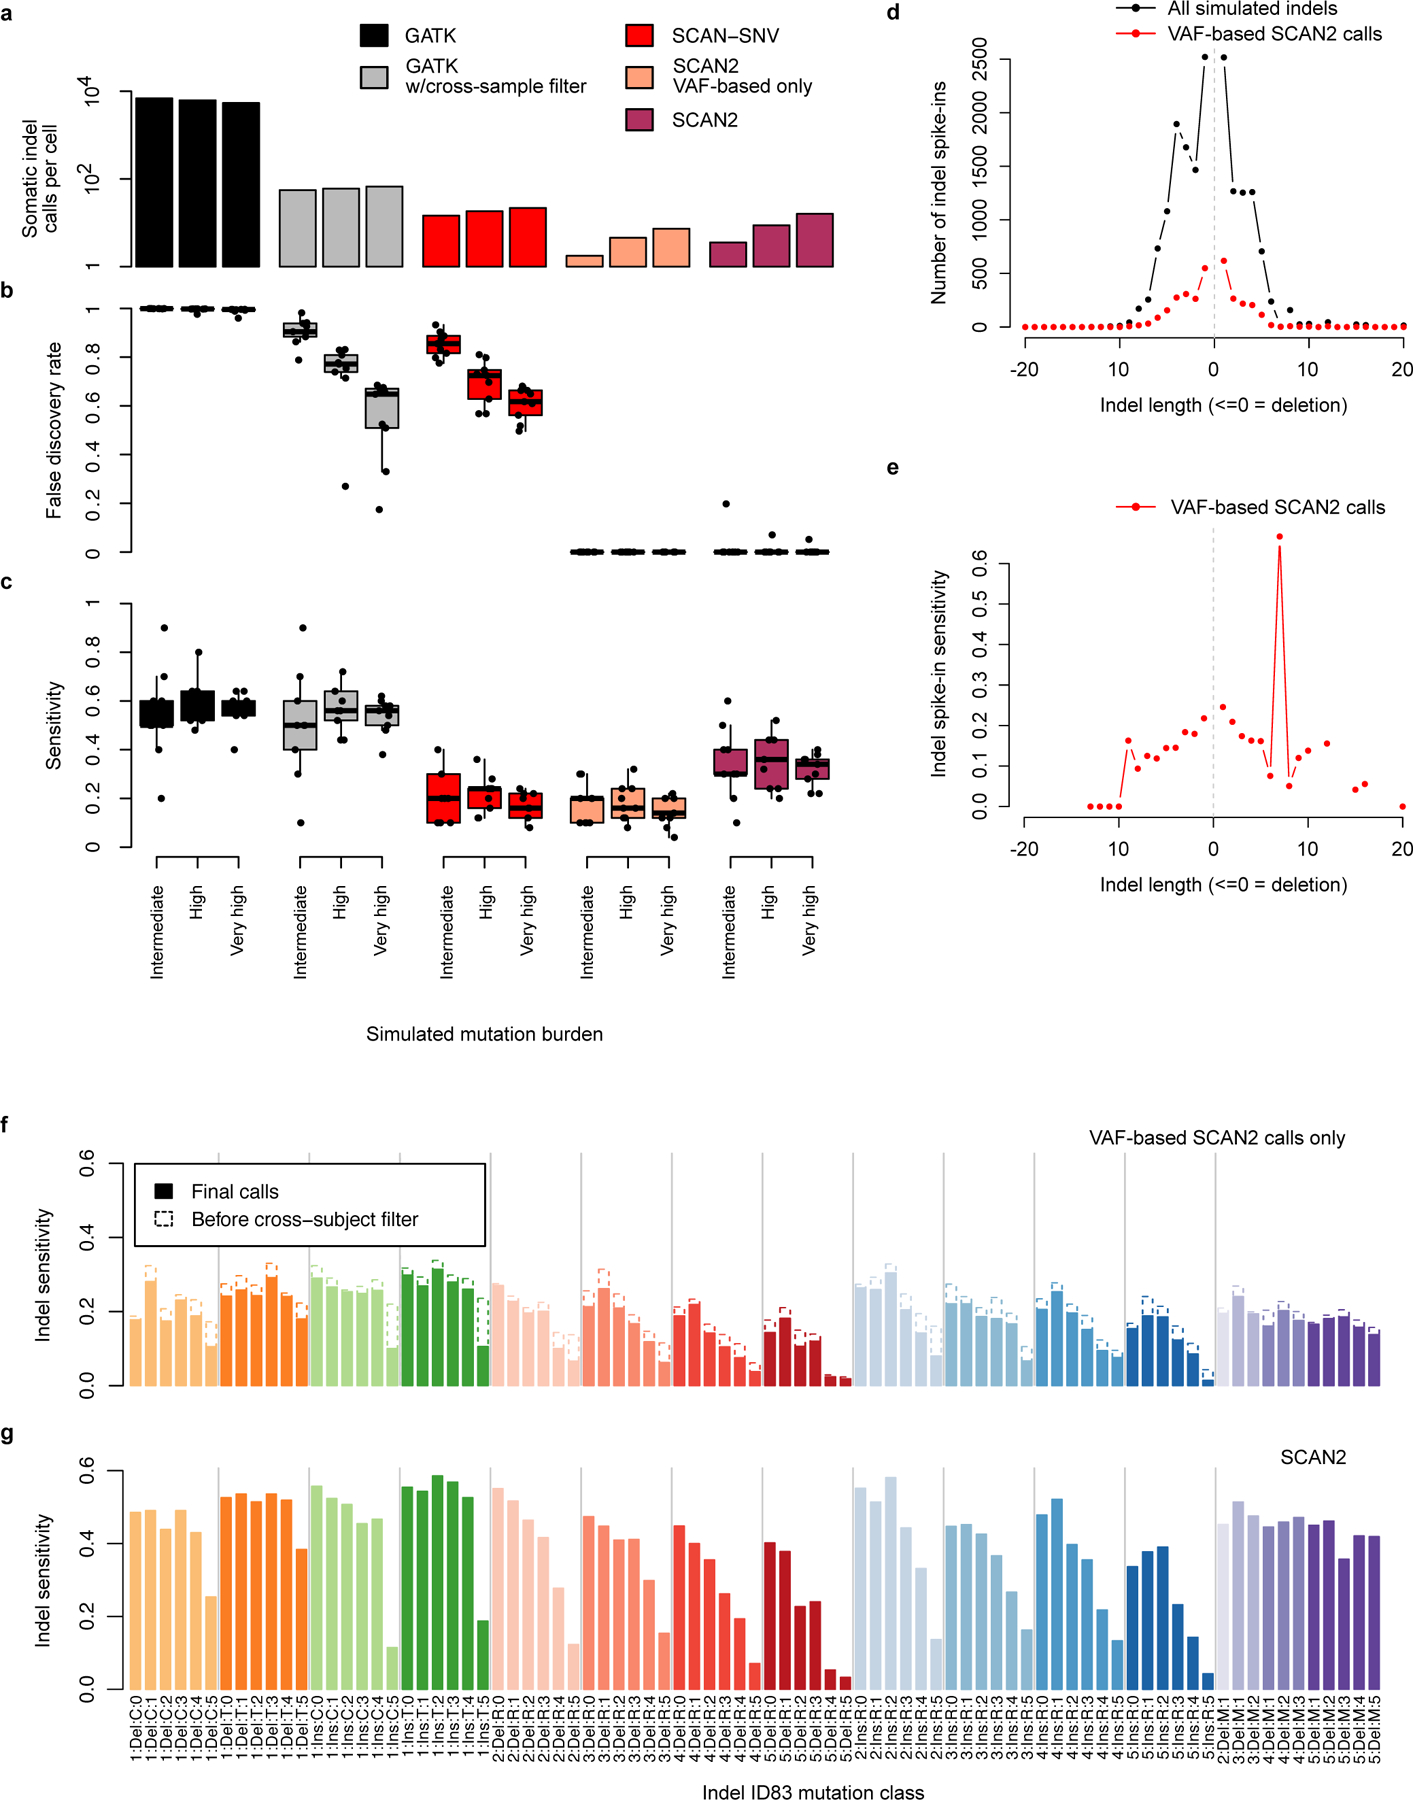
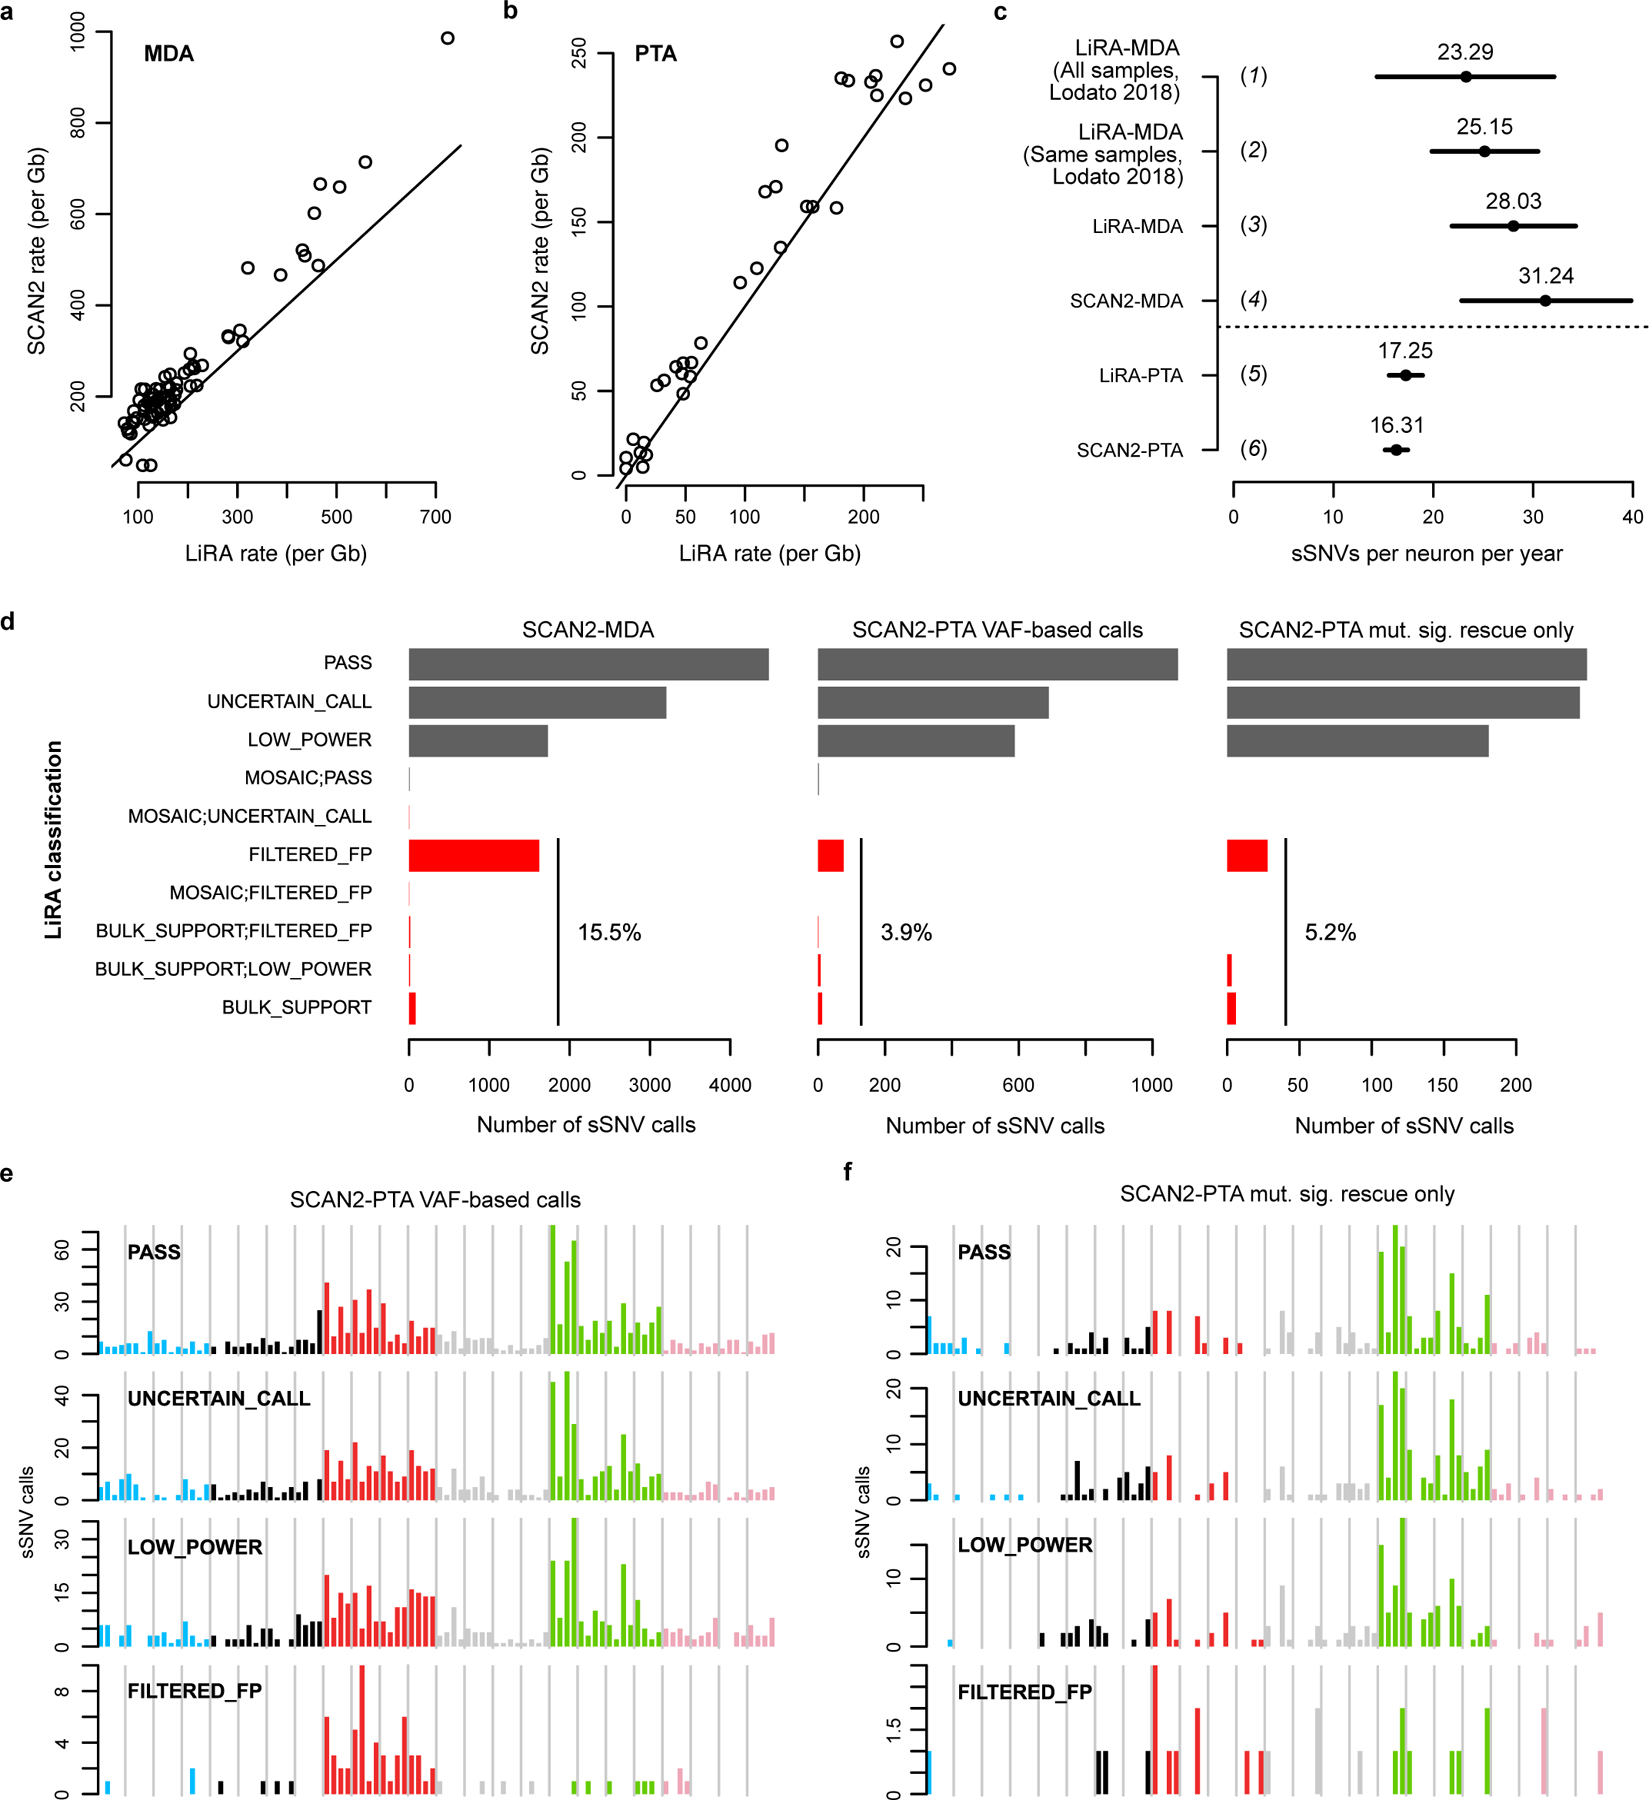
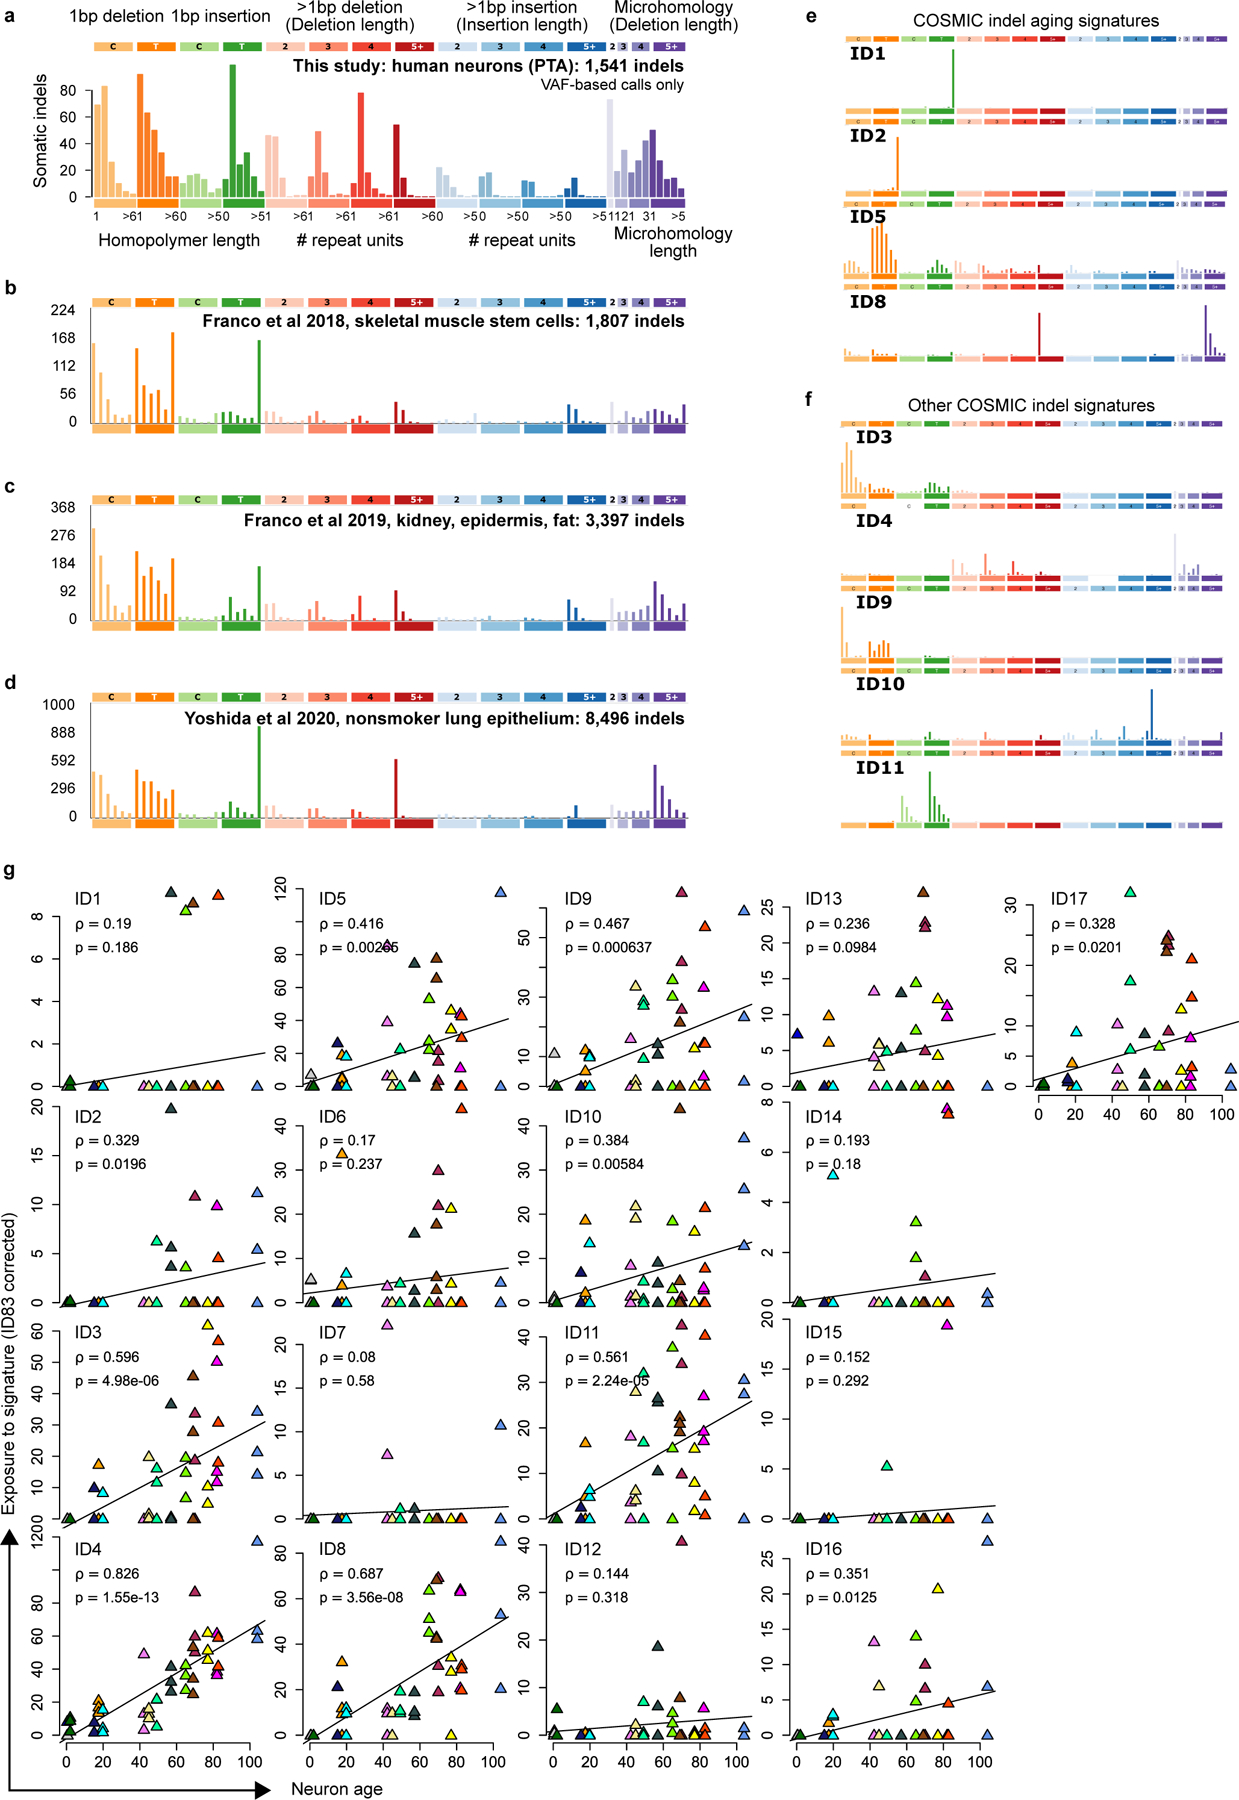
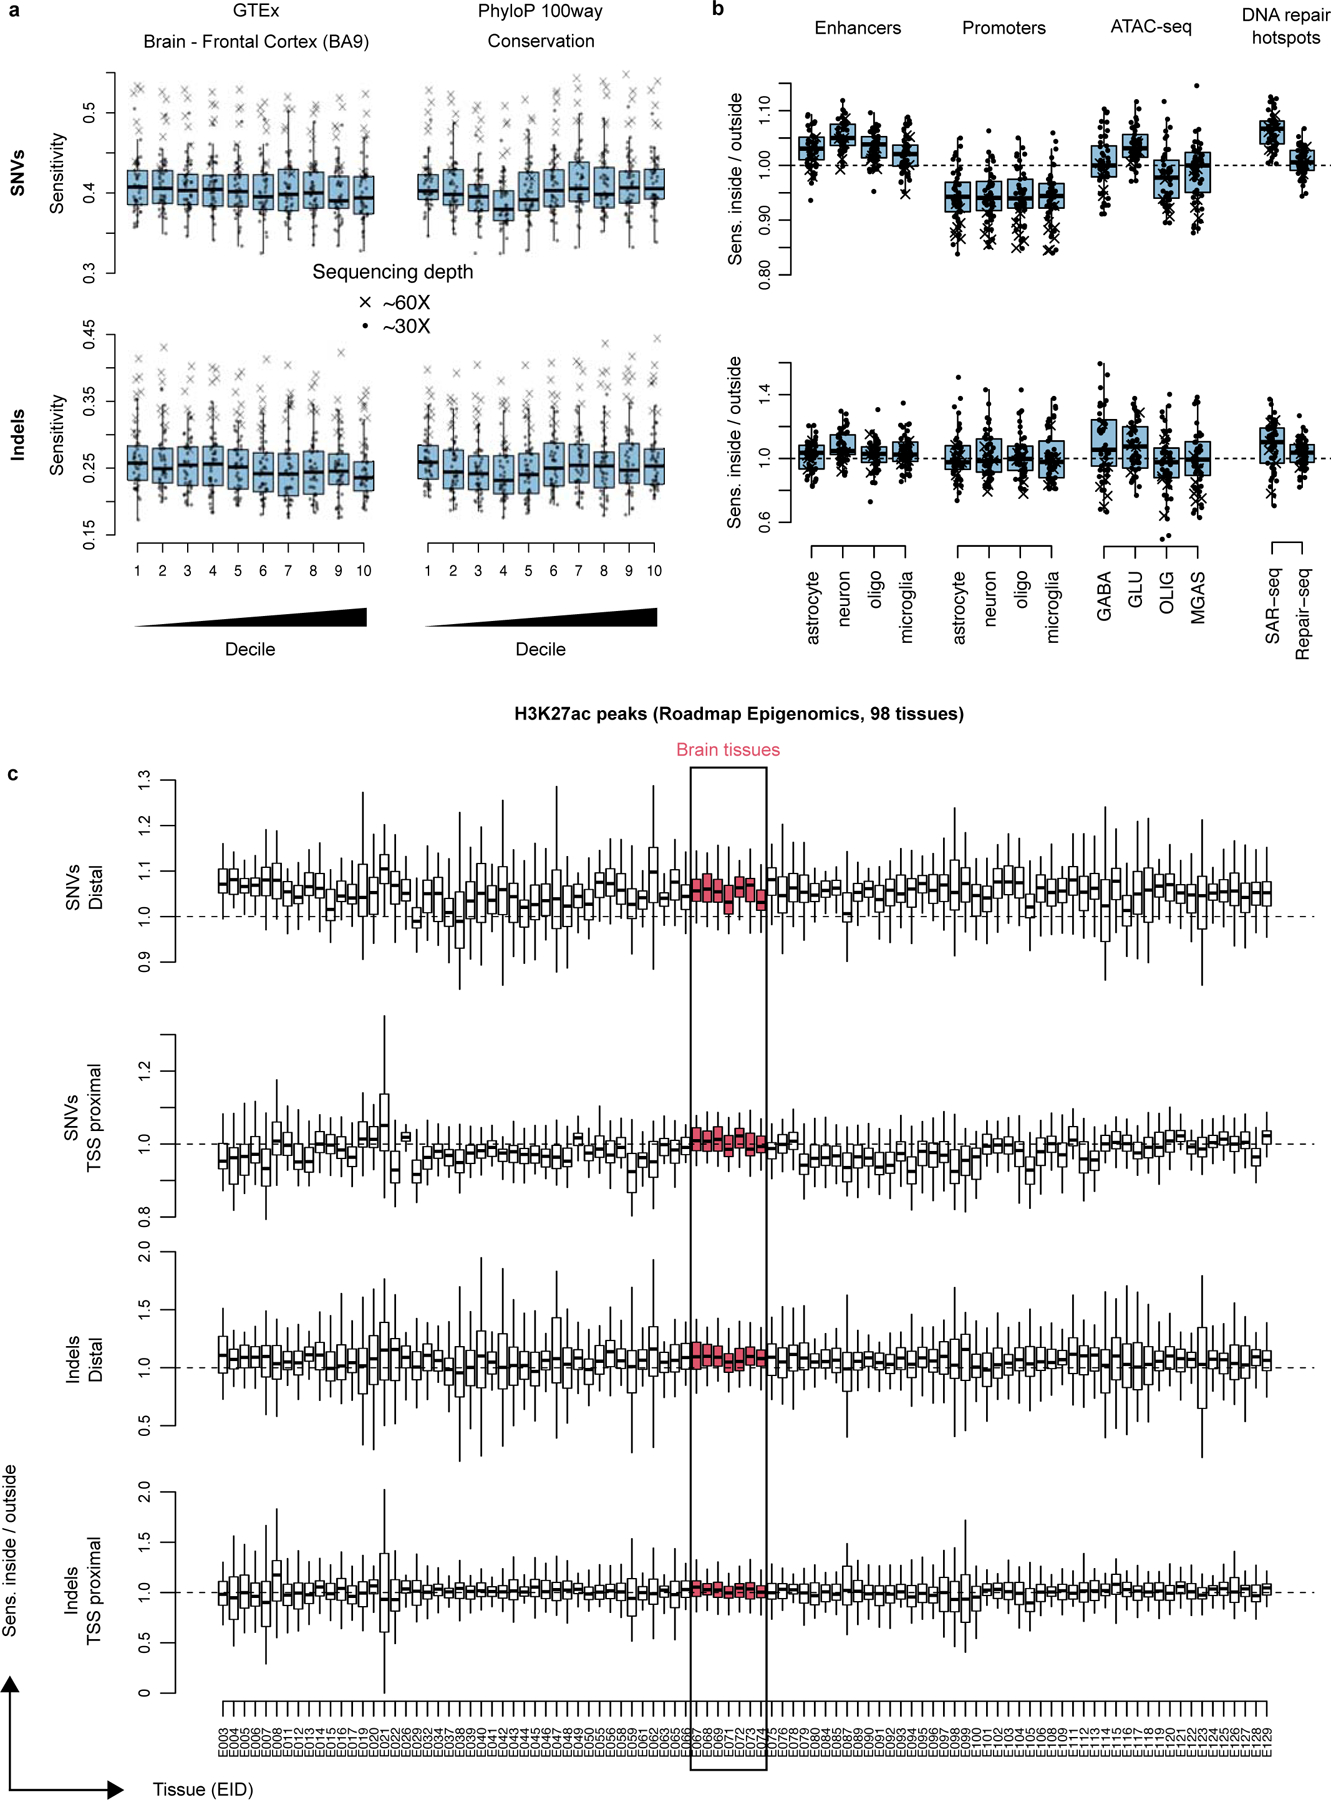
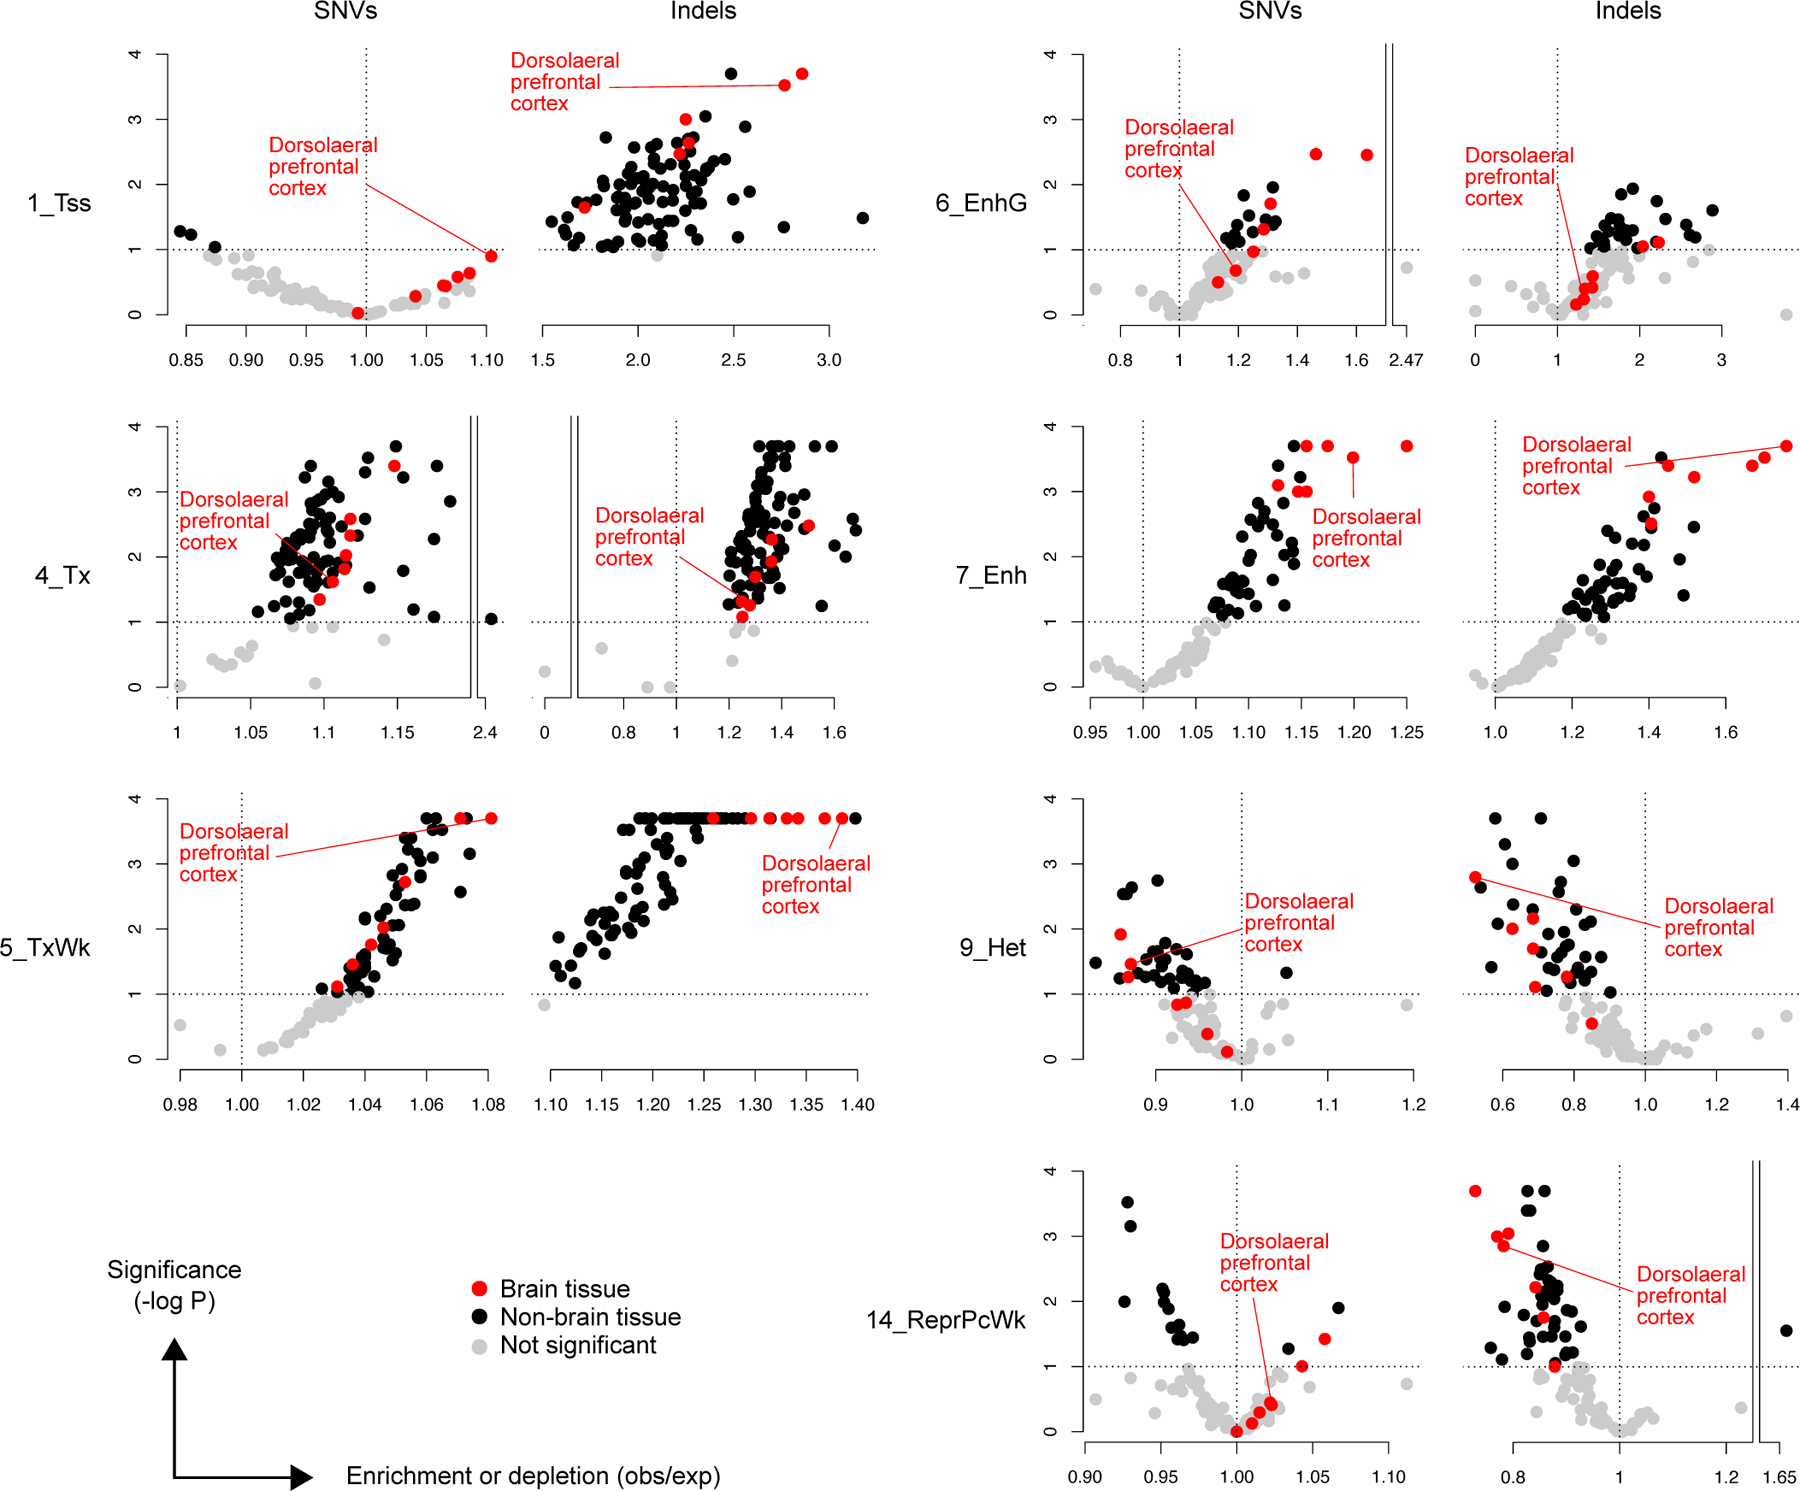
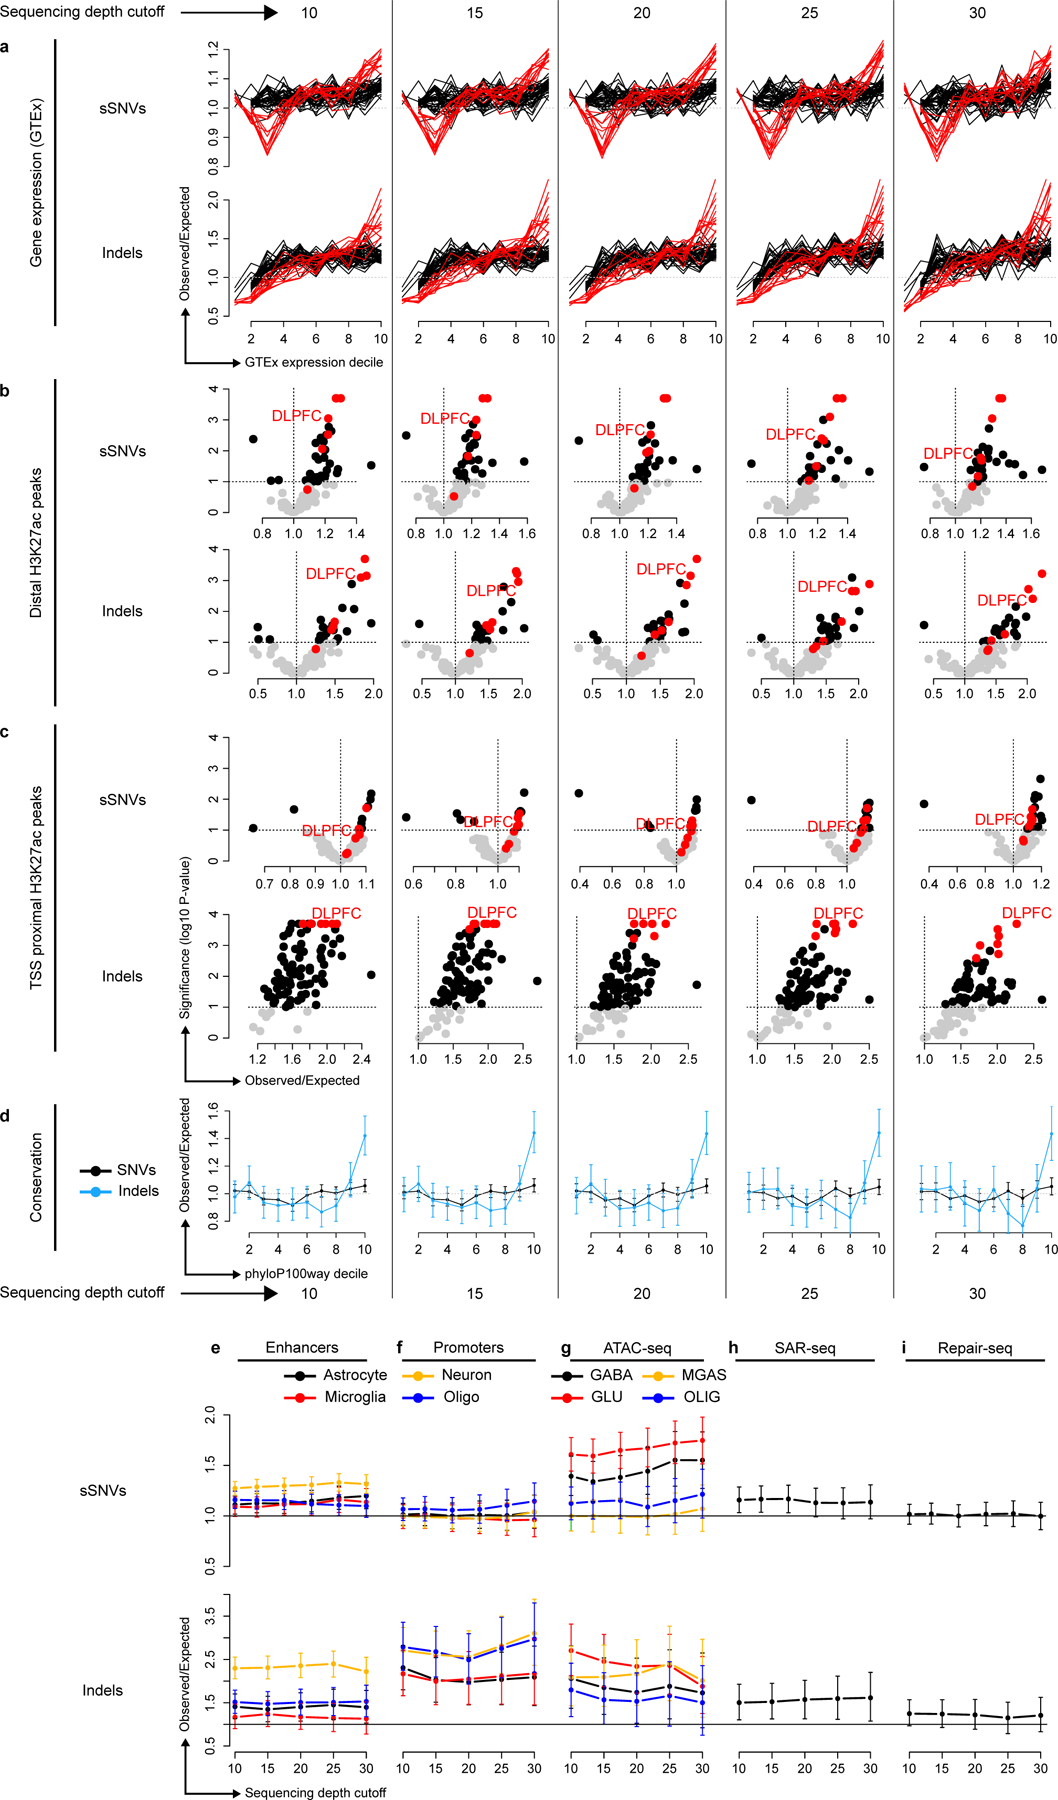
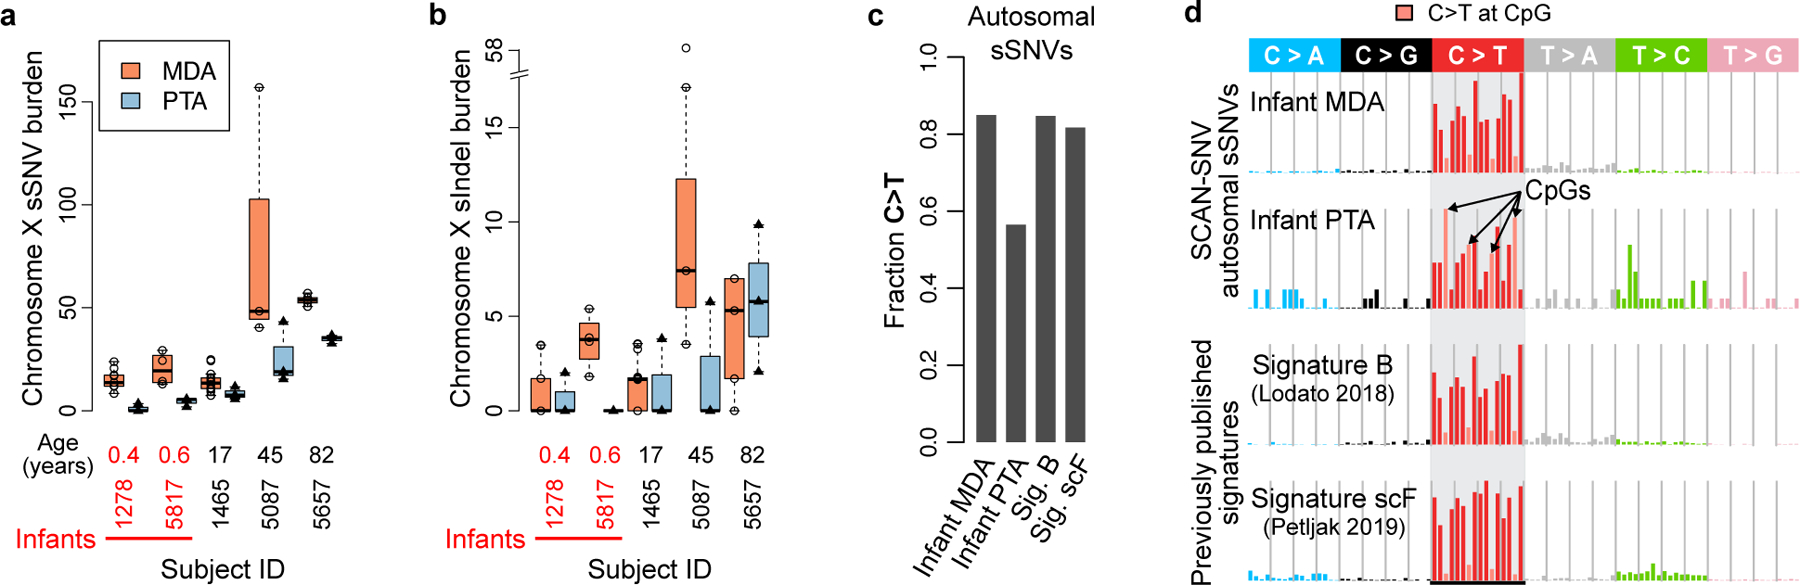
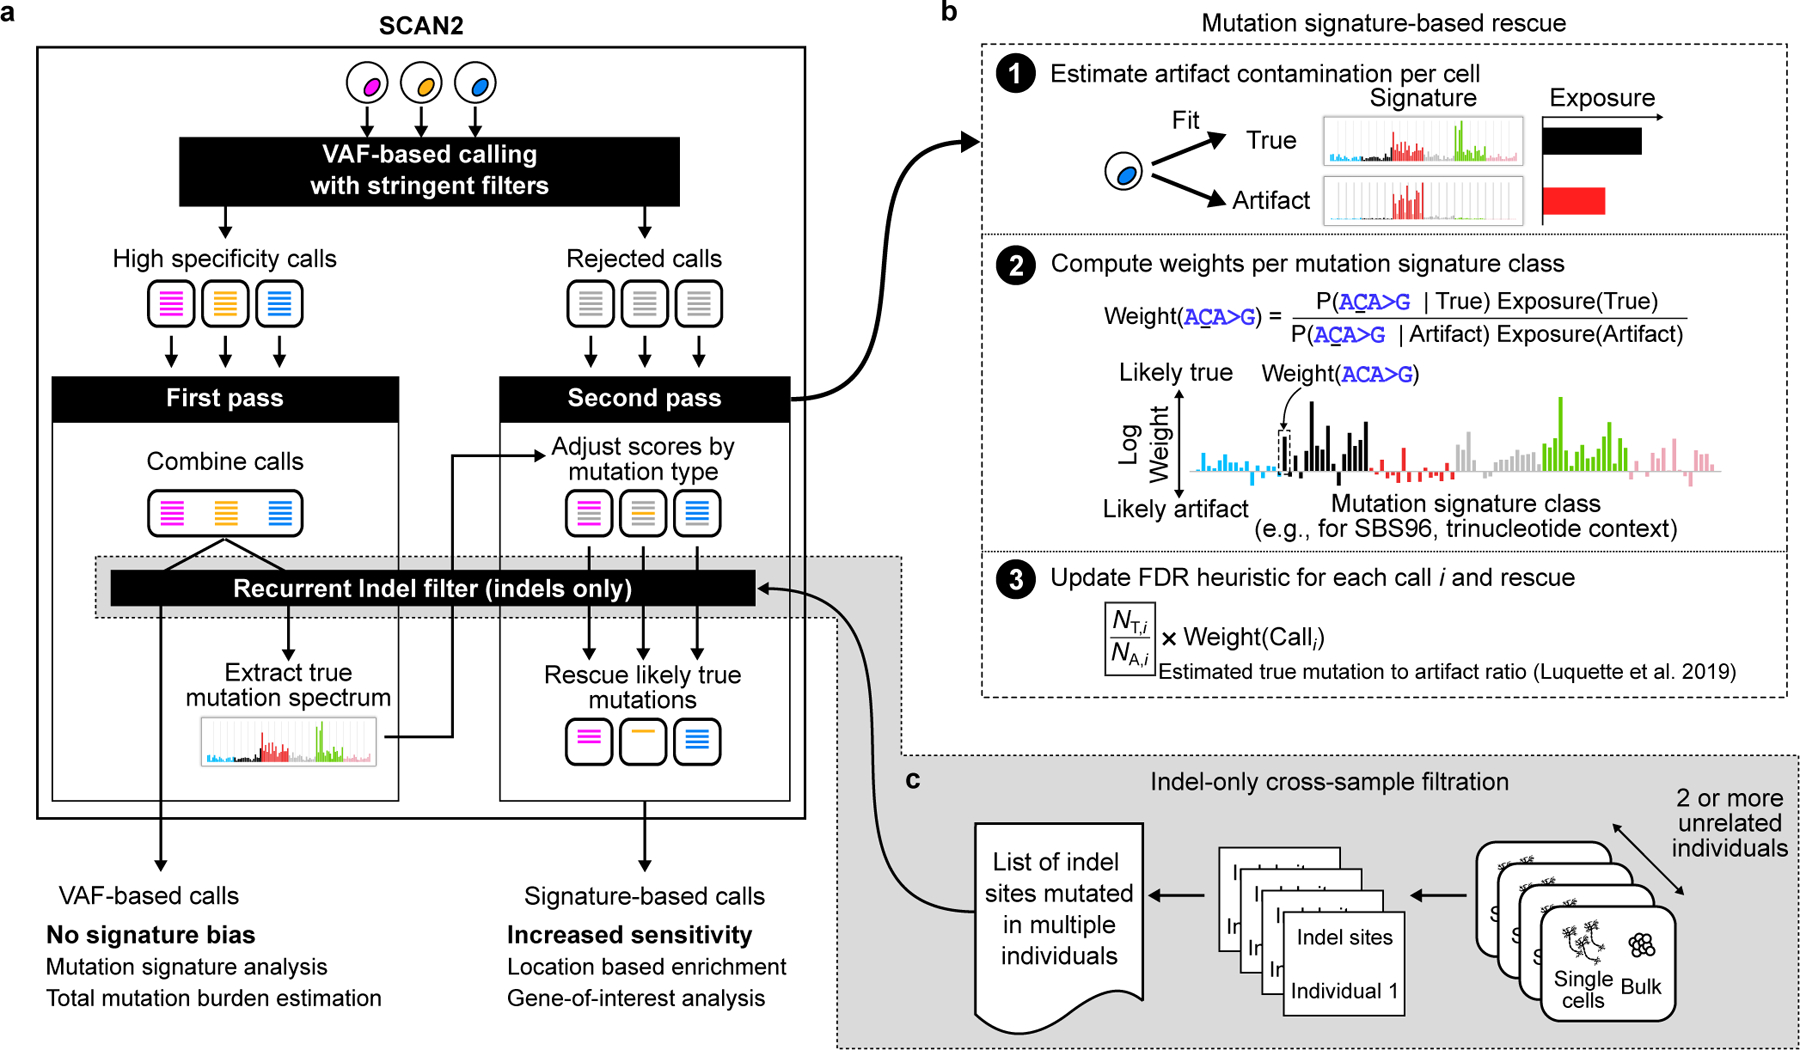
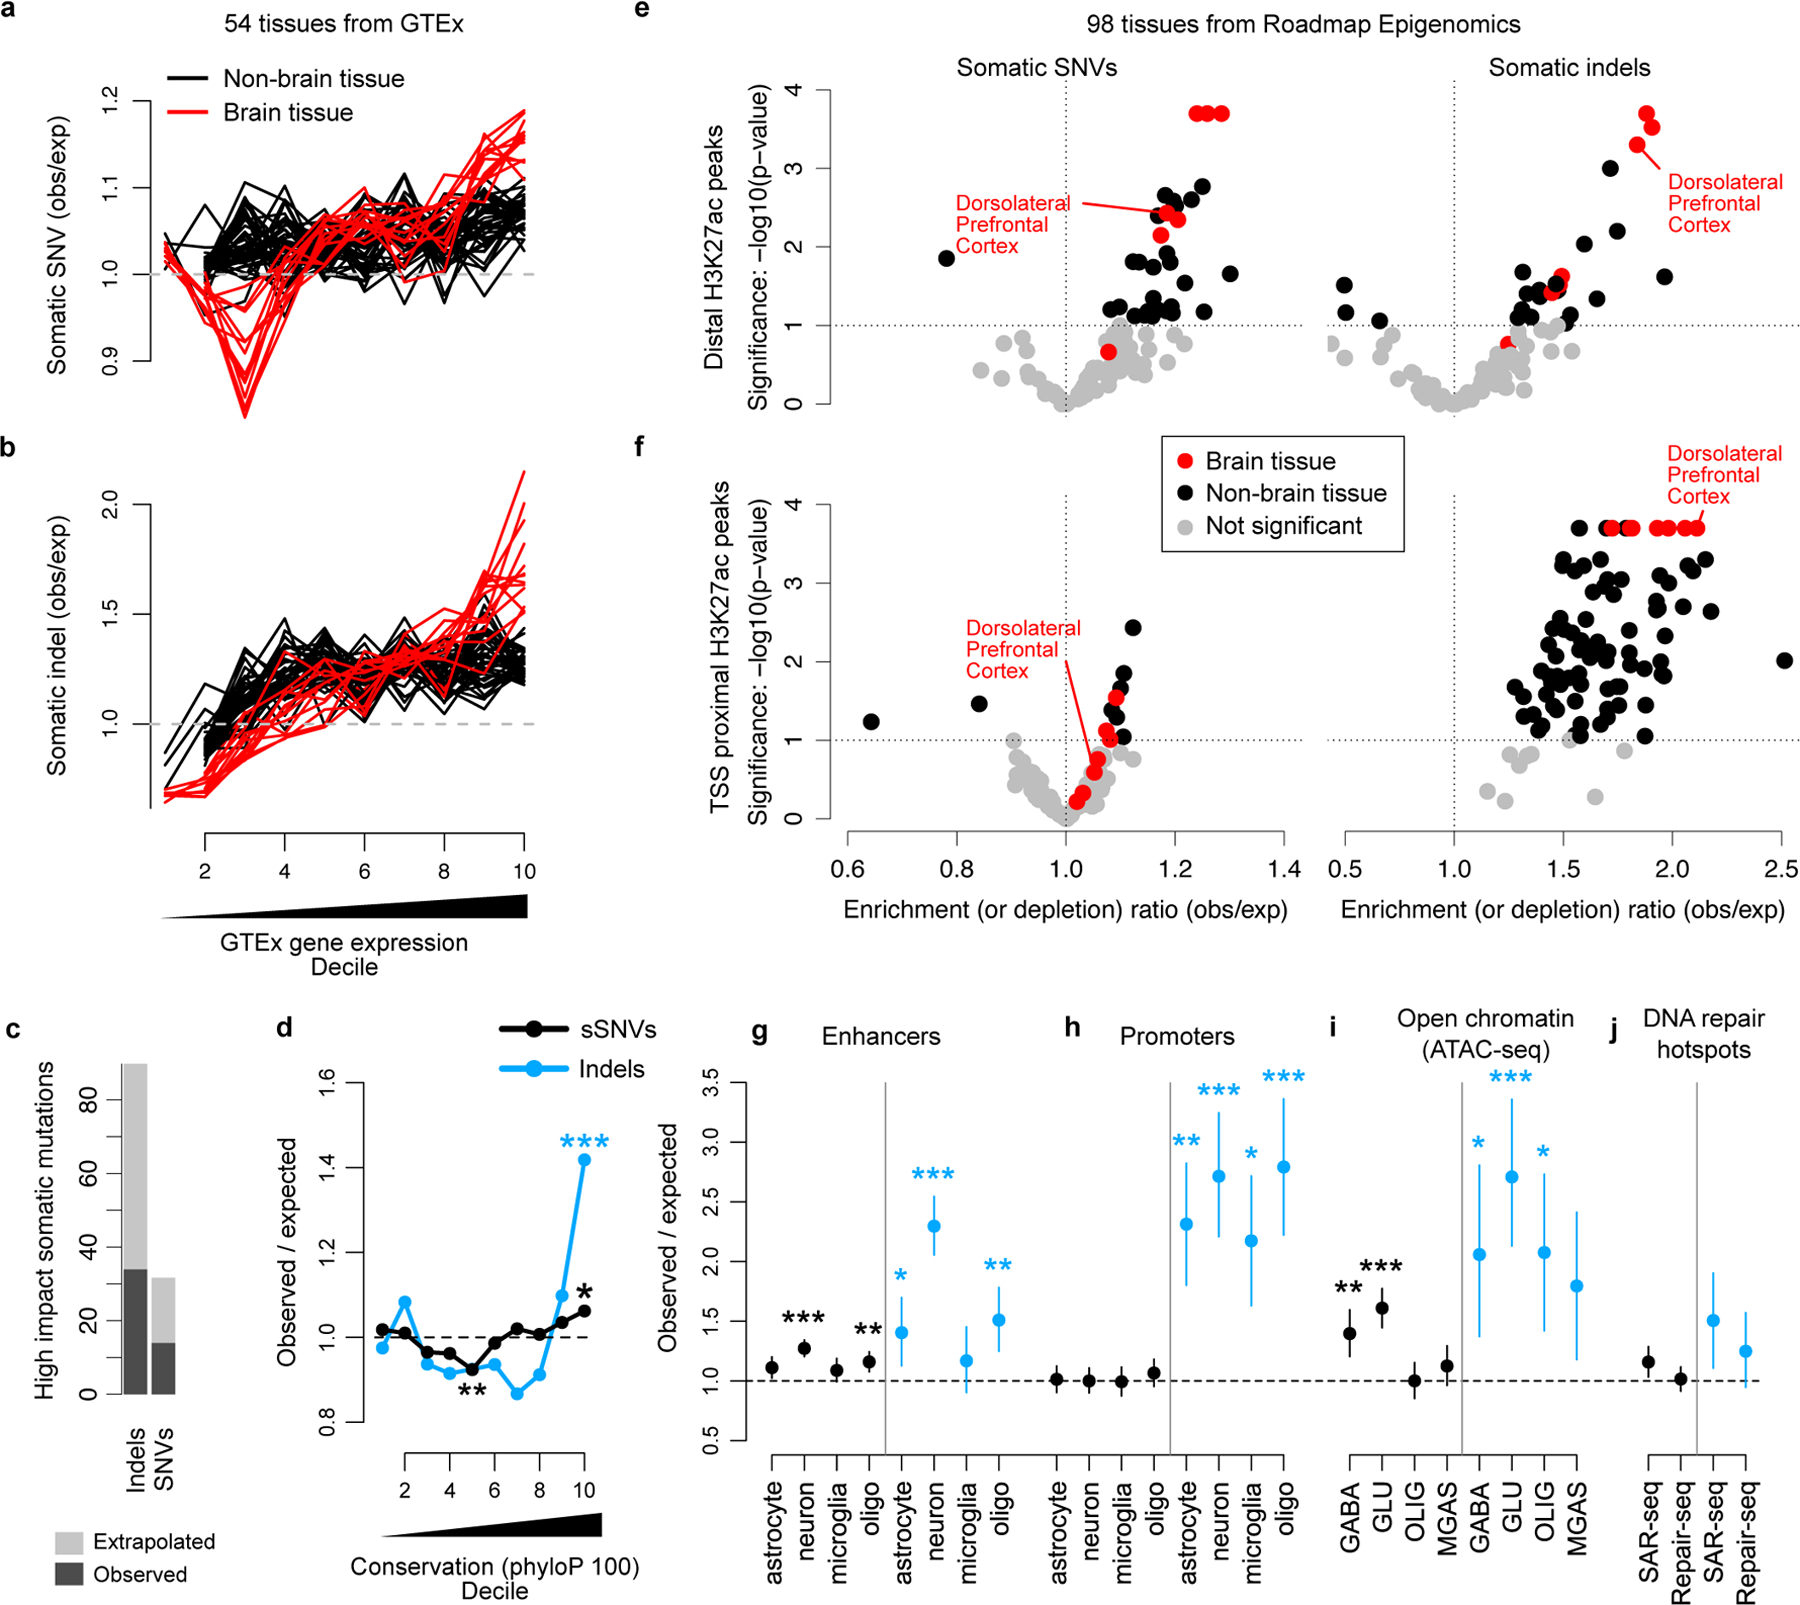
Accurate somatic mutation detection from single-cell DNA sequencing is challenging due to amplification-related artifacts. To reduce this artifact burden, an improved amplification technique, primary template-directed amplification (PTA), was recently introduced. We analyzed whole-genome sequencing data from 52 PTA-amplified single neurons using SCAN2, a new genotyper we developed to leverage mutation signatures and allele balance in identifying somatic single-nucleotide variants (SNVs) and small insertions and deletions (indels) in PTA data. Our analysis confirms an increase in nonclonal somatic mutation in single neurons with age, but revises the estimated rate of this accumulation to 16 SNVs per year. We also identify artifacts in other amplification methods. Most importantly, we show that somatic indels increase by at least three per year per neuron and are enriched in functional regions of the genome such as enhancers and promoters. Our data suggest that indels in gene-regulatory elements have a considerable effect on genome integrity in human neurons.


Conflict of interest statement

Competing interests. The authors declare the following competing interests: C. G. is Director and cofounder and J. W. is CEO and cofounder of Bioskryb, Inc., the manufacturer of PTA kits used in this study. C.A.W. is a consultant for Maze Therapeutics (cash, equity), Third Rock Ventures (cash), and Flagship Pioneering (cash), none of which have any relevance to this study. The remaining authors declare no competing interests.

Figures

Extended Data Fig. 1
Extended Data Fig. 1. Allele balance is not generally correlated between PTA amplifications.
a. Genome-wide allele balance (binned in 100 kb windows) for 3 typical PTA cells from the same individual. b. Allele balance for cells in (a) plotted against each other. c-d. Allele balance averaged across the cohort of 52 PTA cells (c) or 75 MDA cells (d); i.e., each point represents the average allele balance for a single 100 kb window. A small number of regions show consistent allelic imbalance across many amplifications (arrows). e. Correlation of allele balance profiles between all pairs of PTA cells. Correlation is generally low; cells from the same individual show slightly higher correlations; and a single individual (4638) shows the strongest correlation.
Extended Data Fig. 2
Extended Data Fig. 2. SCAN2 performance on simulated sSNVs.
sSNVs were simulated using the synthetic diploid (SD) X chromosome approach (Methods). Sensitivity is the fraction of known spike-ins recovered and false positives (FPs) are defined as calls that are neither known spike-ins nor somatic mutations endogenous to the haploid X chromosomes used to create each SD. Each point in a-d represents a single SD simulation with 10–250 spike-ins. a-b. Comparison of SCAN2 and SCAN-SNV sensitivity (a; lines are R loess() fits) and false discovery rates (b; lines are linear regression fits to FDR ~ 1/mutations per Mb). c-d. Comparison to other single cell SNV genotypers. c. Sensitivity vs. false positives per megabase of analyzed sequence. d. False discovery rate vs. the number of spike-ins per megabase. Lines are parameterized by mean sensitivity S and false positive rate per megabase F measured across all points: FDR = F / (F + xS). SCcaller standard uses a calling threshold of α = 0.05 while stringent calling uses α = 0.01. e-f. Performance of SCAN2 mutation signature-based rescue as a function of the number of sSNVs available for learning the true mutation signature. Sensitivity (e) and false discovery rate (f) are shown relative to the sensitivity or false discovery rate of the same SD simulation using the maximum sSNV catalog of 4,666 sSNVs. ε=0.0001 was added to all quantities to avoid division by zero. Solid lines are fitted by R’s loess() function. g. Effect of mutation signature of spike-ins on SCAN2 sensitivity. Each point is the average sensitivity of 9 SD simulations with 1000 spike-ins from a single COSMIC SBS signature. Mutation signatures are characterized by their similarity to the PTA SNV artifact signature. Solid line: linear regression on all points except PTAerr. SBS30 (h) is the most similar COSMIC signature to the PTA SNV artifact signature (i).
Extended Data Fig. 3
Extended Data Fig. 3. Mutation spectra of SCAN2 and LiRA calls on kindred mouse ESC cells.
a-b. SBS96 signatures of somatic SNVs called in 4 single cells from the untreated clone. C>A mutations (blue peaks) are characteristic of COSMIC SBS18 and the mutation signature of SNVs acquired during clonal expansion. These peaks persist in the clonally unsupported SNVs (b), suggesting that the method for classifying true positives is overly conservative. c. Signatures for SNVs called in the 4 single cells taken from an aristolochic acid (AAI)-treated clone.
Extended Data Fig. 4
Extended Data Fig. 4. SCAN2 performance on simulated somatic indels.
a-c. SCAN2 and other callers were applied to simulated indels using the synthetic diploid (SD) X chromosome spike-in approach (Methods). SDs received 10, 25 or 50 indel spike-ins each, which correspond, respectively, to genome-wide rates of approximately 170 (intermediate), 430 (high) and 850 (very high) somatic indels. Performance was measured by the average number of indels called per SD (a), the fraction of false positives per indel call set (b) and the fraction of spike-ins recovered (c). Tested methods were SCAN2 (with and without signature-based rescue), GATK HaplotypeCaller, GATK HaplotypeCaller with filtration by SCAN2’s cross-sample recurrent artifact filter and an adaptation of SCAN-SNV’s somatic SNV discovery approach to indels. Boxplot whiskers, the furthest outlier <=1.5 times the interquartile range from the box; box, 25th and 75th percentiles; centre bar, median; n=9 SDs per boxplot. d. Distribution of indel lengths among all simulated indels (black) and VAF-based SCAN2 indel calls (red). e. Spike-in indel sensitivity by length for VAF-based SCAN2 calls. f. Sensitivity for VAF-based SCAN2 indel calling stratified by the 83-dimensional indel classification scheme used by COSMIC indel signatures (ID83). Dotted outlines: sensitivity before applying cross-subject filtration. g. ID83-stratified indel sensitivity for SCAN2 calls with signature-based rescue.
Extended Data Fig. 5
Extended Data Fig. 5. Comparison of SCAN2 and LiRA sSNV calls on human neurons.
Single human neurons were previously analyzed by LiRA, a specific but lower sensitivity approach for calling somatic SNVs. a-b. SCAN2 and LiRA extrapolations for the total (not called) sSNV burden per diploid Gb of human sequence from MDA- (a) and PTA-amplified (b) single neurons. Solid lines: y=x. c. Linear regression estimates for the number of sSNVs accumulated per neuron per year from several sources and analyses. Horizontal bars represent 95% C.I.s produced by confint applied to an lmer fit by the lme4 R package; centre points from fixef applied to the same fits. (1) LiRA rates taken from ref. , which used a larger set of n=91 MDA-amplified PFC neurons; (2) LiRA rates taken from ref. using n=73 of the 75 MDA-amplified PFC neurons from subjects analyzed in this study (the two excluded neurons are 5087pfc-Rp3C5, an extreme outlier, and 4638-MDA-14); (3) rerun of LiRA on n=74 MDA-amplified neurons in (2) using the same input provided to SCAN2; (4) SCAN2 on n=74 MDA-amplified neurons; (5) LiRA on n=34 PTA-amplified neurons from donors also analyzed in ref. (N.B. LiRA’s higher rate estimate in (c) occurs despite lower burden estimations in (b) due to differences in model intercepts: SCAN2 intercept=95.83, LiRA intercept=17.63); (6) SCAN2 on all n=52 PTA-amplified neurons generated here. d. LiRA classification of SCAN2 calls where reads linked to nearby germline heterozygous SNPs are available (black: likely true sSNVs, red: possible false positives). PASS is the highest quality LiRA class. UNCERTAIN and LOW_POWER indicate lack of linking reads to make a confident call, but no evidence of artifactual status is detected. All other classes (red) are interpreted as false positives. Percentages show the fraction of all false positive classes among SCAN2 calls. e-f. Raw mutation spectra for SCAN2 calls without (e) and with mutation signature-based calling (f) SCAN2 calls stratified by LiRA classification. The similarities between PASS and the two lower quality UNCERTAIN_CALL and LOW_POWER classes suggest that the majority of UNCERTAIN_CALL and LOW_POWER SCAN2 calls are true mutations. Confident false positives (FILTERED_FPs) possess a C>T dominated signature with lack of C>Ts at CpGs.
Extended Data Fig. 6
Extended Data Fig. 6. Somatic indels mutation spectra in human neurons and other cells.
a. Spectrum of 1541 indels from PTA neurons from this study, same as Figure 4e. b-e. Somatic indel spectra from other studies: clonally expanded single skeletal muscle stem cells (b), clonally expanded single kidney (excluding hypermutated kidney cells, designated KT2 in the original study), epidermis and fat cells (c) and clonally expanded bronchial epithelial cells from children and never-smokers (d). e. COSMIC signatures with clock-like or age-associated annotations. f. Non-aging COSMIC signatures with >5% contribution to single neurons. g. Per-neuron COSMIC signature fits, corrected for ID83 sensitivity (Methods). Correlation (ρ) between age and exposure and P-value of two-sided t-test for correlation=0 (p) are shown for each COSMIC signature. P-values were not adjusted for multiple comparisons. Colors correspond to subject IDs as shown in Figure 4. Note that y-axes are not the same scale.
Extended Data Fig. 7
Extended Data Fig. 7. PTA sensitivity over genomic regions for SNVs and indels.
a. Absolute sensitivity for spatial measurements that divide the genome into roughly equally sized deciles (median GTEx expression for a single tissue type, brain BA9 prefrontal cortex, and phyloP 100way conservation). b-c. Relative sensitivities: sensitivity inside of the tested region divided by sensitivity of the complemented region. Enhancers and promoters from Nott et al. 2019, ATAC-seq from Hauberg et al. 2020, DNA repair hotspots from Wu et al. 2021 and Reid et al. 2021, H3K27ac peaks from Roadmap Epigenomics. Each point represents one PTA neuron; crosses represent the 7 PTA neurons sequenced to 60x, circles represent 30x depth samples. Boxplot whiskers, the furthest outlier <=1.5 times the interquartile range from the box; box, 25th and 75th percentiles; centre bar, median.
Extended Data Fig. 8
Extended Data Fig. 8. ChromHMM states and neuronal mutations.
Enrichment analysis of ChromHMM states from 127 tissues from the Roadmap Epigenomics Project. Active regions include 1_Tss, 4_Tx, 5_TxWk, 6_EnhG and 7_Enh; inactive states include 9_Het and 14_ReprPCWk. Red points, brain tissue regardless of significance level; black points, non-brain tissue; grey points, enrichment not significant at the P < 0.1 level. No correction for multiple hypothesis testing was applied.
Extended Data Fig. 9
Extended Data Fig. 9. Patterns of mutation enrichment persist at increasing sequencing depth thresholds.
Analyses presented in Figure 5 rerun using mutations supported by at least 10, 15, 20, 25 and 30 reads; permutations used for enrichment analysis are also restricted to the subset of the genome with the corresponding sequencing depth. GABA, GABAergic neurons; GLU, glutamatergic neurons; OLIG, oligodendrocytes; MGAS, microglia and astrocytes. Error bars: 95% bootstrapping confidence intervals. For panels a-d, each plot presents an analysis at one depth cutoff; for panels e-i, each plot contains the full range of depth cutoffs, as indicated on the x-axis. Error bars in d-i represent bootstrap 95% C.I.s using n=10,000 bootstrap samples; centre points are the observed mutation count divided by the mean mutation count of the bootstrap samples.
Figure 1.
Figure 1.. Improved large-scale amplification characteristics of PTA compared to MDA.
a. Study design. Single neurons were collected from the prefrontal cortex (PFC) of brains of 17 individuals ranging in age from infantile to elderly. Single neurons were amplified by either PTA or MDA and then sequenced to high coverage. Created with BioRender.com. b. Representative copy number profiles for bulk (top), MDA-amplified (middle) and PTA-amplified (bottom) genomes. c. MAPD (median absolute pairwise difference) for MDA-amplified and PTA-amplified neuronal genomes from the same individuals; lower values indicate better performance. The average MAPDs of MDA (0.75) and PTA (0.21) correspond to an average fluctuation in read depth between neighboring 50 kb windows of 68% and 14%, respectively. Boxplot whiskers, the furthest outlier <=1.5 times the interquartile range from the box; box, 25th and 75th percentiles; centre bar, median. n=17 bulk samples, n=52 PTA neurons, n=75 MDA neurons. d. Allele balance for germline heterozygous SNPs measures the evenness of amplification between homologous alleles in a diploid cell. Each line corresponds to one single cell or bulk sample. Values near 0.5 indicate balanced amplification of homologous alleles; values near 0 or 1 indicate complete dropout of one allele. On average, 71% of each PTA genome was balanced (allele balance between 0.3–0.7) compared to only 39% of each MDA genome.
Figure 2.
Figure 2.. PTA identifies MDA-induced artifacts.
a-b. Sensitivity-adjusted somatic SNV (sSNV) (a) and indel (b) burdens per X chromosome for 5 male subjects with both MDA and PTA-amplified neurons. Boxplot whiskers, the furthest outlier <=1.5 times the interquartile range from the box; box, 25th and 75th percentiles; centre bar, median; n=16 PTA neurons and n=39 MDA neurons. c. Fraction of C>Ts among SCAN-SNV sSNV calls in infant neurons and two previously published signatures. d. Mutation spectra of SCAN-SNV sSNVs across 13 MDA infant neurons, 6 PTA infant neurons, the C>T rich Signature B reported in Lodato et al, 2018 and the MDA artifact Signature scF reported by Petljak et al, 2019. Light red bars denote C>Ts that occur at CpG sites. Boxplot whiskers, the furthest outlier <=1.5 times the interquartile range from the box; box, 25th and 75th percentiles; centre bar, median.
Figure 3.
Figure 3.. SCAN2 mutation signature-based calling approach for somatic SNVs and indels.
Overview of SCAN2 workflow using somatic SNV spectra for demonstration; 83-channel indel spectra are used for somatic indel analysis. a. SCAN2’s two-pass mutation signature-based calling, in which mutation signatures from high-specificity calls are used to rescue likely true mutations from the rejected call set. Mutations may be combined across cells exposed to the same mutation processes to increase the number of VAF-based calls used in extracting the true mutation signature. This may not be necessary for cells with very high mutation burden. b. Candidate somatic mutations are rescored separately for each single cell given the true mutation signature learned in panel (b). The likelihood of being generated by the true signature is computed for each mutation class (96-dimensional “SBS96” for SNVs and 83-dimensional “ID83” for indels). This likelihood acts as a prior for a previously described heuristic that estimates the number of true mutations (NT,i) and artifacts (NA,i) with characteristics similar to mutation candidate i. c. For indel calling only, recurrent artifacts are further removed by a cross-sample list of sites where indels are observed across cells from multiple unrelated individuals.
Figure 4.
Figure 4.. SCAN2 VAF-based somatic SNVs and indels in aging human neurons.
a. Genome-wide extrapolated accumulation rate of somatic SNVs in PTA- (triangles) and MDA- (circles) amplified single human neurons. Colors represent 17 individuals. b. Genome-wide extrapolated rate of somatic indel accumulation. c. Age-related increase of somatic insertions and deletions called from PTA neurons; raw counts are reported, not sensitivity-adjusted genome-wide rates. d. Distribution of somatic indel lengths from PTA neurons. e. Raw mutation spectrum of somatic indels. f. Exposures to COSMIC ID signatures calculated by least squares fitting. Exposures were corrected by normalizing indel counts by ID83 channel-specific sensitivity (Extended Data Figure 4f) before fitting. g. Association of ID4, a signature of unknown aetiology, with neuron age; P-value: two-sided t-test for correlation=0. Trend lines in a-c and g: mixed effects linear regressions to account for multiple points being derived from the same individual.
Figure 5.
Figure 5.. Enrichment of neuronal mutations in functionally active genomic regions with tissue- and cell-type specificity.
a-b. sSNV (a) and somatic indel (b) enrichment compared to local gene expression levels measured by GTEx. Each line corresponds to one GTEx tissue type; tissues from primary brain specimens are always shown in red. c. The number of high impact (classified HIGH by SnpEff; includes several severely protein altering effects such as stop gains, stop losses and frameshifts) sSNVs and somatic indels detected by SCAN2’s signature-based approach (dark grey) and extrapolation to autosomes (light grey). d. Mutation enrichment compared to local sequence conservation. e-f. Enrichment analysis of neuronal mutations in H3K27ac peaks from 98 Roadmap Epigenomics tissues. H3K27ac peaks are classified according to whether they are within 2 kb of an H3K4me3 peak in the same tissue (f, TSS proximal) or not (e, distal). Distal peaks are interpreted as intergenic enhancers. g-j. Mutation enrichment analysis of several datasets. Dorsolateral prefrontal cortex is shown since it most closely matches the neurons sequenced in this study. Cell-type specific enhancers (g) and promoters (h) from Nott et al. 2019; cell-type specific open chromatin regions (OCRs) measured by ATAC-seq from Hauberg et al. 2020 (i); DNA repair hotspots measured in induced human neurons (j) reported by Wu et al. 2021 (SAR-seq) and Reid et al. 2021 (Repair-seq). GABA, GABAergic neurons; GLU, glutamatergic neurons; OLIG, oligodendrocytes; MGAS, microglia and astrocytes. Error bars (g-j): 95% bootstrapping C.I. with n=104 bootstrap samplings; centre point: observed mutation count divided by the mean mutation count over bootstrap samplings. * - P < 0.01, ** - P < 0.001, *** P < 0.0001 by two-sided permutation test (Methods) without multiple hypothesis correction.

References

    1. Poduri A, Evrony GD, Cai X & Walsh CA Somatic Mutation, Genomic Variation, and Neurological Disease. Science 341, 43–51 (2013). - PMC - PubMed
    1. Lodato M et al. Somatic mutation in single human neurons tracks developmental and transcriptional history. Science 350, 94–98 (2015). - PMC - PubMed
    1. Martincorena I et al. High burden and pervasive positive selection of somatic mutations in normal human skin. Science 348, 880–886 (2015). - PMC - PubMed
    1. Jaiswal S et al. Clonal hematopoiesis and risk of atherosclerotic cardiovascular disease. N. Engl. J. Med 377, 111–121 (2017). - PMC - PubMed
    1. Blokzijl F, de Ligt J, Jager M et al. Tissue-specific mutation accumulation in human adult stem cells during life. Nature 538, 260–264 (2016). - PMC - PubMed

Publication types