. 2022 Sep 26;13(1):5624.
doi: 10.1038/s41467-022-33251-7.

Rapid vertical exchange at fronts in the Northern Gulf of Mexico

Affiliations

Rapid vertical exchange at fronts in the Northern Gulf of Mexico

Lixin Qu et al. Nat Commun. .

Abstract

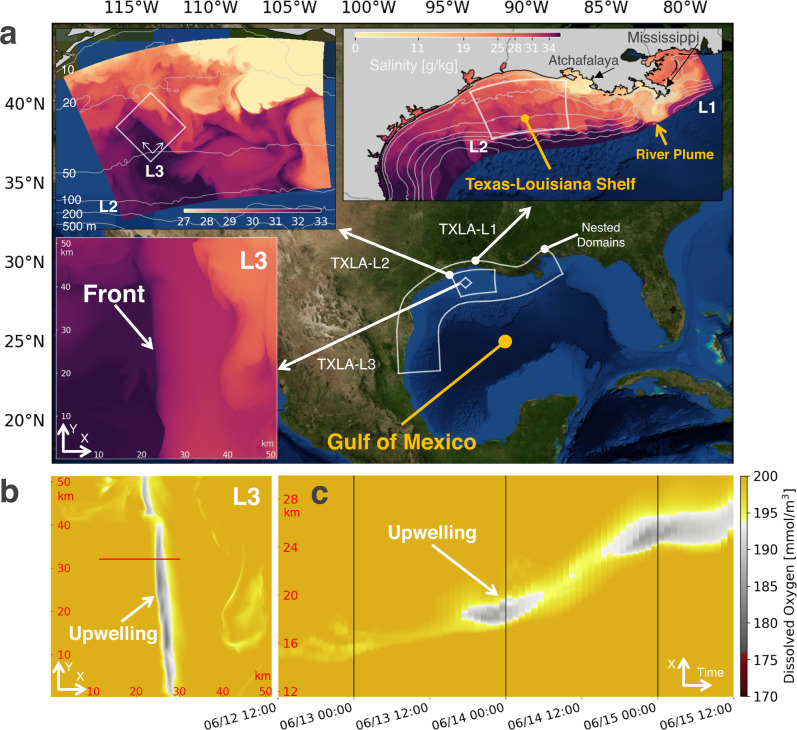
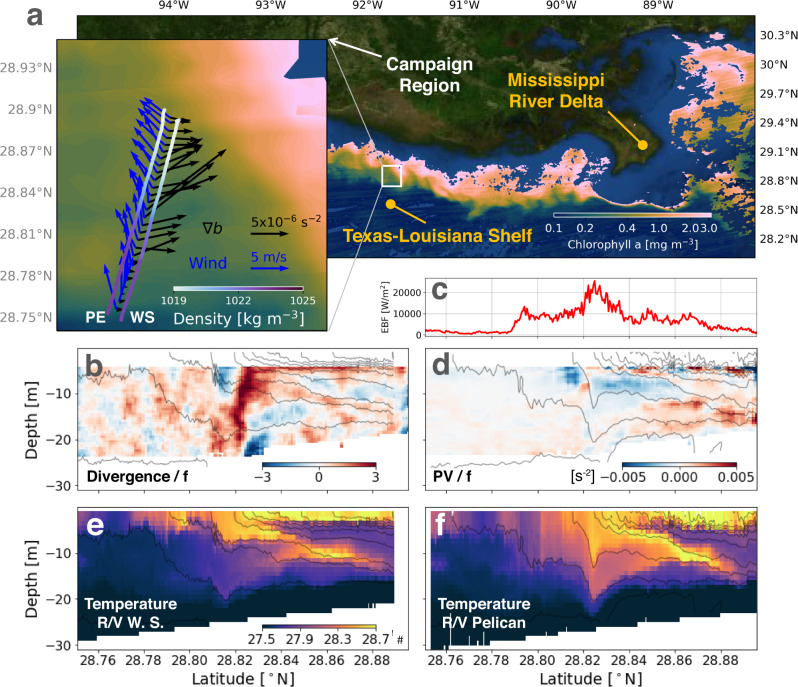
Over the Texas-Louisiana Shelf in the Northern Gulf of Mexico, the eutrophic, fresh Mississippi/Atchafalaya river plume isolates saltier waters below, supporting the formation of bottom hypoxia in summer. The plume also generates strong density fronts, features of the circulation that are known pathways for the exchange of water between the ocean surface and the deep. Using high-resolution ocean observations and numerical simulations, we demonstrate how the summer land-sea breeze generates rapid vertical exchange at the plume fronts. We show that the interaction between the land-sea breeze and the fronts leads to convergence/divergence in the surface mixed layer, which further facilitates a slantwise circulation that subducts surface water along isopycnals into the interior and upwells bottom waters to the surface. This process causes significant vertical displacements of water parcels and creates a ventilation pathway for the bottom water in the northern Gulf. The ventilation of bottom water can bypass the stratification barrier associated with the Mississippi/Atchafalaya river plume and might impact the dynamics of the region's dead zone.


Conflict of interest statement

The authors declare no competing interests.

Figures

Fig. 1
Fig. 1. Map of study site and triple-nested simulations.
a Northern Gulf of Mexico, Texas-Louisiana Shelf, and surface salinity from simulations. In summertime, the Mississippi and Atchafalaya rivers create a large river plume over the shelf with buoyant, relatively fresh water. Simulations termed TXLA (Texas-Louisiana) are triple-nested (see Methods for details). L1, L2, and L3 represent the nested layers. A front characterized by strong salinity gradients is highlighted in the L3 subpanel. Isobaths are contoured in gray in the L2 subpanel. b Horizontal slice of the dissolved oxygen at z = −4.7 m from the L3 simulation. Upwelling of water with lower oxygen is denoted. The upwelling is most prominent in L3 but less obvious in L1 and L2 due to the lower resolutions (Fig. S1 of the Supplementary Material). c Hovmöller diagram of dissolved oxygen. The diagram is made based on the oxygen field at z = −4.7 m along the section marked in b. The gray lines plotted every diurnal cycle indicate the diurnal upwelling of the water with lower oxygen. The wind forcing over the period is shown in Fig. 3d, showing a notable diurnal land-sea breeze. The snapshots in a, b are taken on June 15, 2010 00:00 UTC.
Fig. 2
Fig. 2. SUNRISE Campaign 2021.
a Satellite imagery of surface chlorophyll a over the Texas-Louisiana shelf from NASA Suomi NPP VIIRS Ocean Color. The imagery is composited using the data collected between 18:00 and 20:00 UTC June 24, 2021. The subpanel is a zoomed in view of a region of the SUNRISE field campaign, where repeated (every 4 h), parallel transects were made by R/Vs Pelican (PE) and Walton Smith (WS) to sample the fronts in the Mississippi/Atchafalaya river plume. The two transects (roughly 17 km long each) were made between 03:00 and 07:00 UTC June 24, 2021 to sample the front which is characterized in the satellite imagery by strong gradients of chlorophyll. The front near-inertially oscillated by entering the sampling region and retreating. The ship tracks are colored by the near-surface density measured by VMPs. The blue arrows are the winds measured on R/V Walton Smith, and the black arrows are the horizontal buoyancy gradients (∇hb) calculated using the near-surface density data from both R/Vs. b Section of normalized divergence (δ/f), where δ = ∂u/∂x + ∂v/∂y. c Profile of Ekman buoyancy flux EBF=[τ×k^/(ρ0f)]hb, where τ is the wind stress and ∇hb is the horizontal buoyancy gradient. The EBF is expressed in units of an effective heat flux, and positive values indicate a tendency for winds to destabilize the front. d Section of the potential vorticity (PV/f). e, f Temperature sections from the VMP profiling on the R/Vs. Isopycnals are contoured every 0.5 kg/m3 in gray.
Fig. 3
Fig. 3. Diurnal convergence at fronts.
a Surface normalized relative vorticity (ζ/f), where ζ = ∂v/∂x − ∂u/∂y. b Surface density. Isobaths are contoured in gray. The white box denotes the L3 domain. c Surface normalized divergence (δ/f) binned as a function of ζ/f and time. The statistics are calculated over the L2 domain. d Time series of land-sea breeze. The wind speed is spatially averaged over the L2 domain. e Zoomed in view of surface density over the L3 domain. f Surface normalized divergence (δ/f) along the orange line marked in (e). Convergence (divergence) is shaded in blue (red). g 3D structure of isopycnal surfaces near the convergence zone (marked by the blue box in e). h Across-front section of δ/f along the orange line marked in (e). Isopycnal surfaces and contours are made every 0.2 kg/m3 in g and h. All the panels except c and d correspond to June 14, 2010 00:00 UTC. Panels ad (eh) are plotted from the L2 (L3) solution.
Fig. 4
Fig. 4. Slantwise vertical exchange at fronts.
ad Across-front sections of dissolved oxygen, temperature, potential vorticity, and viscosity. The sections are made at June 14, 2010 00:00 UTC along the orange line marked in Fig. 3e. e Time series of float depth colored by dissolved oxygen concentration. The floats are initially released at the positions marked by the upper gray dots in a and backward tracked in time. The Lagrangian rate of change of oxygen near the surface is estimated as dO/dt ≈ 0.82 mg L−1 day−1. This rate of oxygenation is obtained by averaging the rates of all the floats over the last 4 h. f Same as e but for the lower floats marked in a, b. g Distance above bottom of floats 30 h after release. The floats are initially and uniformly released in a 10 m-thick bottom boundary layer within the red dashed box at June 13, 2010 06:00 UTC. h Float depth 12 h after release. The floats are initially and uniformly released at the surface within the green dashed box at June 13, 2010 12:00 UTC. Isopycnals are contoured every 0.2 kg/m3 in gray in ad and g, h. All the calculations are from the L3 solution.
Fig. 5
Fig. 5. Inertially modulated frontogenesis and convergence.
a Time series of the surface wind stress over the L3 domain. b Surface PV (color), wind stress (vectors) and density (contours) that are averaged between 06/12 12:00 and 06/15 12:00 UTC. c Hovmöller diagrams of surface normalized divergence (δ/f), horizontal buoyancy gradient squared (1/2∣∇hb2), and PV flux (Jz), which are calculated along the orange line in b (the same line in Fig. 3e). d Comparison between the wind stress τyw and minus the geostrophic stress τyg at the front over one inertial period. τyg and τyw are averaged over a front-following section (the first 2 km of the magenta section in e). e Across-front ageostrophic velocity uag. The velocity is averaged over the top 5 m. The snapshot is taken at 06/14 18:00 UTC (marked by the arrow in f). Two front-following sections are plotted for each side of the front. f Velocity evolution over one inertial period on the dense side of the front. The left subpanel shows one inertial cycle of uml that is obtained from the slab mixed layer model. The right subpanel is a Hovmöller diagram of uag along the blue line in e. g Velocity evolution over one inertial period on the light side of the front. The left subpanel is a Hovmöller diagram of uag along the magenta line in e. The right subpanel is a similar diagram but for uag that is obtained from the reduced physics model. The gray dashed box between f and g marks the phase when the across-front velocities run opposite on either side of the front and lead to convergence. The gray box in g marks the phase with divergence on the light side of the front. The distance in the Hovmöller diagrams in f and g are front-relative with negative (positive) values on the dense (light) side. The gray contours in b, c, e are isopycnals made every 0.2 kg/m3. All calculations are made from the L3 solution.
Fig. 6
Fig. 6. Schematic of the key processes contributing to the vertical circulation.
A diurnal land-sea breeze generates an inertially-oscillating wind-driven surface flow. The wind-driven flow interacts with an ocean front and transports dense water over light water at certain phases over an inertial cycle, destabilizing the water column and enhancing turbulence and mixing at the front. The mixing of the geostrophic flow by the turbulence creates a counterflow at the front, which runs opposite to the wind-driven flow and leads to strong convergence (abbreviated as CON). Similarly, the flow reversal also leads to divergence (abbreviated as DIV) at the light side of the front. The near-surface convergence and divergence at the front set up a slantwise circulation along isopycnals in the interior, inducing downwelling of surface water and upwelling of bottom water. This vertical exchange can insert lower dissolved oxygen waters into the surface mixed layer, where oxygenation can be stimulated by mixing processes (schematized by the yellow curly arrows).

References

    1. Rabalais NN, Turner RE, Wiseman Jr WJ. Gulf of mexico hypoxia, aka “the dead zone”. Ann. Rev. Ecol. Syst. 2002;33:235–263. doi: 10.1146/annurev.ecolsys.33.010802.150513. - DOI
    1. Bianchi TS, et al. The science of hypoxia in the northern gulf of mexico: a review. Sci Total Environ. 2010;408:1471–1484. doi: 10.1016/j.scitotenv.2009.11.047. - DOI - PubMed
    1. DiMarco SF, Howard MK, Reid RO. Seasonal variation of wind-driven diurnal current cycling on the texas-louisiana continental shelf. Geophys. Res. Lett. 2000;27:1017–1020. doi: 10.1029/1999GL010491. - DOI
    1. DiMarco SF, Reid RO. Characterization of the principal tidal current constituents on the texas-louisiana shelf. J. Geophys. Res. Oceans. 1998;103:3093–3109. doi: 10.1029/97JC03289. - DOI
    1. Kobashi D, Hetland R. Reproducibility and variability of submesoscale frontal eddies on a broad, low-energy shelf of freshwater influence. Ocean Dynamics. 2020;70:1377–1395. doi: 10.1007/s10236-020-01401-4. - DOI

Publication types