. 2023 Jul;43(5):2053-2069.
doi: 10.1007/s10571-022-01285-6. Epub 2022 Sep 26.

Characterization of IMG Microglial Cell Line as a Valuable In Vitro Tool for NLRP3 Inflammasome Studies

Affiliations

Characterization of IMG Microglial Cell Line as a Valuable In Vitro Tool for NLRP3 Inflammasome Studies

Janeli Viil et al. Cell Mol Neurobiol. 2023 Jul.

Abstract

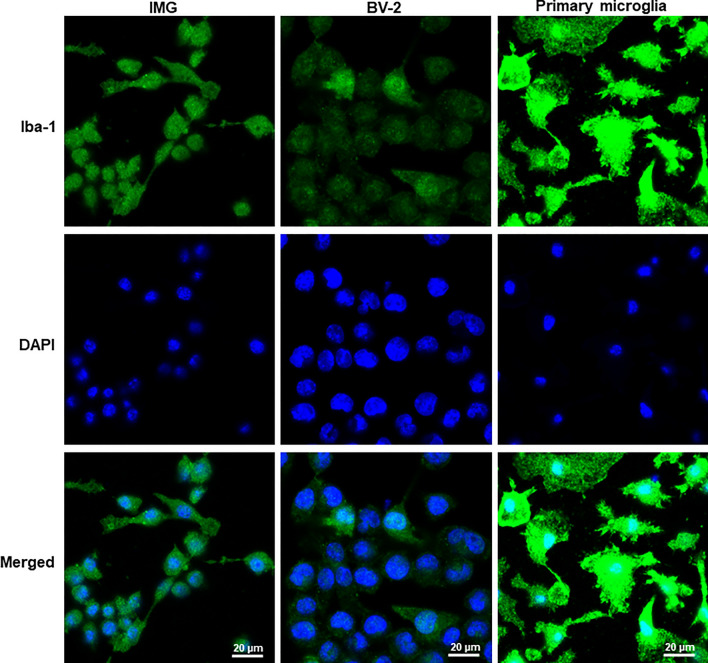
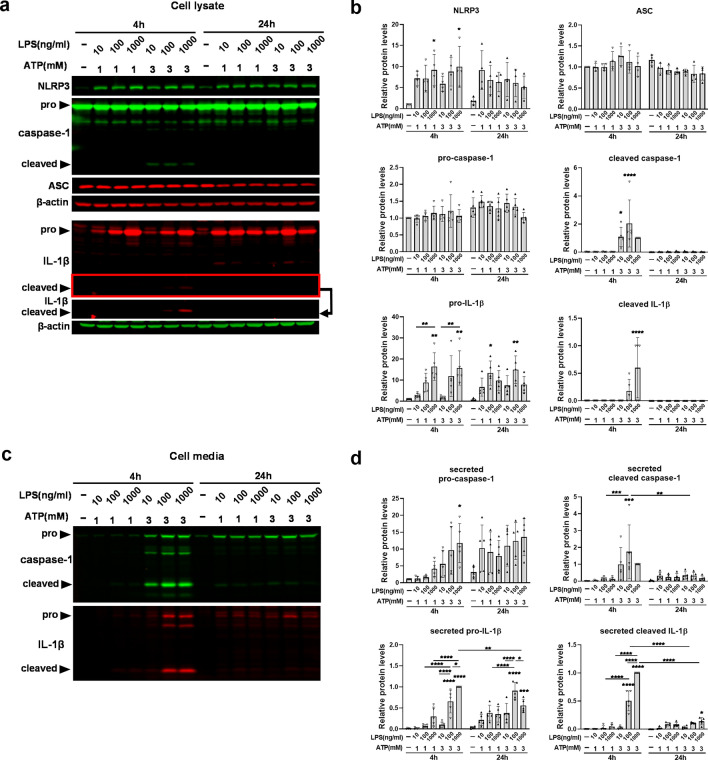
Microglial cells constantly surveil the cerebral microenvironment and become activated following injury and disease to mediate inflammatory responses. The nucleotide-binding oligomerization domain-, leucine-rich repeat-, and pyrin domain-containing 3 (NLRP3) inflammasome, which is abundantly expressed in microglial cells, plays a key role in these responses as well as in the development of many neurological disorders. Microglial cell lines are a valuable tool to study the causes and possible treatments for neurological diseases which are linked to inflammation. Here, we investigated whether the mouse microglial cell line IMG is suitable to study NLRP3 inflammasome by incubating cells with different concentrations of NLRP3 inflammasome priming and activating agents lipopolysaccharide (LPS) and ATP, respectively, and applying short (4 h) or long (24 h) LPS incubation times. After short LPS incubation, the mRNA levels of most pro-inflammatory and NLRP3 inflammasome-associated genes were more upregulated than after long incubation. Moreover, the combination of higher LPS and ATP concentrations with short incubation time resulted in greater levels of active forms of caspase-1 and interleukin-1 beta (IL-1β) proteins than low LPS and ATP concentrations or long incubation time. We also demonstrated that treatment with NLRP3 inflammasome inhibitor glibenclamide suppressed NLRP3 inflammasome activation in IMG cells, as illustrated by the downregulation of gasdermin D N-fragment and mature caspase-1 and IL-1β protein levels. In addition, we conducted similar experiments with primary microglial cells and BV-2 cell line to determine the similarities and differences in their responses. Overall, our results indicate that IMG cell line could be a valuable tool for NLRP3 inflammasome studies. In IMG cells, 4-h incubation with lipopolysaccharide (LPS) induces a stronger upregulation of NLRP3 inflammasome-associated pro-inflammatory genes compared to 24-h incubation. NLRP3 inflammasome is robustly activated only after the addition of 3 mM of ATP following short LPS incubation time.

Keywords: IMG cells; Microglia; NLRP3 inflammasome; Neuroinflammation.


Conflict of interest statement

The authors have no relevant financial or non-financial interests to disclose.

Figures

Fig. 1
Fig. 1
Morphology changes in IMG, BV-2, and primary mouse microglial cells following LPS incubation. IMG cells display a body shape similar to BV-2 cells and primary microglia in control conditions (top row). Cell morphology after 4 h (middle row) and after 24 h (bottom row) of incubation with LPS (100 ng/ml). The experiment was repeated three times. Scale bars 50 µm
Fig. 2
Fig. 2
Iba-1 expression in IMG, BV-2, and primary mouse microglial cells. IMG, BV-2, and primary microglia cells were incubated with anti-Iba-1 antibody (green) and DAPI (blue), and the expression of Iba-1 protein was visualized with a confocal microscope. All images were acquired with similar microscopic settings. By visual observation, it could be seen that all cells demonstrated positive staining for Iba-1 with primary microglia having an intense signal followed by fainter intesity in IMG and BV-2 cells. The experiment was repeated three times. Scale bars 20 µm
Fig. 3
Fig. 3
The effect of LPS concentration and LPS incubation time on the expression of genes associated with inflammation and NLRP3 inflammasome in microglia. a IMG cells were incubated with three different concentrations of LPS: 10 ng/ml, 100 ng/ml, or 1000 ng/ml. Gene expression profiles of Nlrp3, Caspase-1, Il-1β, Tnf, Il-18, and Asc were evaluated after 4 h and 24 h of LPS incubation (6 biological replicates from 3 independent experiments). b Primary microglial cells were incubated with 100 ng/ml of LPS for 4 h and 24 h, and the gene expression profiles of microglia were evaluated (7–8 biological replicates from 3–4 independent experiments). Results were normalized with Gapdh, and relative mRNA levels are expressed as fold change relative to control. Data with error bars represent mean ± SD, and each triangle or rhomb represents a single sample. Asterisks above bars indicate a significant change compared to the control of the same time point, while asterisks above lines indicate significant differences in gene expression between different conditions. *P < 0.05, **P < 0.01, ***P < 0.001, ****P < 0.0001 as determined by two-way ANOVA (a) or one-way ANOVA (b) with Tukey’s post-test
Fig. 4
Fig. 4
The effect of LPS and ATP concentration and LPS incubation time on the expression of proteins associated with inflammation and NLRP3 inflammasome in IMG cells. IMG cells were incubated with 10 ng/ml, 100 ng/ml, or 1000 ng/ml of LPS for 4 h and 24 h and then with 1 mM or 3 mM of ATP for 30 min. Expression of NLRP3, caspase-1, IL-1β, ASC, and β-actin proteins in cell lysates (a, b) and secreted caspase-1 and IL-1β in cell media (c, d) were determined with western blot (5 biological replicates from 3 independent experiments). The band signal of cleaved IL-1β inside the red frame was intensified and cropped for better visualization. Cell lysate results were normalized with β-actin. Relative protein levels are expressed as fold change relative to control or relative to LPS 1000 ng/ml + 3 mM ATP group (when proteins were undetectable in the control group). Data with error bars represent mean ± SD, and each triangle represents a single sample. Asterisks above bars indicate a significant change compared to the control of the same time point, while asterisks above lines indicate significant differences in protein levels between different conditions. *P < 0.05, **P < 0.01, ***P < 0.001, ****P < 0.0001 as determined by two-way ANOVA with Tukey’s post-test
Fig. 5
Fig. 5
The effect of ATP concentration and LPS incubation time on the expression of proteins associated with inflammation and NLRP3 inflammasome in primary microglial cells. Cells were incubated with 100 ng/ml of LPS for 4 h and 24 h, and then with 1 mM or 3 mM of ATP for 30 min. Expression of NLRP3, caspase-1, IL-1β, ASC, and β-actin proteins in cell lysates (a, b) and secreted caspase-1 and IL-1β in cell media (c, d) were determined with western blot (3 replicates from 3 independent experiments). Cell lysate results were normalized with β-actin. Relative protein levels are expressed as fold change relative to control or relative to LPS 100 ng/ml + 3 mM ATP group (when proteins were undetectable in the control group). Data with error bars represent mean ± SD, and each triangle represents a single sample. Asterisks above bars indicate a significant change compared to the control of the same time point, while asterisks above lines indicate significant differences in protein levels between different conditions. *P < 0.05, **P < 0.01, ****P < 0.0001 as determined by two-way ANOVA with Tukey’s post-test
Fig. 6
Fig. 6
ASC speck formation in IMG, BV-2, and primary mouse microglial cells. Cells were treated with 100 ng/ml of LPS for 4 h and thereafter with 3 mM of ATP for 30 min. Control cells were left untreated. Cells were probed with anti-ASC (red) and anti-NLRP3 (green) antibodies and DAPI (blue). Representative immunofluorescence images demonstrating ASC speck formation in LPS- and ATP-treated IMG cells (second row) and primary cells (last row). White arrows point to ASC specks. No ASC expression nor ASC specks were detected in the BV-2 cell line (third and fourth row, respectively). NLRP3 expression was detected in all cell lines. The experiment was repeated two times. Scale bars 40 µm. Inset scale bars 10 µm
Fig. 7
Fig. 7
The effect of glibenclamide on the abundance of inflammasome-associated proteins in IMG and BV-2 cells. IMG and BV-2 cells were treated with 100 ng/ml of LPS for 3 h 45 min, then glibenclamide (100 µM) was added to the cells, and 15 min later 3 mM of ATP was added to the cells for another 30 min. Cells with no LPS and ATP treatment were used as control. Gasdermin D (GSDMD), caspase-1, IL-1β, and β-actin protein levels were determined in IMG cell lysates (a, b), and caspase-1 and IL-1β protein levels were determined in IMG cell media (c, d) by western blot (6 biological replicates from 3 independent experiments). a, c Representative western blot images of IMG cell lysates and media, respectively. e, f Representative western blot images of GSDMD, caspase-1, IL-1β, and β-actin proteins in BV-2 cell lysates and IL-1β protein in BV-2 cell media, respectively (3 biological replicates from 2 individual experiments). Cell lysate results were normalized with β-actin. Relative protein levels are expressed as fold change relative to control or relative to control + glibenclamide (when proteins were undetectable in the control group). Data with error bars represent mean ± SD and each triangle represents a single sample. **P < 0.01, ****P < 0.0001 as determined by one-way ANOVA with Tukey’s post-test

Similar articles

Cited by

References

    1. Anand PK, Malireddi RK, Kanneganti TD (2011) Role of the nlrp3 inflammasome in microbial infection. Front Microbiol 2:12. 10.3389/fmicb.2011.00012 - PMC - PubMed
    1. Bauernfeind FG, Horvath G, Stutz A, Alnemri ES, MacDonald K, Speert D, Fernandes-Alnemri T, Wu J, Monks BG, Fitzgerald KA, Hornung V, Latz E (2009) Cutting edge: NF-kappaB activating pattern recognition and cytokine receptors license NLRP3 inflammasome activation by regulating NLRP3 expression. J Immunol 183(2):787–791. 10.4049/jimmunol.0901363 - PMC - PubMed
    1. Blasi E, Barluzzi R, Bocchini V, Mazzolla R, Bistoni F (1990) Immortalization of murine microglial cells by a v-raf/v-myc carrying retrovirus. J Neuroimmunol 27(2–3):229–237. 10.1016/0165-5728(90)90073-v - PubMed
    1. Bortolotti P, Faure E, Kipnis E (2018) Inflammasomes in tissue damages and immune disorders after trauma. Front Immunol 9:1900. 10.3389/fimmu.2018.01900 - PMC - PubMed
    1. Bradford MM (1976) A rapid and sensitive method for the quantitation of microgram quantities of protein utilizing the principle of protein-dye binding. Anal Biochem 72:248–254. 10.1006/abio.1976.9999 - PubMed

LinkOut - more resources