

Ionic complexation improves wound healing in deep second-degree burns and reduces in-vitro ciprofloxacin cytotoxicity in fibroblasts
- PMID: 36163445
- PMCID: PMC9513095
- DOI: 10.1038/s41598-022-19969-w
Ionic complexation improves wound healing in deep second-degree burns and reduces in-vitro ciprofloxacin cytotoxicity in fibroblasts
Abstract
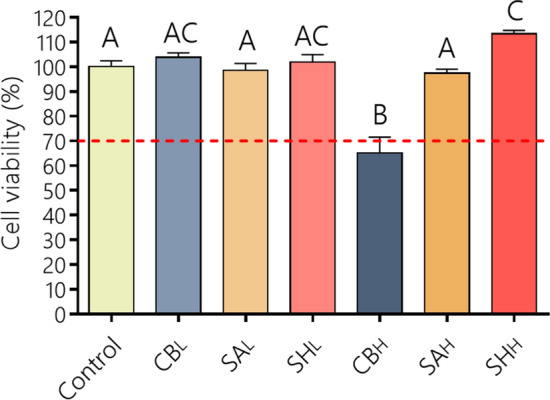
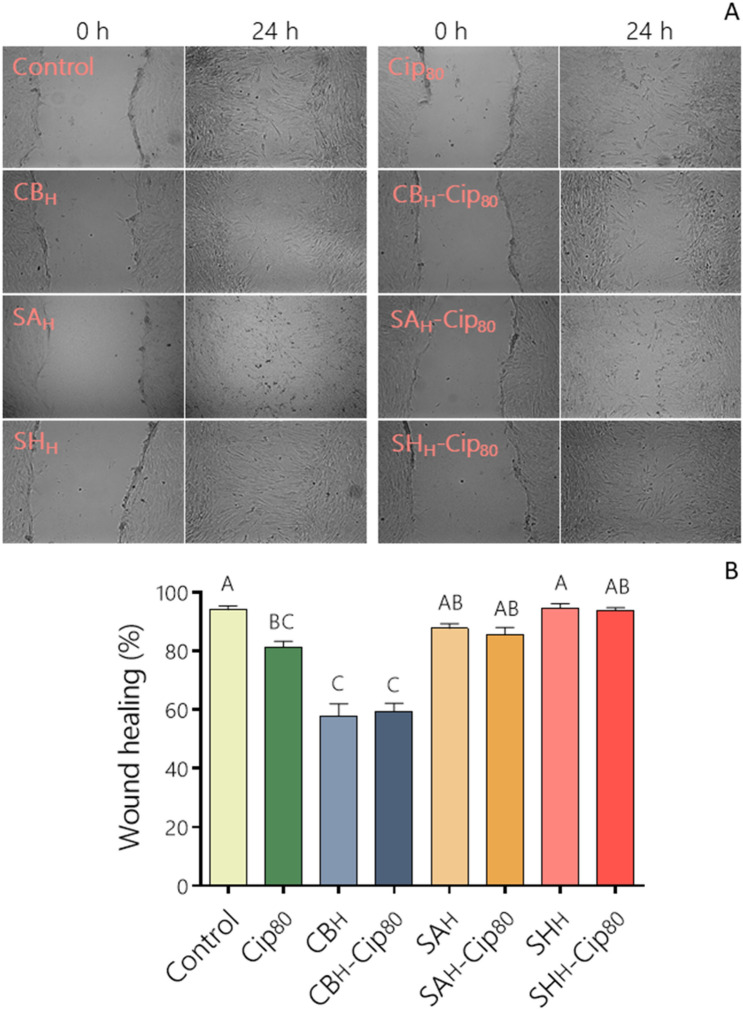
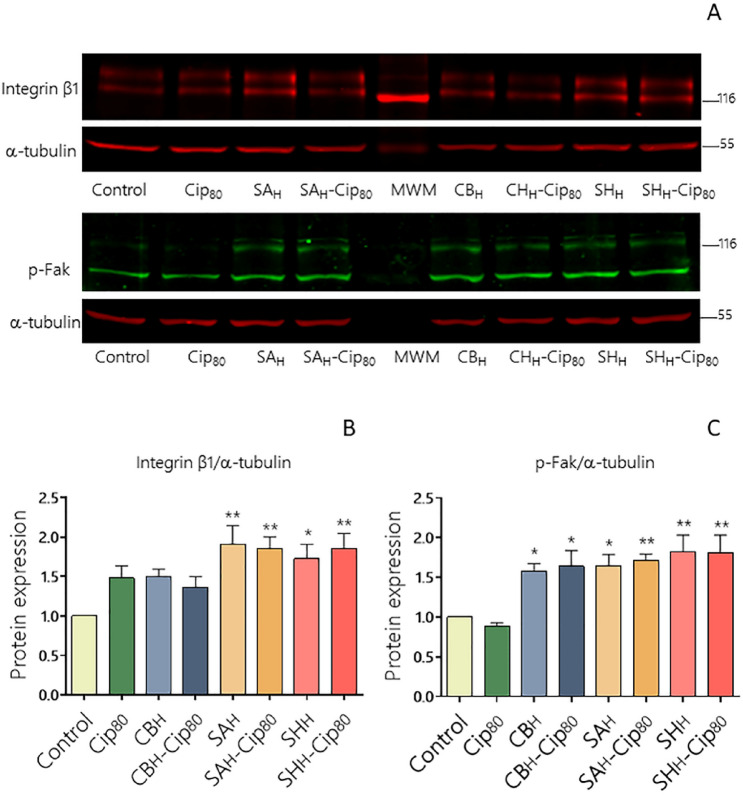
The development of new treatments capable of controlling infections and pain related to burns continues to be a challenge. Antimicrobials are necessary tools, but these can be cytotoxic for regenerating cells. In this study, antibiotic-anesthetic (AA) smart systems obtained by ionic complexation of polyelectrolytes with ciprofloxacin and lidocaine were obtained as films and hydrogels. Ionic complexation with sodium alginate and hyaluronate decreased cytotoxicity of ciprofloxacin above 70% in a primary culture of isolated fibroblasts (p < 0.05). In addition, the relative levels of the proteins involved in cell migration, integrin β1 and p-FAK, increased above 1.5 times (p < 0.05) with no significant differences in cell mobility. Evaluation of the systems in a deep second-degree burn model revealed that reepithelization rate was AA-films = AA-hydrogels > control films > no treated > reference cream (silver sulfadiazine cream). In addition, appendage conservation and complete dermis organization were achieved in AA-films and AA-hydrogels. Encouragingly, both the films and the hydrogels showed a significantly superior performance compared to the reference treatment. This work highlights the great potential of this smart system as an attractive dressing for burns, which surpasses currently available treatments.
© 2022. The Author(s).
Conflict of interest statement
The authors declare no competing interests.
Figures

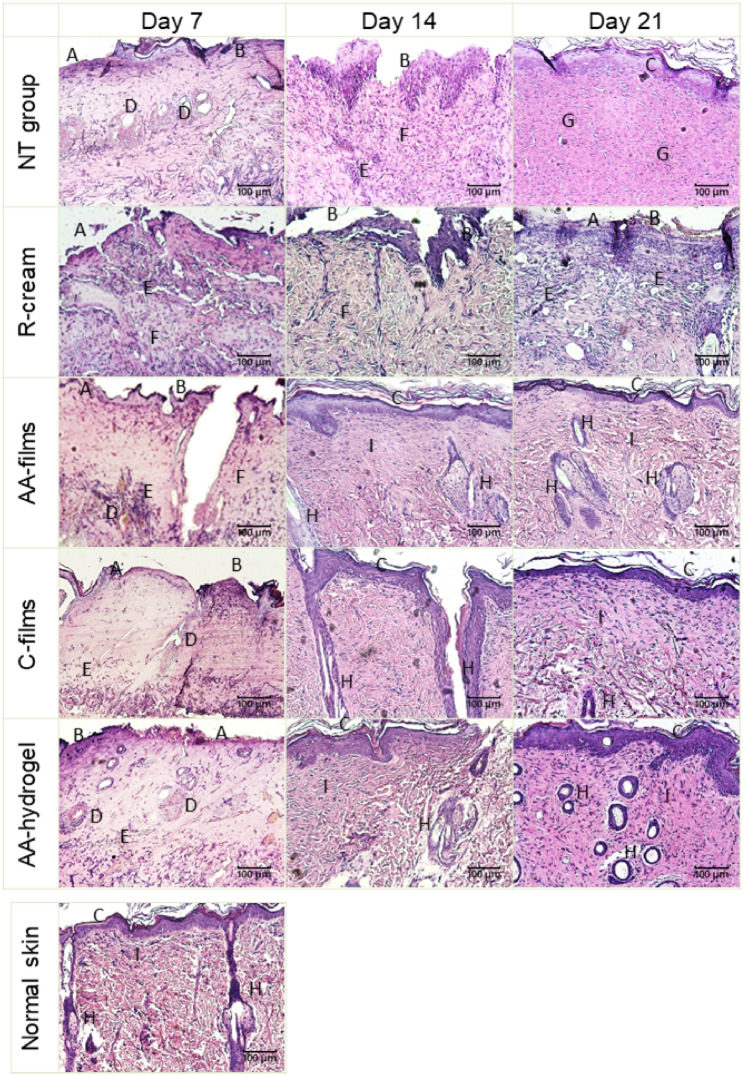

 1) Absent, (
 2) discontinuous and (
 3) continuous.
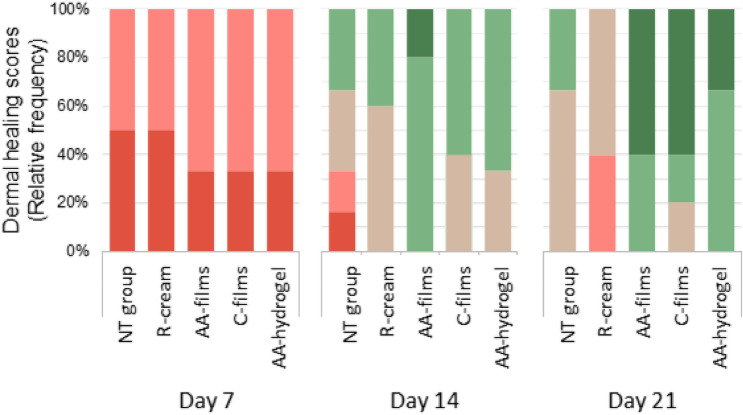
 1) Complete dermal disorganization, (
 2) Reticular recovery, papillary disorganization, (
 3) Recovery of reticular and papillary dermis, (
 4) Normal reticular dermis with papillary recovery, (
 5) Completely normal dermis.
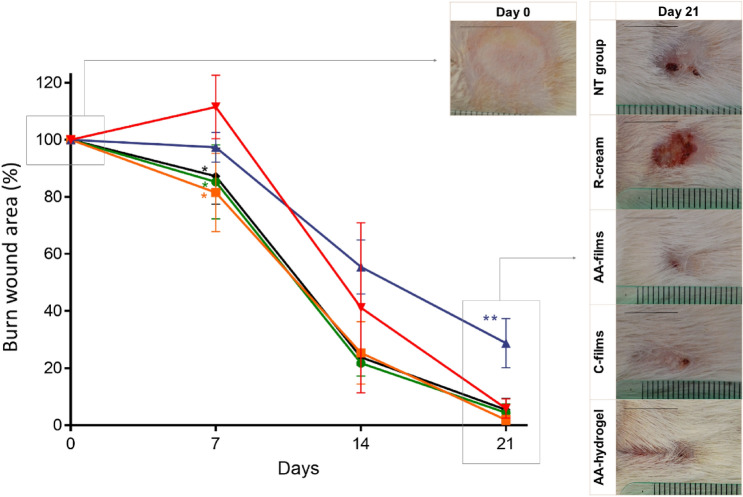
 AA-films,
  C-films,
  AA-hydrogel,
  R-cream and
  NT group. Scale bars are 1 cm; *significantly smaller than the NT group; **significantly larger than the NT group. Plotted with GraphPad Prism® v.7.00 software (GraphPad, USA,
References
-
- World Health Organization (WHO). Burns. Fact sheet N°365 (2018). http://www.who.int/en/news-room/fact-sheets/detail/burns. (Accessed 27th June 2018).
-
- Wounds International . Best Practice Guidelines: Effective Skin and Wound Management of Non-complex Burns. Wounds International; 2014.
Publication types
MeSH terms
Substances
LinkOut - more resources
Full Text Sources
Medical
Miscellaneous
