. 2023 Apr;49(2):619-632.
doi: 10.1007/s00068-022-02081-z. Epub 2022 Sep 26.

A method for detailed determination of hospital surge capacity: a prerequisite for optimal preparedness for mass-casualty incidents

Affiliations

A method for detailed determination of hospital surge capacity: a prerequisite for optimal preparedness for mass-casualty incidents

Kristina Lennquist Montán et al. Eur J Trauma Emerg Surg. 2023 Apr.

Erratum in

Abstract

Background: Defined goals for hospitals' ability to handle mass-casualty incidents (MCI) are a prerequisite for optimal planning as well as training, and also as base for quality assurance and improvement. This requires methods to test individual hospitals in sufficient detail to numerically determine surge capacity for different components of the hospitals. Few such methods have so far been available. The aim of the present study was with the use of a simulation model well proven and validated for training to determine capacity-limiting factors in a number of hospitals, identify how these factors were related to each other and also possible measures for improvement of capacity.

Materials and methods: As simulation tool was used the MACSIM® system, since many years used for training in the international MRMI courses and also successfully used in a pilot study of surge capacity in a major hospital. This study included 6 tests in three different hospitals, in some before and after re-organisation, and in some both during office- and non-office hours.

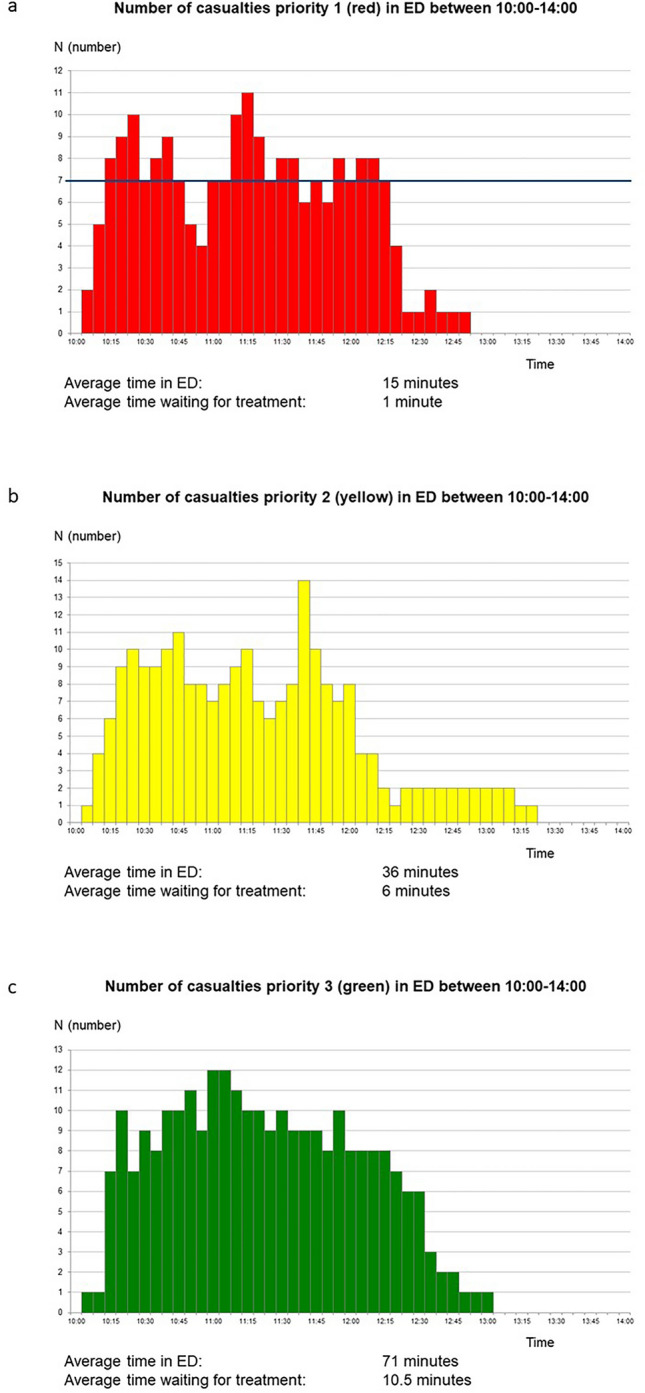
Results: The primary capacity-limiting factor in all hospitals was the capacity to handle severely injured patients (major trauma) in the emergency department. The load of such patients followed in all the tests a characteristic pattern with "peaks" corresponding to ambulances return after re-loading. Already the first peak exceeded the hospitals capacity for major trauma, and the following peaks caused waiting times for such patients leading to preventable mortality according to the patient-data provided by the system. This emphasises the need of an immediate and efficient coordination of the distribution of casualties between hospitals. The load on surgery came in all tests later, permitting either clearing of occupied theatres (office hours) or mobilising staff (non-office hours) sufficient for all casualties requiring immediate surgery. The final capacity-limiting factors in all tests was the access to intensive care, which also limited the capacity for surgery. On a scale 1-10, participating staff evaluated the accuracy of the methodology for test of surge capacity to MD 8 (IQR 2), for improvement of disaster plans to MD 9 (IQR 2) and for simultaneous training to MD 9 (IQR 3).

Conclusions: With a simulation system including patient data with a sufficient degree of detail, it was possible to identify and also numerically determine the critical capacity-limiting factors in the different phases of the hospital response to MCI, to serve as a base for planning, training, quality control and also necessary improvement to rise surge capacity of the individual hospital.

Keywords: Disaster; Hospital capacity; Hospital contingency; Hospital preparedness; Major incident; Mass casualty incident; Simulation; Surge capacity; Training.


Conflict of interest statement

One of the authors (KLM) has copyright to the MACSIM® simulation system used in this study.

Figures

Fig. 1
Fig. 1
The casualty cards used in this study (for description, see text) were based on real patients from real scenarios. The cards were connected to data files with live pictures, X-ray—and surgical findings as base for decisions with regard to treatment. For each patient, the instructors had access data regarding treatments that had to be done within a certain time to avoid mortality. This made it possible to determine the outcome as a result of the response and of the methodology used
Fig. 2
Fig. 2
All treatments and major diagnostic procedures were indicated by tags on the cards, also giving the time requested. The tests were run in real time and every treatment had to consume the same time and the same staff in reality. This picture illustrates the activity in the ED
Fig. 3
Fig. 3
The activity in the operating theatres (OR). All available staff were indicated by staff symbols according to an inventory performed on a corresponding day and time. No action was permitted without accurate staff. The tests were done with real time and no patient could be moved until the time needed for the decided procedures had passed
Fig. 4
Fig. 4
The activation and use of the teams for management of severely injured casualties in the Emergency Department (ED) in one of the tested hospitals (see further the text). The periods of very high casualty load, causing waiting times leading to calculated mortality, correspond to the “waves” of ambulances between returning and re-loading. To avoid preventable mortality, the inflow has to be temporarily stopped and casualties referred elsewhere. This puts high demands on coordination of casualty distribution. Blue: Trauma-teams (modified for MCI) in action, Green: Such trauma teams at disposal, Red: Severely injured patients having to wait for access to teams, Black: Preventable deaths caused by waiting
Fig. 5
Fig. 5
a–c The casualty load in hospital B (test B2) for patients triaged as a red, b yellow and c green. n = number of patients per time unit. Incident occurred at 10.00. a Those triaged as red exceeded the hospitals capacity for major trauma at several occasions, indicated by the black horizonal line, representing the maximal available number of units for major trauma (unit = room with equipment + qualified and sufficient staff). This caused waiting timed leading to preventable mortality according to the patient data provided by the test system. b Those triaged as yellow arrived in a similar pattern and number, but because of accurate triage, the waiting times this caused did not lead to any mortality. c Those triaged as green arrived in a more continuous flow, all not dependent on ambulances. These patients could be taken care of in other facilities and by other staff, did not interfere with treatment of the more severely injured, and caused no overloading
Fig. 6
Fig. 6
The casualty load on surgery also followed the same pattern in all the tested hospitals, here represented by the first test in hospital A. All hospitals in this test were well equipped with surgical theatres. The figure shows a test during office hours with most theatres occupied by on-going, planned surgery. By immediately on alert stopping all surgery that could wait, theatres needed for MCI patients could be made accessible without delay, and OR capacity was never exceeded. The same was valid in non-office hours, because it was equally fast to get theatres accessible by calling in staff off duty. From Lennquist Montán et al., Eur J Trauma Emerg Surg 2017; 43:525–539, with permission
Fig. 7
Fig. 7
Schematic illustration of the patient flow in the hospital in MCI response. The critical point in the first phase of the response is point 2 in the figure, secondary triage of severely injured and distributing them between available “Major incident trauma-teams” (MIT, designed to achieve optimal number of parallel teams with maintained quality of care). Waiting times to these teams have to be kept at a minimum to avoid complications and mortality. A higher number of severely injured than the teams can handle simultaneously should therefore not be referred to this hospital but directed elsewhere. Less severely injures can after primary triage run in separate line, consuming less resources, and is rarely a limiting factor for hospital capacity. Modified from Lennquist S: The hospital response. In: Lennquist S (Ed): Medical response to major incidents and disasters, Springer 2012, with permission
Fig. 8
Fig. 8
The figure illustrates the need of the coordinating functions always to be one step ahead and direct casualty flow elsewhere not when, but before the different components of the hospital are overloaded, which for different components occurs in different phases of the response (red signals). Equally important is to “open up” the flow if and when capacity is restored, which can be valid for the ED very fast and later for the OR, if overloaded. In all these tests, ICU capacity was the final limiting factor and that must be foreseen before it occurs
Fig. 9
Fig. 9
Schematic illustration of the coordination between scene (ambulance loading officer, ALO), hospitals (hospital command groups, HCG) and regional medical command centre (RMC). This coordination must be well trained and staffed by personnel with good knowledge of all components in the chain of management, staff that has to be repeatedly trained for this task and serve in an on-call system for MCI as a necessary component of the preparedness. Modified from Lennquist S, Dobson R. The prehospital response. In Lennquist S (Ed): Medical response to major incidents and disasters, Springer 2012, with permission

References

    1. Smith E, Waisak J, Archer F. Three decades of disasters—a review of disaster—specific literature from 1777–2009. Prehosp Disaster Med. 2009;24:306–311. doi: 10.1017/S1049023X00007020. - DOI - PubMed
    1. Aylwin CJ, König TC, Brennan NW, et al. Reduction of mortality in urban mass casualty incidents-analysis of triage, surgery and resources after the London bombings on July 07, 2005. Lancet. 2006;368:2219–2225. doi: 10.1016/S0140-6736(06)69896-6. - DOI - PubMed
    1. Lennquist S. Major incidents—definitions and demands on the health care system. In: Lennquist (ed) Medical response to major incidents and disasters. Springer (Berlin/London/New York) 2012; 1:1–8
    1. Marcozzi DE, Pietrobon R, Lawler JV, et al. Development of a hospital medical surge preparedness index using a national hospital survey. Health Serv Outcomes Res Methodol. 2020;20:60–83 - PMC - PubMed
    1. Asplin BR, Flottemesch TJ, Gordon BD. Developing models for patient flow and daily surge capacity research. Acad Emerg Med. 2006;13:1109–1113. doi: 10.1197/j.aem.2006.07.004. - DOI - PubMed