. 2023 Mar;41(3):417-426.
doi: 10.1038/s41587-022-01468-y. Epub 2022 Sep 26.

Haplotype-aware analysis of somatic copy number variations from single-cell transcriptomes

Affiliations

Haplotype-aware analysis of somatic copy number variations from single-cell transcriptomes

Teng Gao et al. Nat Biotechnol. 2023 Mar.

Abstract

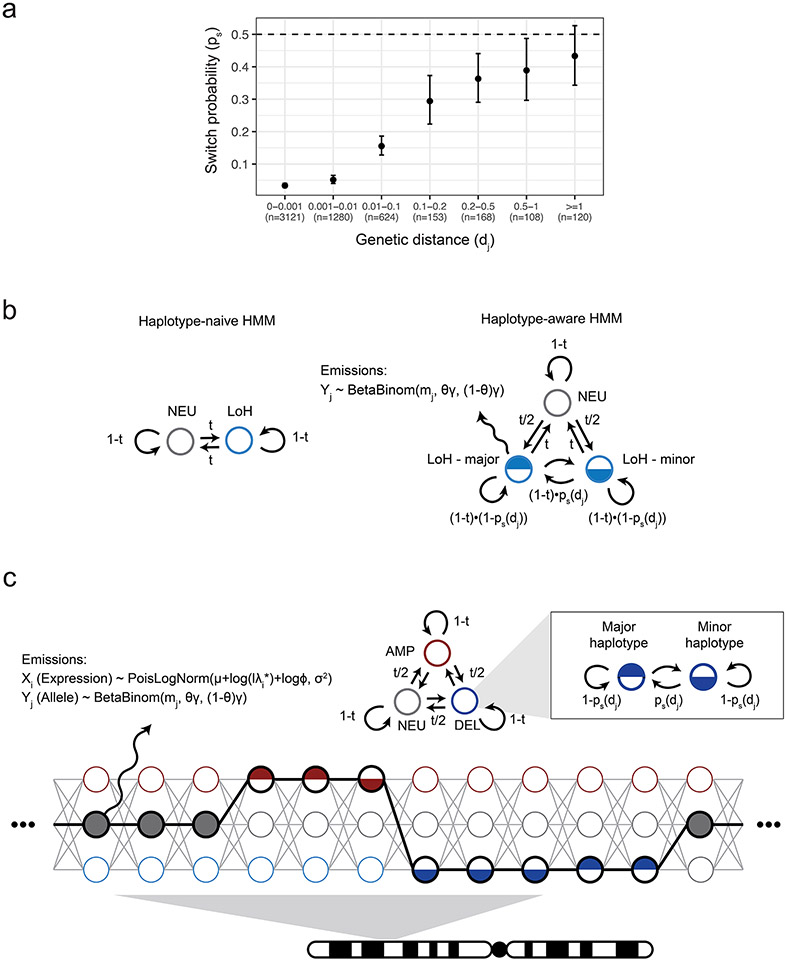
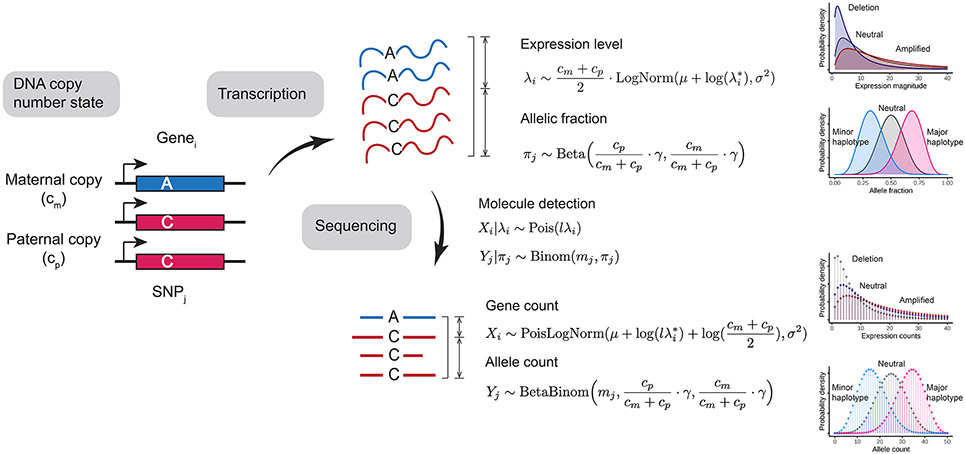
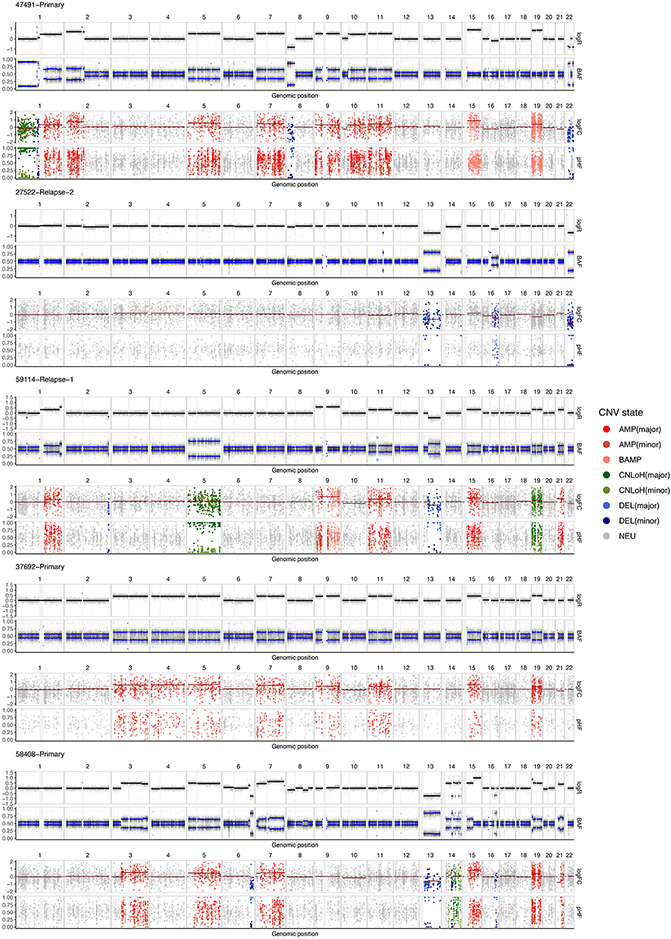
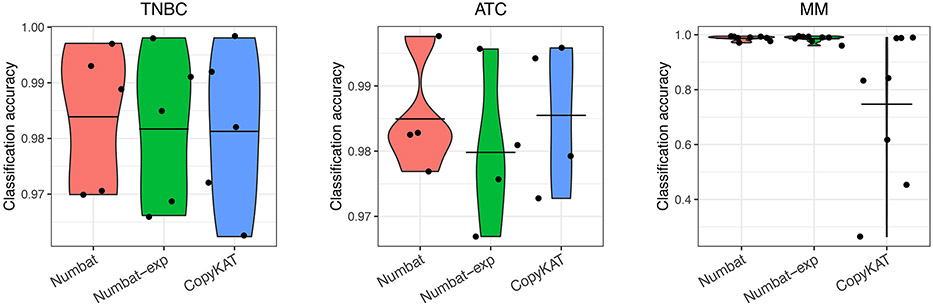
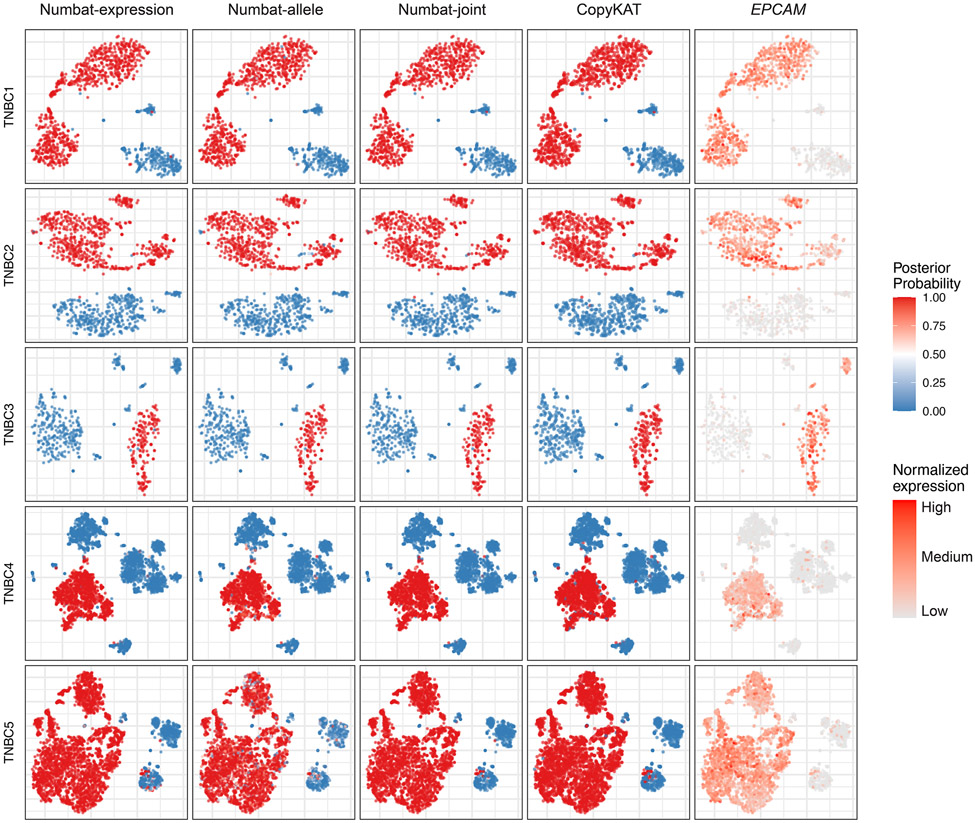
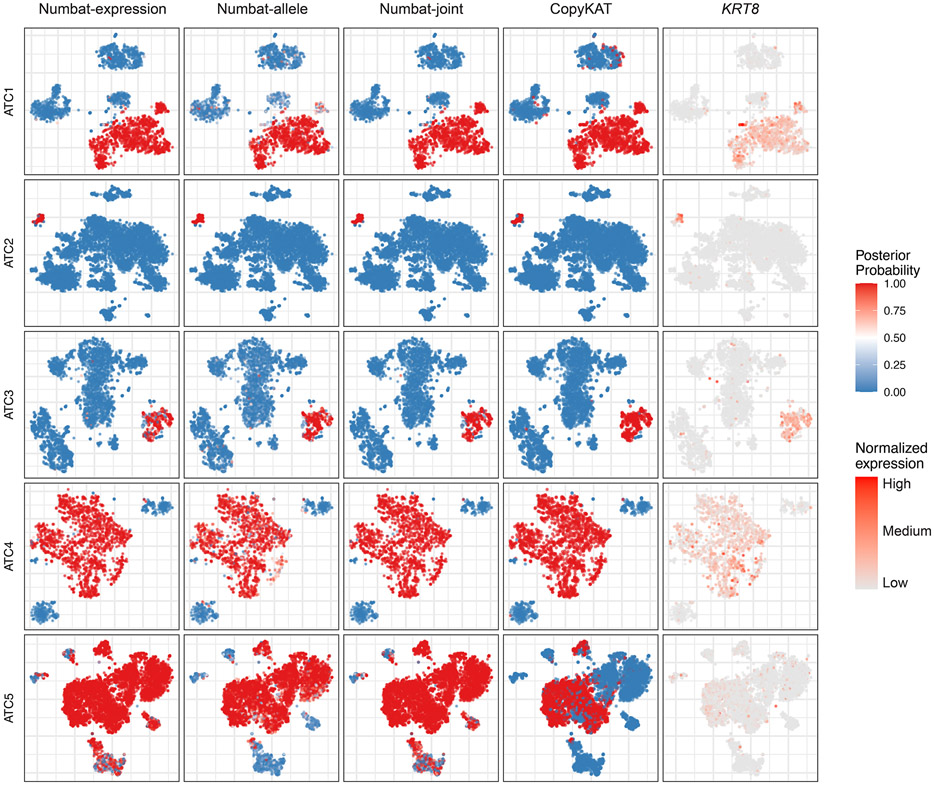
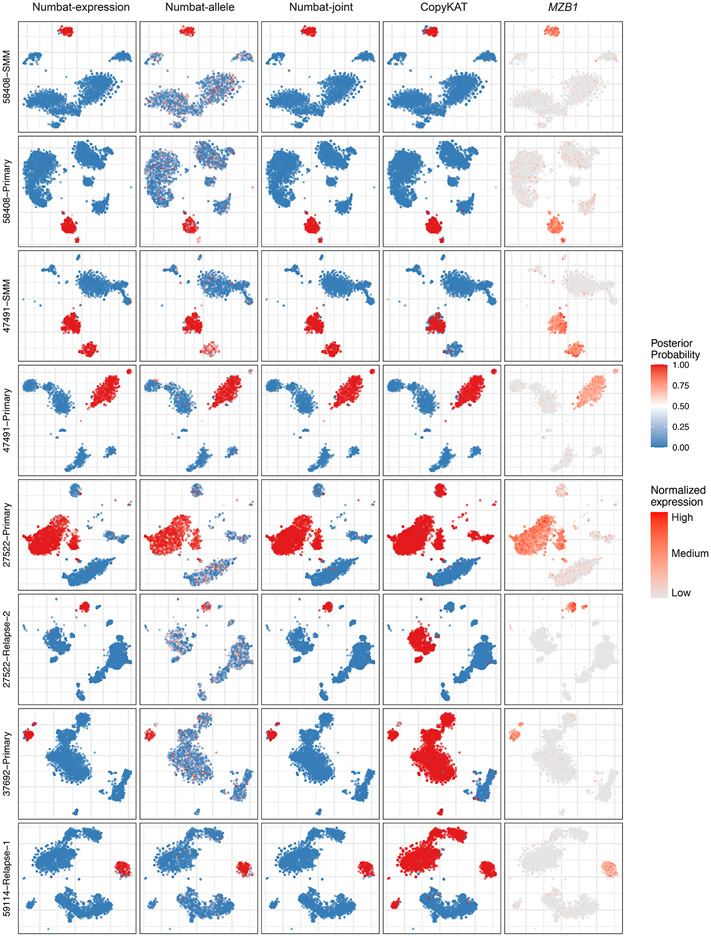
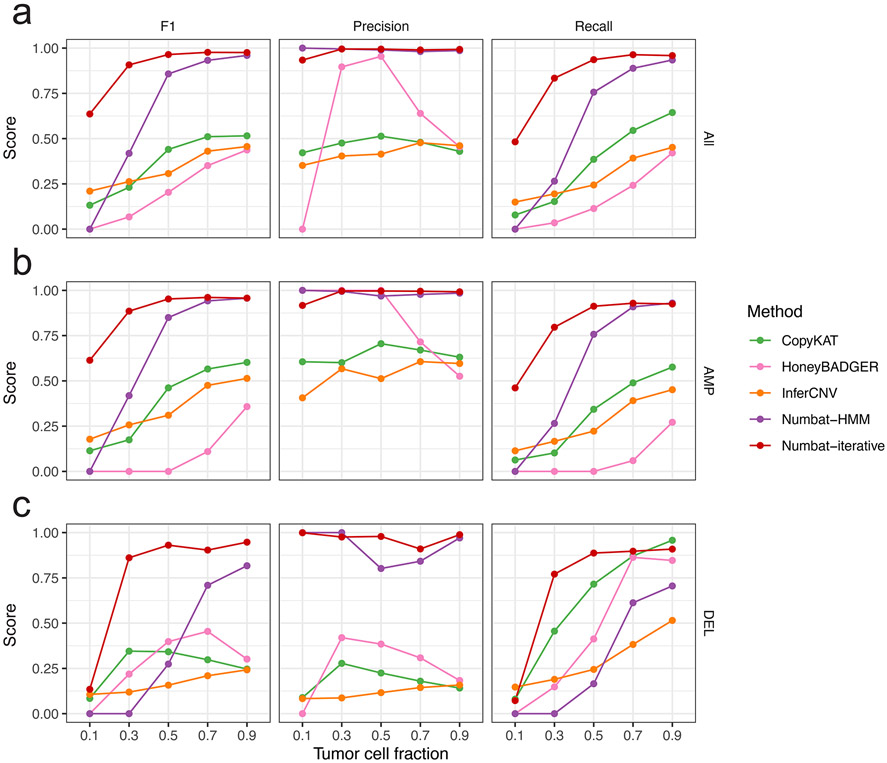
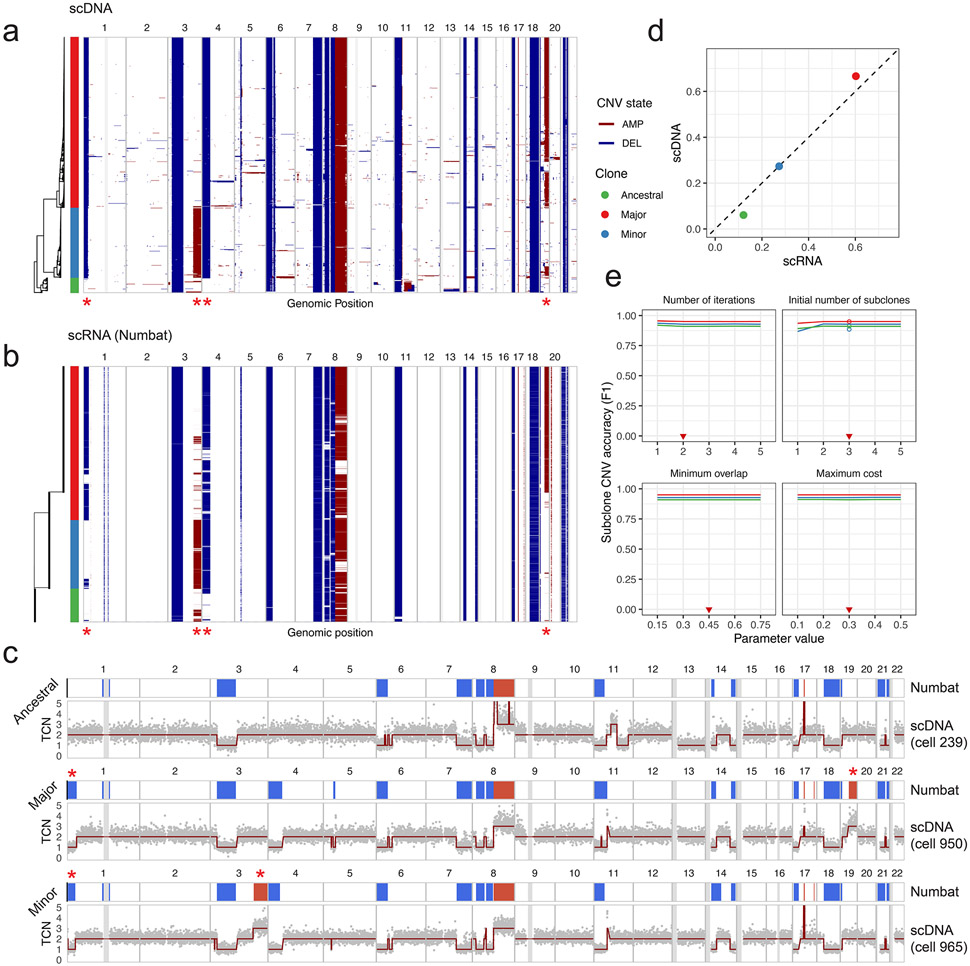
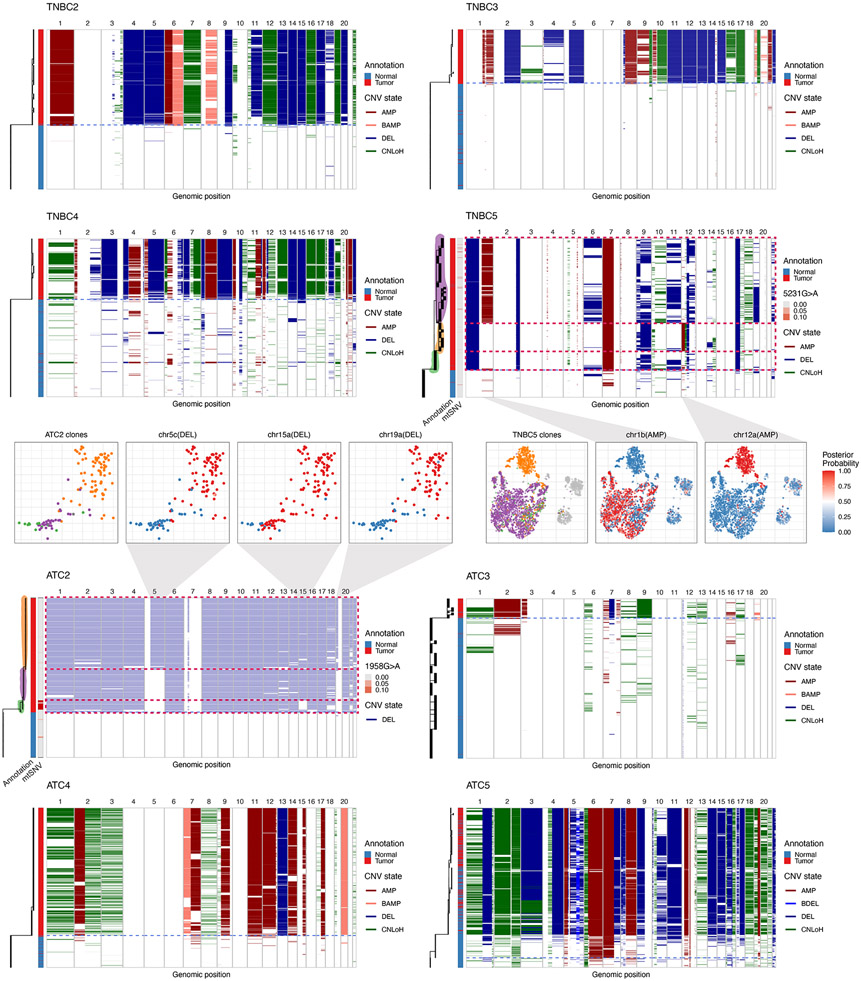
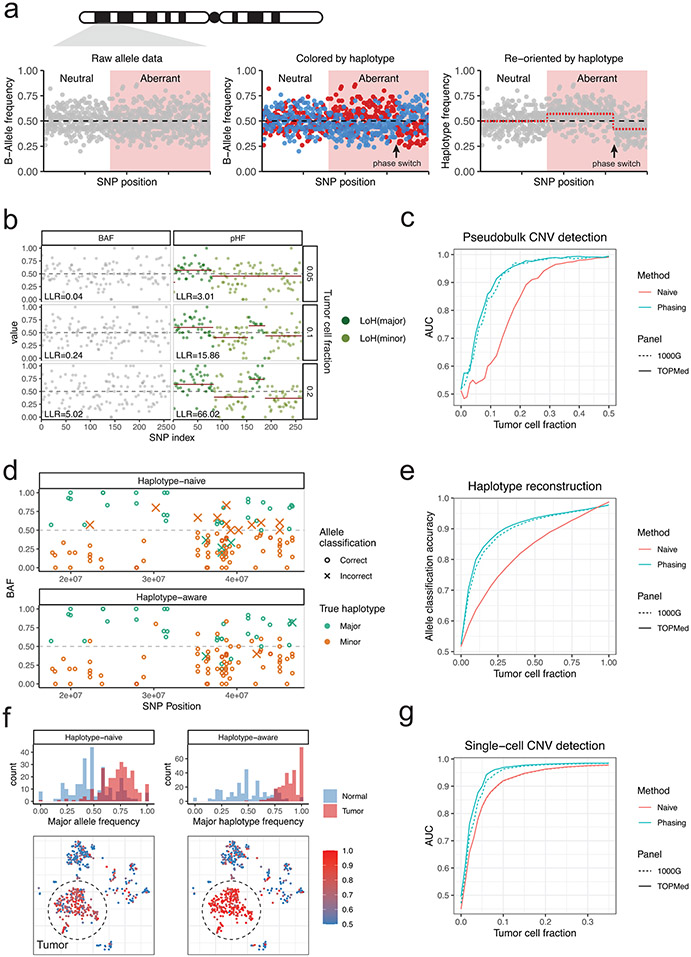
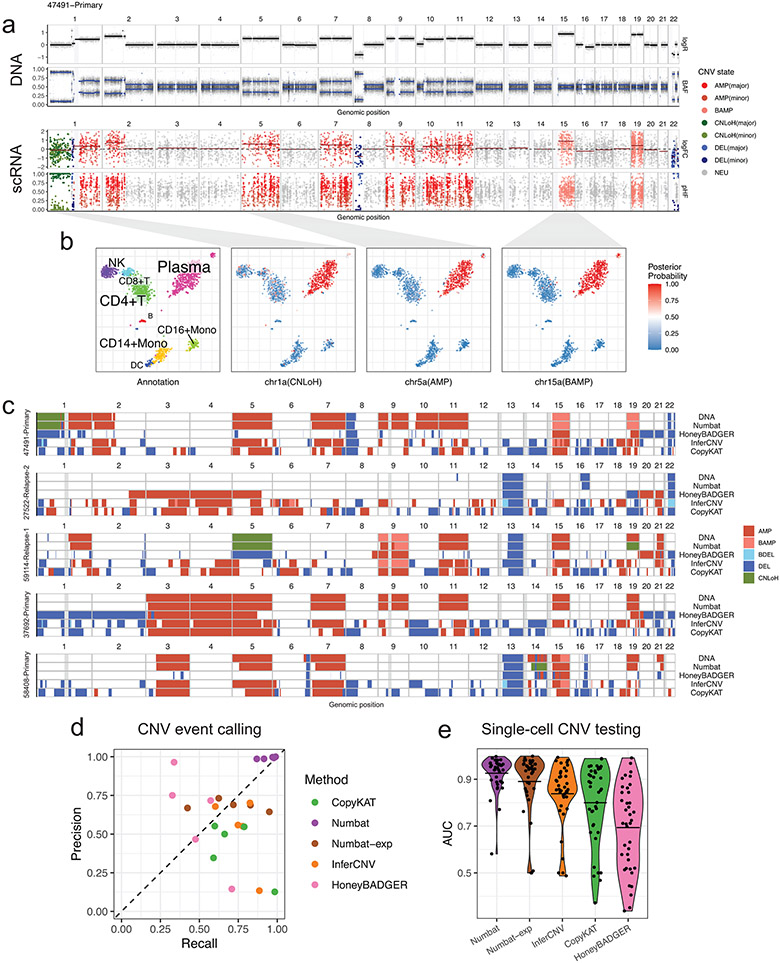
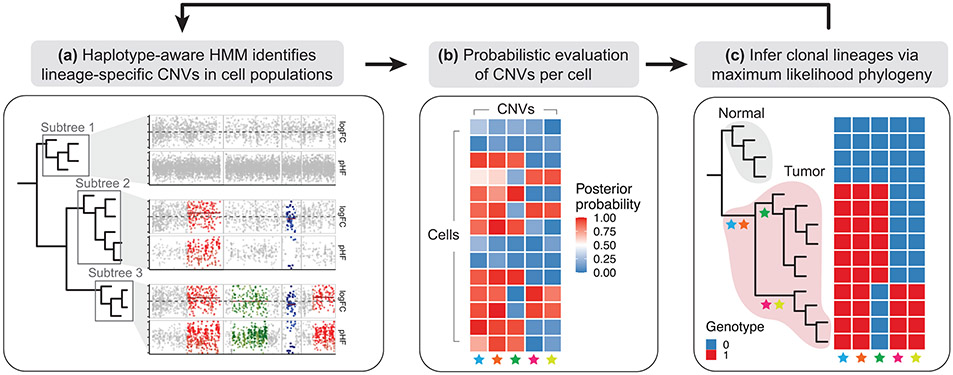
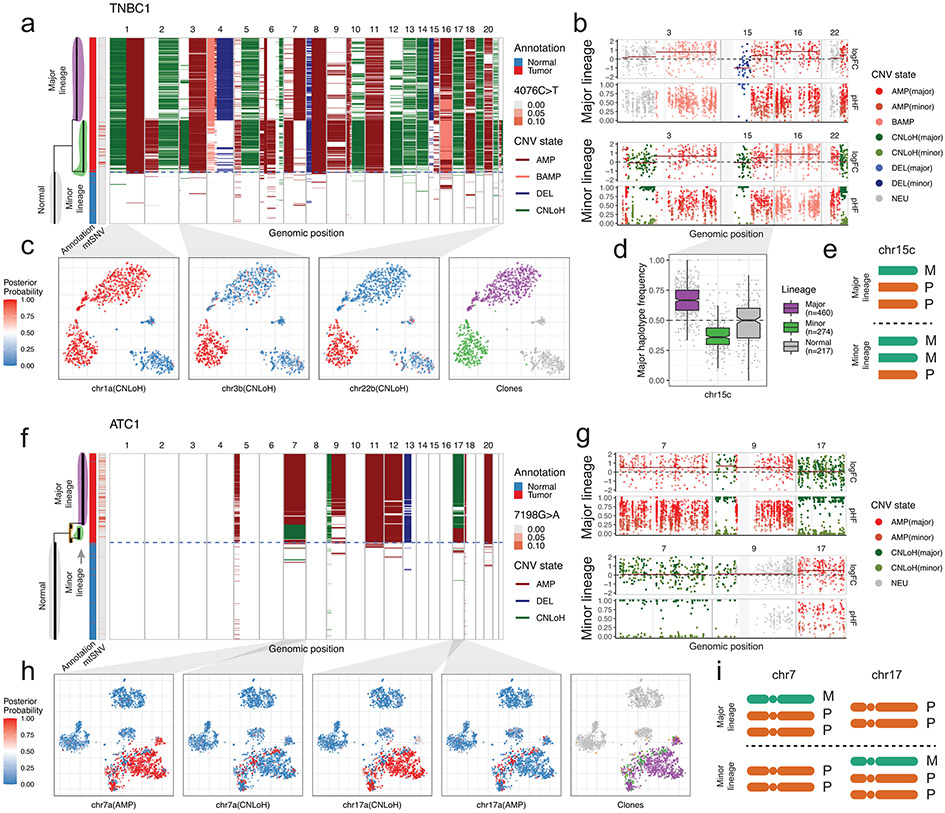
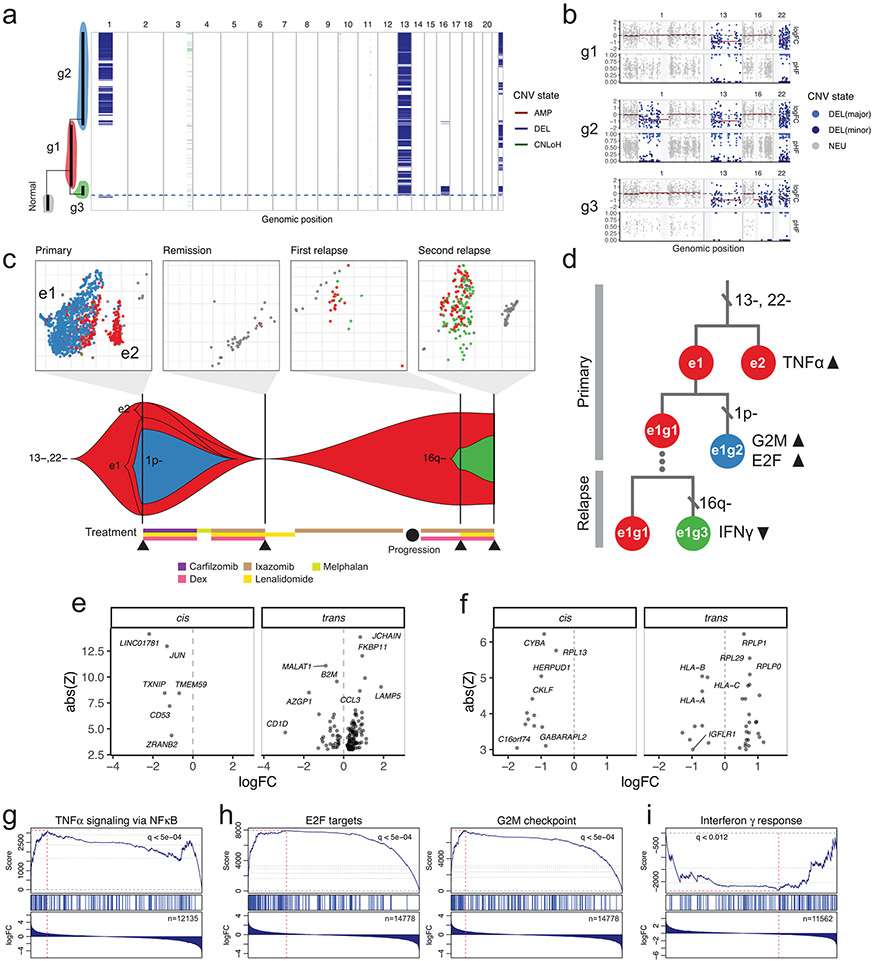
Genome instability and aberrant alterations of transcriptional programs both play important roles in cancer. Single-cell RNA sequencing (scRNA-seq) has the potential to investigate both genetic and nongenetic sources of tumor heterogeneity in a single assay. Here we present a computational method, Numbat, that integrates haplotype information obtained from population-based phasing with allele and expression signals to enhance detection of copy number variations from scRNA-seq. Numbat exploits the evolutionary relationships between subclones to iteratively infer single-cell copy number profiles and tumor clonal phylogeny. Analysis of 22 tumor samples, including multiple myeloma, gastric, breast and thyroid cancers, shows that Numbat can reconstruct the tumor copy number profile and precisely identify malignant cells in the tumor microenvironment. We identify genetic subpopulations with transcriptional signatures relevant to tumor progression and therapy resistance. Numbat requires neither sample-matched DNA data nor a priori genotyping, and is applicable to a wide range of experimental settings and cancer types.


Figures

Extended Data Fig. 1
Extended Data Fig. 1. Haplotype-aware Hidden Markov models.
a, Phase switch probability as a function of genetic distance, estimated from alleles phased from LoH regions in TNBC4. Genetic distance is measured in centimorgan (cM). Error bar represents 95% CI derived from a binomial test. The center of the error bar represents the observed fraction of phase switches. b, Schematic of conventional and haplotype-aware allele HMM. t, copy number state transition probability. ps, phase transition probability. c, Schematic of the Numbat joint HMM. Only three copy number states (neutral, deletion, amplification) are included for illustrative purposes.
Extended Data Fig. 2
Extended Data Fig. 2. Probabilistic model of gene expression and allele counts from transcriptome sequencing experiments.
cm, number of maternal chromosome copies. cp, number of paternal chromosome copies. λi, observed gene expression magnitude of gene i. λi, reference gene expression magnitude of gene i. μ and σ2, global bias and variance in gene expression. πj, fraction of paternal alleles of SNP j. γ, global inverse overdispersion of allele-specific detection. l, library size. mj, total allele count of SNP j. Xi, observed molecule counts for gene i. Yj, observed paternal allele count for SNP j.
Extended Data Fig. 3
Extended Data Fig. 3. WGS validation of Numbat CNV calls from scRNA-seq data.
For each sample, the DNA profile (top) is juxtaposed with the copy number profile inferred by the Numbat joint HMM (bottom). Gray vertical bars represent centromeres and gap regions. logR, log coverage ratio. BAF, B-allele frequency. logFC, log expression fold-change. pHF, paternal haplotype frequency. BAMP, balanced amplification.
Extended Data Fig. 4
Extended Data Fig. 4. Tumor versus normal cell classification accuracy of Numbat joint model, Numbat expression-only model, and CopyKAT.
Each dot represents a distinct sample (TNBC, n = 5; ATC, n = 4; MM, n = 8). Center line, mean. ATC5 was excluded from the benchmark due to lack of clear expression of tumor marker KRT8.
Extended Data Fig. 5
Extended Data Fig. 5. Numbat reliably distinguishes tumor and normal cells (TNBC series).
The aneuploidy probability is shown as a color gradient (red: high, blue: low). For each sample (row), the series of figures (columns) respectively show the aneuploidy probabilities by expression evidence, those by allele evidence, those by combined evidence, CopyKAT prediction (binary 0 or 1), and marker gene expression in a t-SNE embedding of gene expression profiles.
Extended Data Fig. 6
Extended Data Fig. 6. Numbat reliably distinguishes tumor and normal cells (ATC series).
The aneuploidy probability is shown as a color gradient (red: high, blue: low). For each sample (row), the series of figures (columns) respectively show the aneuploidy probabilities by expression evidence, those by allele evidence, those by combined evidence, CopyKAT prediction (binary 0 or 1), and marker gene expression in a t-SNE embedding of gene expression profiles.
Extended Data Fig. 7
Extended Data Fig. 7. Numbat reliably distinguishes tumor and normal cells (MM series).
The aneuploidy probability is shown as a color gradient (red: high, blue: low). For each sample (row), the series of figures (columns) respectively show the aneuploidy probabilities by expression evidence, those by allele evidence, those by combined evidence, CopyKAT prediction (binary 0 or 1), and marker gene expression in a t-SNE embedding of gene expression profiles.
Extended Data Fig. 8
Extended Data Fig. 8. CNV detection performance as a function of tumor cell fraction.
At each tumor cell fraction, tumor cells were subsampled and mixed with randomly sampled normal cells at the corresponding proportion. Precision, recall and F1 scores were calculated based on the detected segments from scRNA-seq data and the ground truth copy number profiles (from WGS) in 5 multiple myeloma samples. For Numbat, two methods are compared: pseudobulk joint HMM (Numbat-HMM) and iterative optimization (Numbat-iterative) with no minimum pseudobulk size limit. a, Performance for all event types (amplification, deletion, and CNLoH). b, Performance for amplifications. c, Performance for deletions.
Extended Data Fig. 9
Extended Data Fig. 9. Numbat analysis of gastric cell line (NCI-N87) scRNA-seq data and validation by scDNA-seq.
a, Single-cell copy number landscape and subclonal structure reconstructed by scDNA-seq data. Gray vertical bars represent gap regions. A rooted hierarchical clustering tree is shown on the left. Three subclones were defined by cutting the tree with k=3. Red asterisks denote salient subclonal events. b, Single-cell CNV landscape and subclonal structure inferred from the paired scRNA-seq data by Numbat. The original prediction was composed of four subclones. The uppermost two clones were merged and denoted as the “major” clone. Red asterisks denote validated subclonal events. c, Subclone-specific copy number profiles. For each subclone, the top track shows CNV calls made by clone-specific Numbat HMM; the bottom track shows DNA copy number profile of a representative cell from that subclone. Gray vertical bars represent gap regions. d, Numbat recapitulates clonal fractions measured by scDNA-seq. e, Stability and accuracy of Numbat CNV calls for each subclone with respect to parameter variations. F1 scores were computed by comparing DNA profiles for each subclone with the best-matching subclone CNV profiles predicted by Numbat. Circles denote F1 score from initialization with a random tree. Red triangles mark default parameter values.
Extended Data Fig. 10
Extended Data Fig. 10. Single-cell copy number profile and phylogeny reconstructed by Numbat (TNBC and ATC).
Branch lengths correspond to the number of CNV events. Blue dashed line separates predicted tumor and normal cells. Confident subclones are highlighted and marked by red dashed rectangles. The vertical bar on the left of each panel shows cell type ground truth. In TNBC5 and ATC2, the second vertical bar on the left of the panel shows variant allele frequency of a clone-associated mtRNA mutation. For ATC2, results from the subsampled dataset (including aneuploid cells and 50 randomly sampled normal cells) are shown. In ATC5, some tumor cells were likely mis-annotated as normal in the original annotation.
Figure 1:
Figure 1:. Population-based haplotype phasing enables sensitive detection of subclonal allelic imbalances in single-cell transcriptomes.
a, Schematic of using haplotype information to detect allelic imbalance. BAF, B-allele frequency. Simulated BAF signals are shown for a neutral and aberrant region harboring subclonal CNV. After BAF is transformed into haplotype frequency based on phase information, CNV signals become apparent and can be segmented. b, Example of statistical phasing signal uncovering subclonal LoH in TNBC4 tumor-normal cell mixtures that are undetectable using BAF deviation. LLR, log-likelihood ratio. LoH, loss of heterozygosity. c, Performance of LoH detection in tumor-normal mixtures with and without haplotype phasing (“phasing” and “naive”). AUC, area under the ROC curve. d, Example of population-based phasing informing allele classification into major/minor haplotypes. e, Performance of allele classification accuracy in tumor-normal mixtures. f, Example of population-based phasing improving detection of LoH in single cells. g, Performance of LoH detection in single cells.
Figure 2:
Figure 2:. Numbat achieves accurate copy number inference via joint evaluation of gene expression, allele fraction, and prior haplotype phasing information.
a, DNA copy number profile of a multiple myeloma sample juxtaposed with that inferred by the Numbat joint HMM. logFC, log expression fold-change. pHF, paternal haplotype frequency. logR, log coverage ratio. BAF, B-allele frequency. Gray vertical bars represent centromeres and gap regions. b, Cell type annotation and posterior probability of CNV events in single cells visualized on a t-SNE embedding of gene expression profiles. c, Copy number events detected by WGS, Numbat, and other methods. Gray vertical bars represent gap regions. BAMP, balanced amplification. BDEL, balanced deletion. d, Performance of CNV event detection by different methods. Each dot represents a distinct sample. e, Performance of single-cell CNV testing by different methods. Each dot represents a distinct CNV event (n=39). Center line, mean.
Figure 3:
Figure 3:. Iterative strategy to identify tumor subclones.
a, Numbat aggregates data from single cells into pseudobulk profiles by major clades in the single-cell phylogeny, and runs a haplotype-aware HMM on each pseudobulk profile to identify lineage-specific CNVs. b, Numbat evaluates the presence of each CNV in each cell probabilistically using a Bayesian hierarchical model. c, Numbat then infers a maximum-likelihood phylogeny that captures the evolutionary relationships between single cells.
Figure 4:
Figure 4:. Numbat reveals additional complexity in tumor subclones through allele-specific copy number analysis.
a, Single-cell CNV landscape and reconstructed phylogeny of TNBC1. Branch lengths correspond to the number of CNVs. Blue dashed line separates predicated tumor and normal cells. The first vertical bar on the left shows cell type ground truth. The second vertical bar on the left shows variant allele frequency of a clone-associated mtRNA mutation (4076C>T). b, Pseudobulk CNV profile of the major and minor lineage. Gray vertical bars represent centromeres and gap regions. logFC, log expression fold-change. pHF, paternal haplotype frequency. c, Posterior CNV probability of shared and lineage-sepcific CNVs in a t-SNE embedding of gene expression profiles. d, Major haplotype frequency in single cells. Only cells with at least 5 total allele counts in the region are shown. Center line, median; box limits, upper and lower quartiles; whiskers, 1.5x interquartile range. e, Schematic of copy number state of chr15c in the major and minor lineage. M, maternal. P, paternal. The designation of maternal and paternal chromosomes is arbitrary. f, Single-cell CNV landscape and reconstructed phylogeny of ATC1. g, Pseudobulk CNV profile of the major and minor lineage. h, Posterior CNV probability of subclonal multi-allelic CNVs in a t-SNE embedding of gene expression profiles. i, Schematic of copy number states of chr7 and chr17 in the major (top) and minor (bottom) lineages.
Figure 5:
Figure 5:. Tracking clonal evolution of a therapy-resistant multiple myeloma using Numbat.
a, Integrated single-cell CNV landscape and phylogeny of plasma cells from all four samples. b, Pseudobulk CNV profile of three main tumor subclones. Gray vertical bars represent centromeres and gap regions. c, Clonal evolutionary history integrating genetic and transcriptional alterations. Top, t-SNE embedding of gene expression profiles colored by genetic clones. The embeddings are created separately for each sample. Only cells with >90% posterior classification confidence are shown. Bottom, change in tumor clonal composition over time. At each time point, only clones with more than 5% cellular fraction are shown. d, Genetic and transcriptional alterations in the proposed evolutionary history. e, Differentially expressed genes between e1g2 (observation) and e1g1 (reference) cells. f, Differentially expressed genes between e1g3 (observation) and e1g1 (reference) cells. g, GSEA plot of the TNFα signaling pathway in e2g1 relative to e1g1 cells. h, GSEA plots of the E2F target and G2M checkpoint pathways in e1g2 relative to e1g1 cells. i, GSEA plot of the IFNγ pathway in e1g3 relative to e1g1 cells.

References

    1. Mansoori B, Mohammadi A, Davudian S, Shirjang S & Baradaran B The different mechanisms of cancer drug resistance: A brief review. Adv. Pharm. Bull 7, 339–348 (2017). - PMC - PubMed
    1. Fan J. et al. Linking transcriptional and genetic tumor heterogeneity through allele analysis of single-cell RNA-seq data. Genome Res. 28, 1217–1227 (2018). - PMC - PubMed
    1. Gao R. et al. Delineating copy number and clonal substructure in human tumors from single-cell transcriptomes. Nat. Biotechnol 39, 599–608 (2021). - PMC - PubMed
    1. Patel AP et al. Single-cell RNA-seq highlights intratumoral heterogeneity in primary glioblastoma. Science 344, 1396–1401 (2014). - PMC - PubMed
    1. Serin Harmanci A, Harmanci AO & Zhou X CaSpER identifies and visualizes CNV events by integrative analysis of single-cell or bulk RNA-sequencing data. Nat. Commun 11, 89 (2020). - PMC - PubMed

Methods-only References

    1. Barkas N. et al. Joint analysis of heterogeneous single-cell RNA-seq dataset collections. Nat. Methods 16, 695–698 (2019). - PMC - PubMed
    1. Huang X & Huang Y Cellsnp-lite: an efficient tool for genotyping single cells. Bioinformatics 37, 4569–4571 (2021). - PubMed
    1. Priestley P. et al. Pan-cancer whole-genome analyses of metastatic solid tumours. Nature 575, 210–216 (2019). - PMC - PubMed
    1. Nilsen G. et al. Copynumber: Efficient algorithms for single- and multi-track copy number segmentation. BMC Genomics 13, 591 (2012). - PMC - PubMed
    1. Navin N et al. Tumour evolution inferred by single-cell sequencing. Nature 472, 90–94 (2011). - PMC - PubMed

Publication types