

Bioaerosol distribution characteristics and potential SARS-CoV-2 infection risk in a multi-compartment dental clinic
- PMID: 36164582
- PMCID: PMC9494923
- DOI: 10.1016/j.buildenv.2022.109624
Bioaerosol distribution characteristics and potential SARS-CoV-2 infection risk in a multi-compartment dental clinic
Abstract
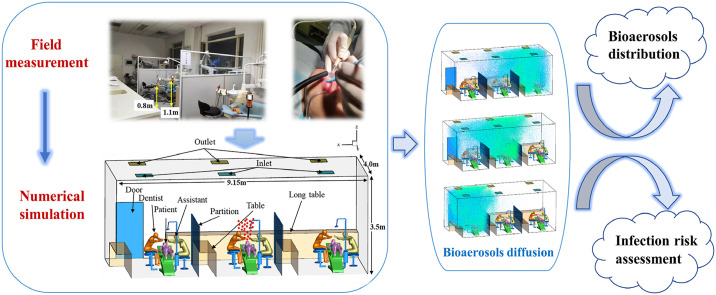
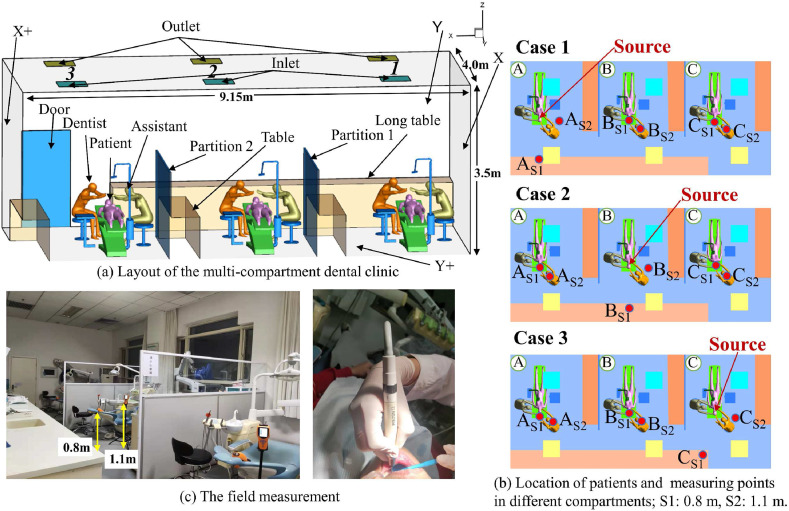
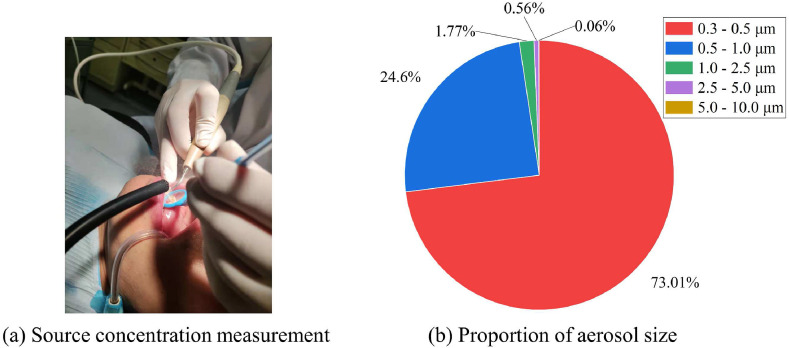
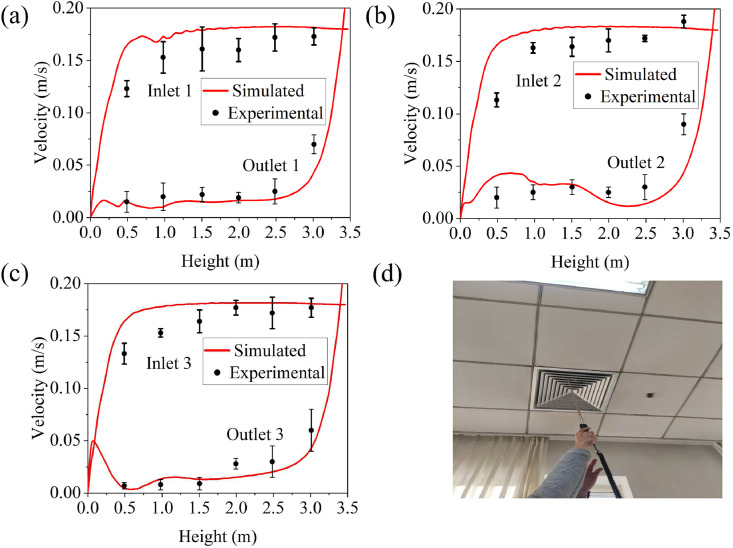
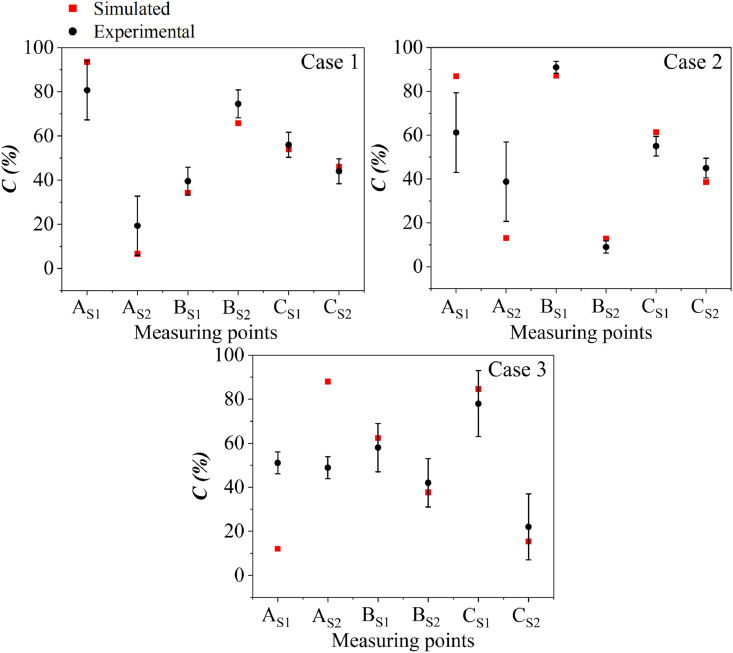
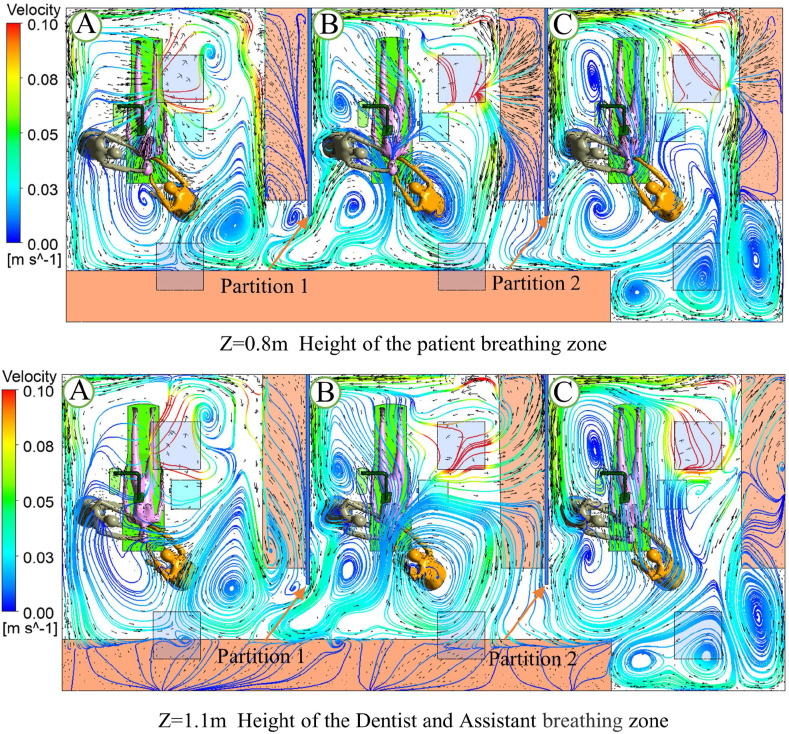
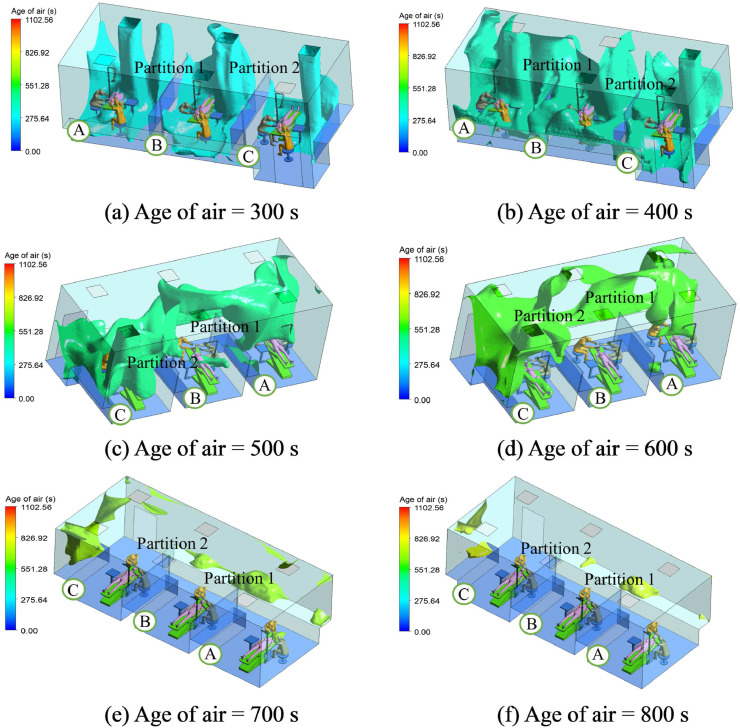
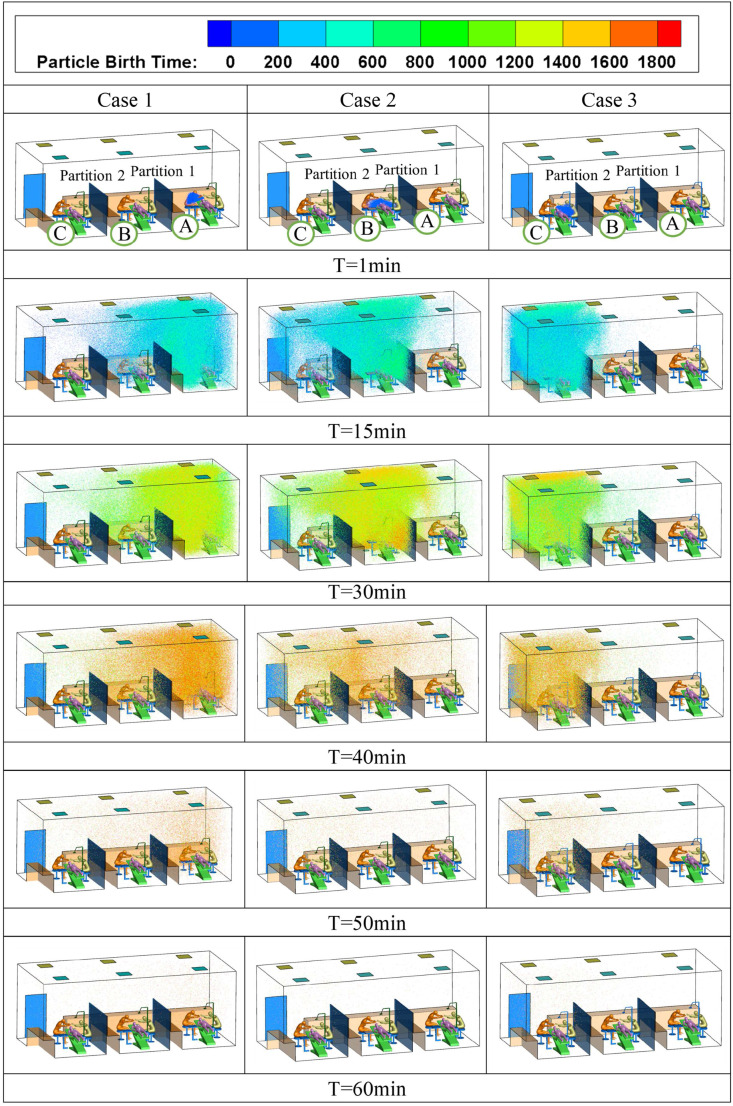
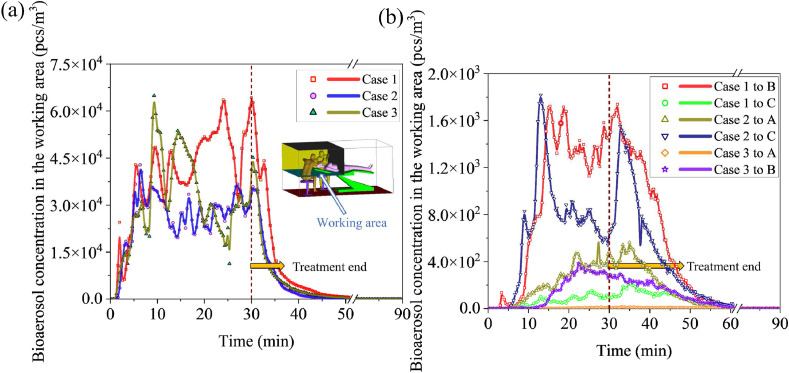
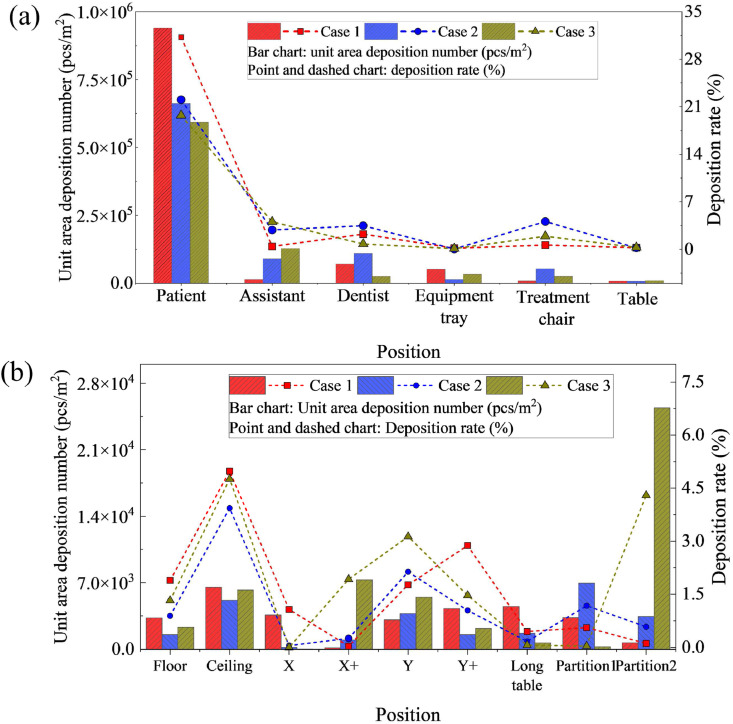
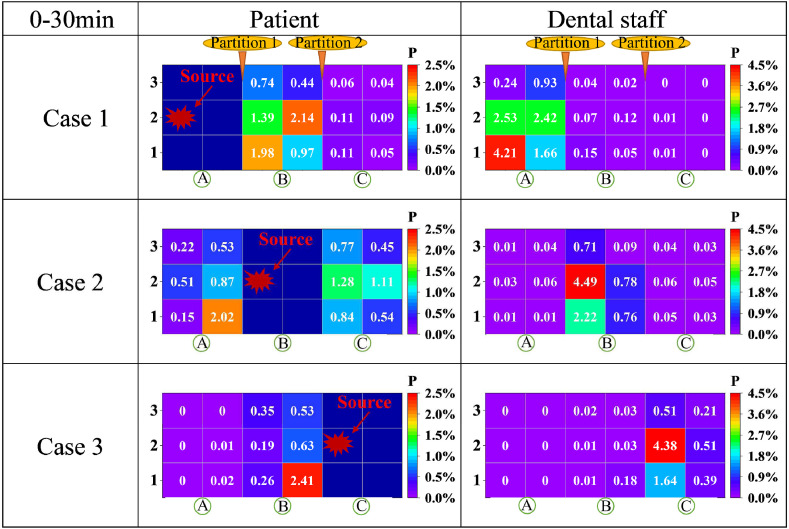
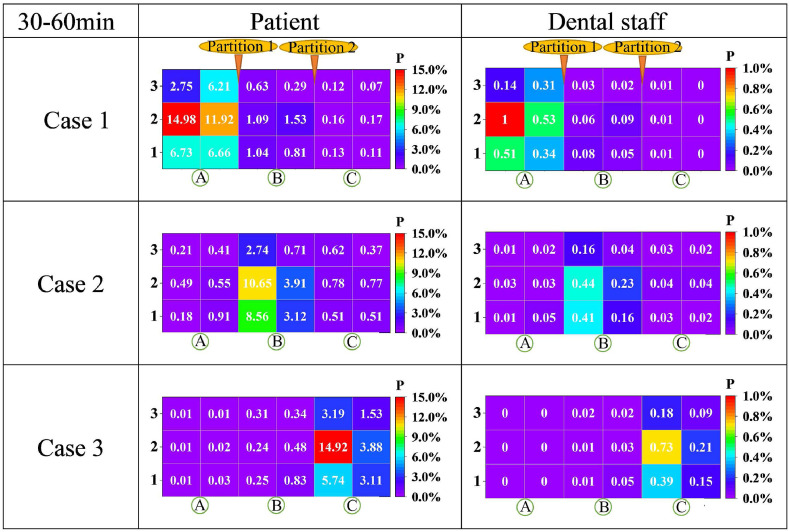
Dental clinics have a potential risk of infection, particularly during the COVID-19 pandemic. Multi-compartment dental clinics are widely used in general hospitals and independent clinics. This study utilised computational fluid dynamics to investigate the bioaerosol distribution characteristics in a multi-compartment dental clinic through spatiotemporal distribution, working area time-varying concentrations, and key surface deposition. The infection probability of SARS-CoV-2 for the dental staff and patients was calculated using the Wells-Riley model. In addition, the accuracy of the numerical model was verified by field measurements of aerosol concentrations performed during a clinical ultrasonic scaling procedure. The results showed that bioaerosols were mainly distributed in the compartments where the patients were treated. The average infection probability was 3.8% for dental staff. The average deposition number per unit area of the treatment chair and table are 28729 pcs/m2 and 7945 pcs/m2, respectively, which creates a possible contact transmission risk. Moreover, there was a certain cross-infection risk in adjacent compartments, and the average infection probability for patients was 0.84%. The bioaerosol concentrations of the working area in each compartment 30 min post-treatment were reduced to 0.07% of those during treatment, and the infection probability was <0.05%. The results will contribute to an in-depth understanding of the infection risk in multi-compartment dental clinics, forming feasible suggestions for management to efficiently support epidemic prevention and control in dental clinics.
Keywords: Airborne transmission; COVID-19; Risk assessment; Wells–Riley model.
© 2022 Elsevier Ltd. All rights reserved.
Conflict of interest statement
The authors declare that they have no known competing financial interests or personal relationships that could have appeared to influence the work reported in this paper.
Figures

Similar articles
-
Estimating the restraint of SARS-CoV-2 spread using a conventional medical air-cleaning device: Based on an experiment in a typical dental clinical setting.Int J Hyg Environ Health. 2023 Mar;248:114120. doi: 10.1016/j.ijheh.2023.114120. Epub 2023 Jan 27. Int J Hyg Environ Health. 2023. PMID: 36709744 Free PMC article.
-
A pilot study of bioaerosol reduction using an air cleaning system during dental procedures.Br Dent J. 2010 Oct 23;209(8):E14. doi: 10.1038/sj.bdj.2010.975. Epub 2010 Oct 15. Br Dent J. 2010. PMID: 20953167 Free PMC article.
-
A spatiotemporally resolved infection risk model for airborne transmission of COVID-19 variants in indoor spaces.Sci Total Environ. 2022 Mar 15;812:152592. doi: 10.1016/j.scitotenv.2021.152592. Epub 2021 Dec 23. Sci Total Environ. 2022. PMID: 34954184 Free PMC article.
-
Transmission routes of SARS-CoV-2 and protective measures in dental clinics during the COVID-19 pandemic.Am J Dent. 2020 Jun;33(3):129-134. Am J Dent. 2020. PMID: 32470237 Review.
-
Minimum Sizes of Respiratory Particles Carrying SARS-CoV-2 and the Possibility of Aerosol Generation.Int J Environ Res Public Health. 2020 Sep 23;17(19):6960. doi: 10.3390/ijerph17196960. Int J Environ Res Public Health. 2020. PMID: 32977575 Free PMC article. Review.
Cited by
-
Study of aerosol dispersion and control in dental practice.Clin Oral Investig. 2024 Jan 27;28(1):120. doi: 10.1007/s00784-024-05524-6. Clin Oral Investig. 2024. PMID: 38280059
-
Social stability risk analysis caused by land acquisition and migration for water conservancy project construction.Sci Rep. 2025 May 28;15(1):18672. doi: 10.1038/s41598-025-01955-7. Sci Rep. 2025. PMID: 40436947 Free PMC article.
References
-
- Gupta J.K., Lin C.H., Chen Q. Flow dynamics and characterization of a cough. Indoor Air. 2009;19(6):517–525. - PubMed
LinkOut - more resources
Full Text Sources
Miscellaneous