Meta-Analysis
. 2023 Jan;19(1):e13431.
doi: 10.1111/mcn.13431. Epub 2022 Sep 27.

Anthropometric deficits and the associated risk of death by age and sex in children aged 6-59 months: A meta-analysis

Affiliations
Meta-Analysis

Anthropometric deficits and the associated risk of death by age and sex in children aged 6-59 months: A meta-analysis

Susan Thurstans et al. Matern Child Nutr. 2023 Jan.

Abstract

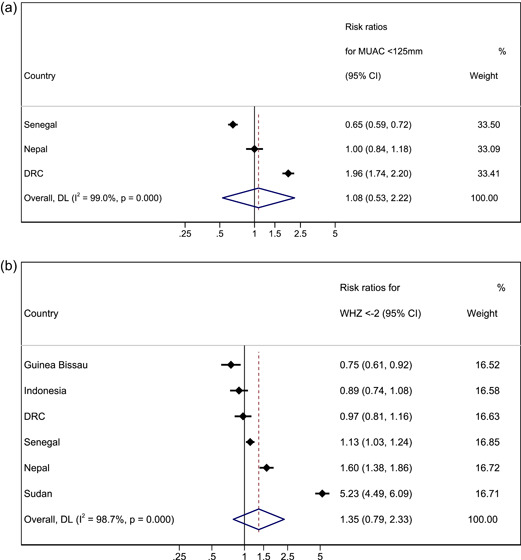
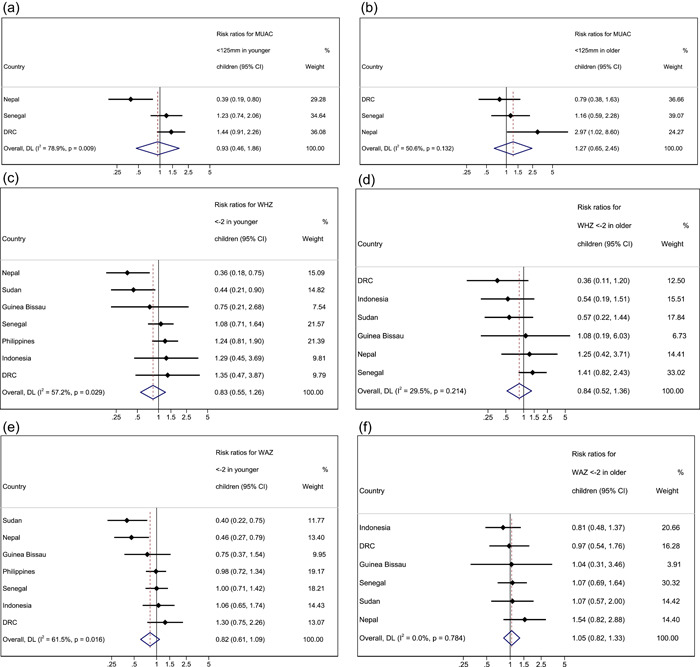
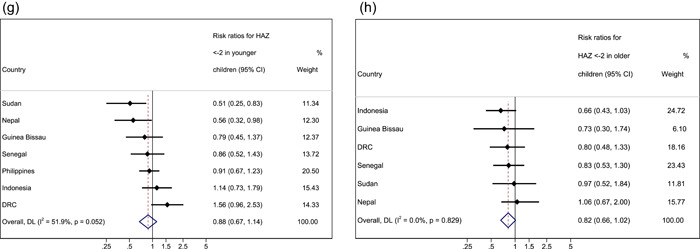
Risk of death from undernutrition is thought to be higher in younger than in older children, but evidence is mixed. Research also demonstrates sex differences whereby boys have a higher prevalence of undernutrition than girls. This analysis described mortality risk associated with anthropometric deficits (wasting, underweight and stunting) in children 6-59 months by age and sex. We categorised children into younger (6-23 months) and older (24-59 months) age groups. Age and sex variations in near-term (within 6 months) mortality risk, associated with individual anthropometric deficits were assessed in a secondary analysis of multi-country cohort data. A random effects meta-analysis was performed. Data from seven low-or-middle-income-countries collected between 1977 and 2013 were analysed. One thousand twenty deaths were recorded for children with anthropometric deficits. Pooled meta-analysis estimates showed no differences by age in absolute mortality risk for wasting (RR 1.08, p = 0.826 for MUAC < 125 mm; RR 1.35, p = 0.272 for WHZ < -2). For underweight and stunting, absolute risk of death was higher in younger (RR 2.57, p < 0.001) compared with older children (RR 2.83, p < 0.001). For all deficits, there were no differences in mortality risk for girls compared with boys. There were no differences in the risk of mortality between younger and older wasted children, supporting continued inclusion of all children under-five in wasting treatment programmes. The risk of mortality associated with underweight and stunting was higher among younger children, suggesting that prevention programmes might be justified in focusing on younger children where resources are limited. There were no sex differences by age in mortality risk for all deficits.

Keywords: age; mortality; sex; stunting; underweight; wasting.


Conflict of interest statement

The authors declare no conflicts of interest.

Figures

Figure 1
Figure 1
Study flow chart.
Figure 2
Figure 2
Forest plots for pooled risk ratios of mortality in children 6–23 months versus 24–59 months for MUAC < 125 mm WHZ < −2, WAZ < −2 and HAZ < −2. (a) Mortality risk ratio between younger and older (reference group) age group for MUAC < 125 mm. (b) Mortality risk ratio between younger and older (reference group) age group for WHZ < −2. (c) Mortality risk ratio between younger and older (reference group) age group for WAZ < −2. (d) Mortality risk ratio between younger and older (reference group) age group for HAZ < −2. Estimates on the left part of the axis suggest a higher mortality in older children, and estimates on the right part of the axis suggest a higher mortality among younger children.
Figure 2
Figure 2
Forest plots for pooled risk ratios of mortality in children 6–23 months versus 24–59 months for MUAC < 125 mm WHZ < −2, WAZ < −2 and HAZ < −2. (a) Mortality risk ratio between younger and older (reference group) age group for MUAC < 125 mm. (b) Mortality risk ratio between younger and older (reference group) age group for WHZ < −2. (c) Mortality risk ratio between younger and older (reference group) age group for WAZ < −2. (d) Mortality risk ratio between younger and older (reference group) age group for HAZ < −2. Estimates on the left part of the axis suggest a higher mortality in older children, and estimates on the right part of the axis suggest a higher mortality among younger children.
Figure 3
Figure 3
Forest plots for pooled risk ratios of absolute risk in children 6–23 months versus 24–59 months by sex for MUAC, WHZ, WAZ and HAZ. (a) Mortality risk ratio between younger boys and girls (reference group) for MUAC < 125 mm. (b) Mortality risk ratio between older boys and girls (reference group) for MUAC < 125 mm. (c) Mortality risk ratio between younger boys and girls (reference group) for WHZ < −2. (d) Mortality risk ratio between older boys and girls (reference group) for WHZ < −2. (e) Mortality risk ratio between younger boys and girls (reference group) for WAZ < −2. (f) Mortality risk ratio between older boys and girls (reference group) for WAZ < −2. (g) Mortality risk ratio between younger boys and girls (reference group) for HAZ < −2. (h) Mortality risk ratio between older boys and girls (reference group) for HAZ < −2. Estimates on the left part of the axis suggest a higher mortality in girls, and estimates on the right part of the axis suggest a higher mortality among boys.
Figure 3
Figure 3
Forest plots for pooled risk ratios of absolute risk in children 6–23 months versus 24–59 months by sex for MUAC, WHZ, WAZ and HAZ. (a) Mortality risk ratio between younger boys and girls (reference group) for MUAC < 125 mm. (b) Mortality risk ratio between older boys and girls (reference group) for MUAC < 125 mm. (c) Mortality risk ratio between younger boys and girls (reference group) for WHZ < −2. (d) Mortality risk ratio between older boys and girls (reference group) for WHZ < −2. (e) Mortality risk ratio between younger boys and girls (reference group) for WAZ < −2. (f) Mortality risk ratio between older boys and girls (reference group) for WAZ < −2. (g) Mortality risk ratio between younger boys and girls (reference group) for HAZ < −2. (h) Mortality risk ratio between older boys and girls (reference group) for HAZ < −2. Estimates on the left part of the axis suggest a higher mortality in girls, and estimates on the right part of the axis suggest a higher mortality among boys.

References

    1. Adair, L. , Popkin, B. M. , VanDerslice, J. , Akin, J. , Guilkey, D. , Black, R. , Briscoe, J. , & Flieger, W. (1993). Growth dynamics during the first two years of life: A prospective study in the Philippines. European Journal of Clinical Nutrition, 47, 42–51. - PubMed
    1. Arifeen, S. , Black, R. E. , Antelman, G. , Baqui, A. , Caulfield, L. , & Becker, S. (2001). Exclusive breastfeeding reduces acute respiratory infection and diarrhea deaths among infants in Dhaka slums. Pediatrics, 108, E67. - PubMed
    1. Blössner, M. , Siyam, A. , Borghi, E. , Onyango, A. , & de Onis, M. (2009). WHO AnthroPlus for personal computers manual: software for assessing growth of the world's children and adolescents. World Health Organization.
    1. Van Den Broeck, J. , Eeckels, R. , & Vuylsteke, J. (1993). Influence of nutritional status on child mortality in rural Zaire. Lancet, 341, 1491–1495. - PubMed
    1. Costa, J. C. , Blumenberg, C. , & Victora, C. (2021). Growth patterns by sex and age among under‐5 children from 87 low‐income and middle‐income countries. BMJ Global Health, 60, 6. - PMC - PubMed

Publication types