. 2022 Dec;11(12):1578-1591.
doi: 10.1002/psp4.12862. Epub 2022 Sep 27.

Population pharmacokinetic-pharmacodynamic analyses of amyloid positron emission tomography and plasma biomarkers for lecanemab in subjects with early Alzheimer's disease

Affiliations

Population pharmacokinetic-pharmacodynamic analyses of amyloid positron emission tomography and plasma biomarkers for lecanemab in subjects with early Alzheimer's disease

Seiichi Hayato et al. CPT Pharmacometrics Syst Pharmacol. 2022 Dec.

Abstract

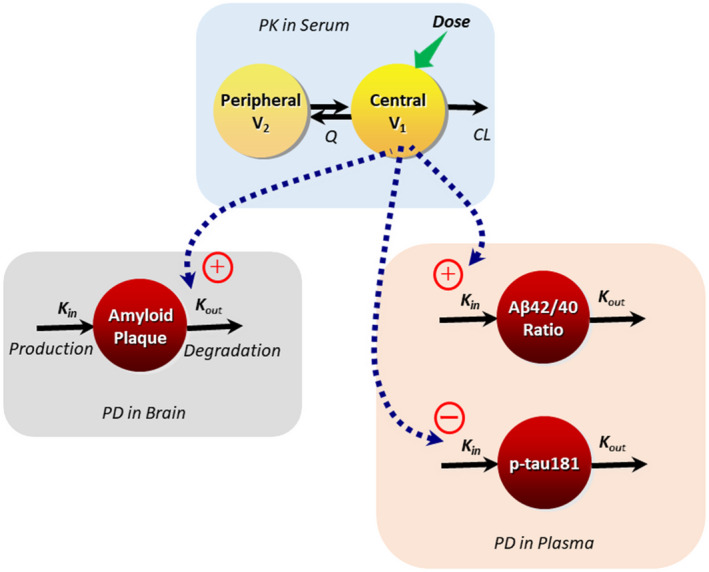
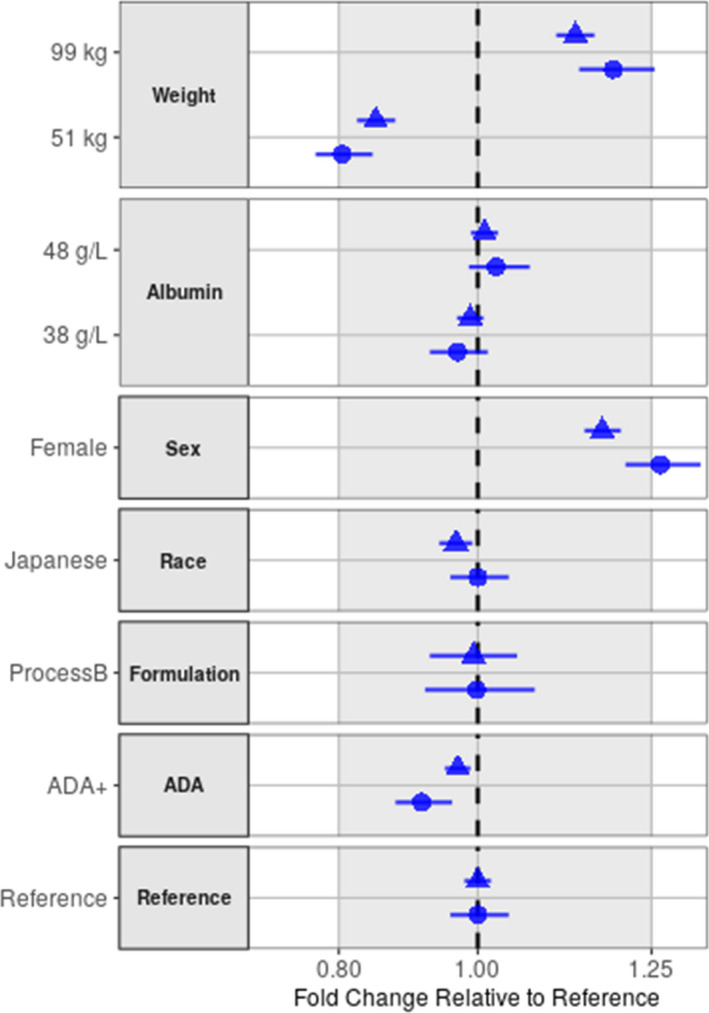
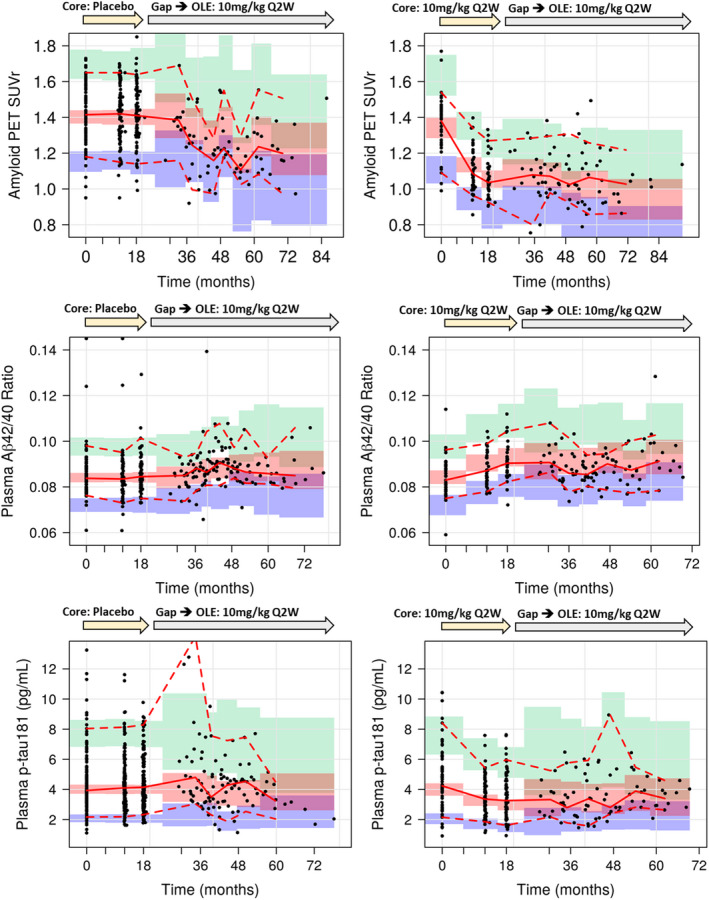
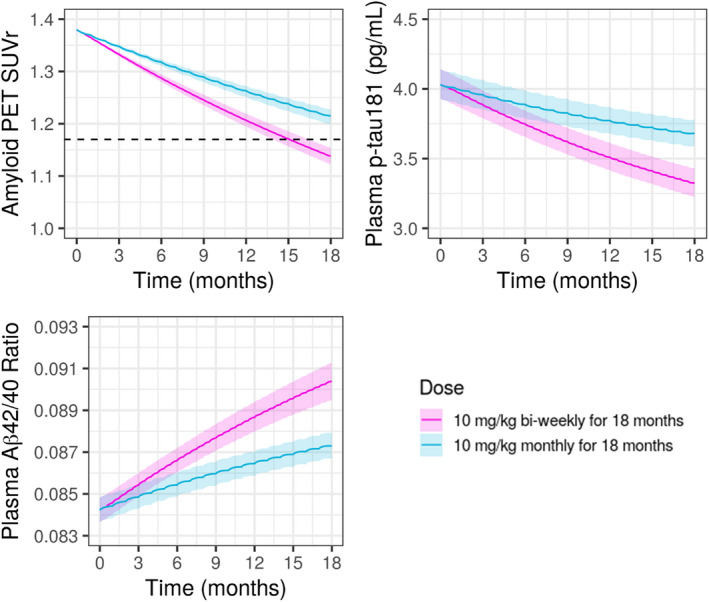
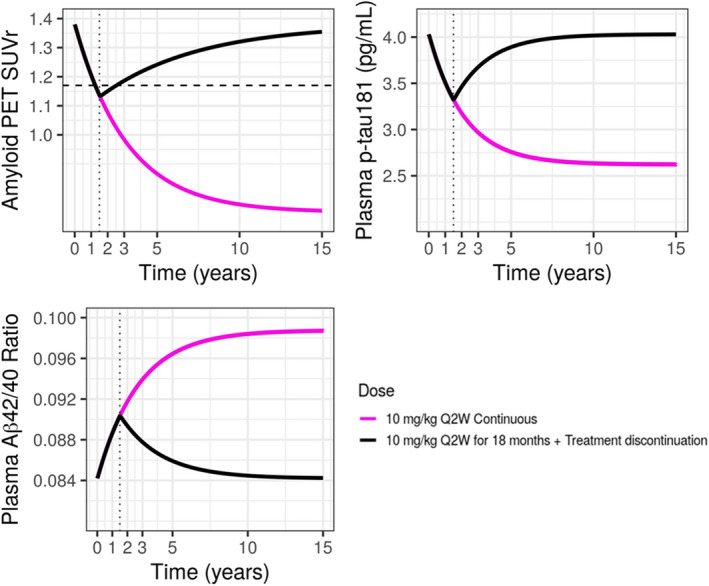
Lecanemab is a humanized immunoglobulin G1 monoclonal antibody that selectively binds to soluble Aβ aggregate species, while demonstrating low affinity for Aβ monomer. This article describes the population pharmacokinetic (PK) and PK/pharmacodynamic (PD) analyses for amyloid plaques, as measured using positron emission tomography (PET), and biomarkers of amyloid pathology as evidenced by Aβ42/40 ratio and plasma p-tau181 following i.v. administration of lecanemab in subjects with early Alzheimer's disease. Lecanemab PKs were well-characterized with a two-compartment model with first-order elimination. Final PK model contained covariate effects of anti-drug antibody positive status, sex, body weight, and albumin on clearance. The time course of amyloid PET standard uptake ratio (SUVr), plasma Aβ42/40 ratio, and p-tau181 were described using indirect response models with lecanemab exposure as a maximum effect function stimulating the reduction of SUVr, and as a linear function increasing Aβ42/40 ratio and decreasing p-tau181 formation rates. PK/PD simulations show that 10 mg/kg biweekly dosing results in larger and faster decrease in SUVr and p-tau181 and increase in Aβ42/40 ratio as compared to 10 mg/kg monthly dose. Furthermore, the PK/PD simulations showed that after treatment discontinuation the brain amyloid re-accumulation to baseline levels is slow with a recovery half-life of ~4 years, whereas plasma Aβ42/40 ratio and p-tau181 return to baseline levels faster than amyloid. Given the relationship between changes in amyloid PET SUVr and soluble biomarkers, the developed PK/PD models can be used to inform lecanemab dose regimens in future clinical studies.


Conflict of interest statement

S.H., O.T., A.K., and S.Y. are employees of Eisai Co., Ltd. S.R., I.L., C.S., and L.R. are employees of Eisai Inc. Z.H. is an employee of Eisai Ltd.

Figures

FIGURE 1
FIGURE 1
Schematic of the population PK and PK/PD models for lecanemab. CL, clearance; K in, zero‐order rate constant for production of biomarker; K out, first‐order rate constant of degradation of biomarker; PD, pharmacodynamic; PK, pharmacokinetic; Q, intercompartmental clearance; V 1, central volume of distribution; V 2, peripheral volume of distribution. The equation for standard uptake ratio (SUVr) PK/PD model is presented below: dSUVrdt=KinSUVrtKout1+EmaxConcEC50+Conc Estimated parameters included baseline SUVr, the zero‐order production rate constant of amyloid plaque (K in), maximum exposure effect (E max), and lecanemab concentration resulting in half of the maximum drug effect (EC50), where K out = K in/baseline. The equations for Aβ42/40 ratio and p‐tau181 models are presented below: 42/40ratio:dRdt=Kin1+SlopeConcRtKout ptau181:dRdt=Kin1SlopeConcRtKout For both Aβ42/40 ratio and p‐tau181 estimated parameters included baseline, first order degradation rate constant of biomarker (K out) and slope for exposure effect, where K in = K out * baseline.
FIGURE 2
FIGURE 2
Effect of covariates on lecanemab AUC and C max at steady‐state after 10 mg/kg biweekly. Covariate effects are expressed as lecanemab exposures at steady‐state relative to a reference subject. Body weight and albumin test categories (51 and 99 kg for body weight, 38 and 48 g/L for albumin) represent the 5% and 95% percentiles of PK analysis set, respectively. Plot displays relative change in a parameter with uncertainty as 90% CIs for each covariate relative to the reference 73.4 kg male, non‐Japanese subject who was administered process A formulation and is ADA negative. Filled circle and triangle: median of AUC and C max, horizontal line: 90% CI, gray area: acceptance interval (0.80–1.25), vertical dashed line: reference. ADA, anti‐drug antibody; AUC, area under the curve; CI, confidence interval; Cmax, maximum concentration; PK, pharmacokinetic.
FIGURE 3
FIGURE 3
Prediction‐corrected visual predictive check plots for PK/PD models for PET SUVr and plasma Aβ42/40 ratio and p‐tau181 (left: core placebo, right: core 10 mg/kg biweekly). Black solid line: predicted median, black dashed line: predicted 5th and 95th percentiles, red solid line: observed median, red dashed line: observed 5th and 95th percentiles, green area: 95% CI for predicted 95th percentile, red area: 95% CI for predicted median, blue area: 95% CI for predicted 5th percentile. CI, confidence interval; OLE, open‐label extension; PD, pharmacodynamic; PET, positron emission tomography; PK, pharmacokinetic; SUVr, standard uptake ratio.
FIGURE 4
FIGURE 4
Model‐predicted SUVr and plasma Aβ42/40 ratio and p‐tau181 following 18 months treatment with lecanemab at 10 mg/kg biweekly or 10 mg/kg monthly. Black dashed line in SUVr plot represents SUVr = 1.17, indicating amyloid negative line. For SUVr, baseline SUVr = 1.38 (median of Study 201) was assumed. Pink solid line and shaded area: predicted median and 95% CI for 10 mg/kg biweekly, blue solid line and shaded area: predicted median and 95% CI for 10 mg/kg monthly. CI, confidence interval; PET, positron emission tomography; SUVr, standard uptake ratio.
FIGURE 5
FIGURE 5
Model‐predicted SUVr and plasma Aβ42/40 ratio and p‐tau181 following continuous 10 mg/kg biweekly with or without treatment discontinuation. Black horizontal dashed line in SUVr plot represents SUVr = 1.17, indicating amyloid negative line. Black vertical dotted lines represent time = 1.5 years (18 months). Pink solid line: continuous 10 mg/kg biweekly for 15 years, black solid line: 10 mg/kg biweekly for 18 months followed by treatment discontinuation. PET, positron emission tomography; SUVr, standard uptake ratio.

Similar articles

Cited by

References

    1. Alzheimer's Association . Alzheimer's disease facts and figures; 2021. Available from: https://www.alz.org/media/Documents/alzheimers‐facts‐and‐figures.pdf
    1. Elias‐Sonnenschein LS, Viechtbauer W, Ramakers IH, et al. Predictive value of APOE‐ε4 allele for progression from MCI to AD‐type dementia: a meta‐analysis. J Neurol Neurosurg Psychiatry. 2011;82:1149‐1156. doi:10.1136/jnnp.2010.231555 - DOI - PubMed
    1. Mattsson N, Groot C, Jansen WJ, et al. Prevalence of the apolipoprotein E ε4 allele in amyloid β positive subjects across the spectrum of Alzheimer's disease. Alzheimers Dement. 2018;14:913‐924. doi:10.1016/j.jalz.2018.02.009 - DOI - PubMed
    1. Jack CR, Knopman DS, Jagust WJ, et al. Tracking pathophysiological processes in Alzheimer's disease: an updated hypothetical model of dynamic biomarkers. Lancet Neurol. 2013;12:207‐216. doi:10.1016/S1474-4422(12)70291-0 - DOI - PMC - PubMed
    1. Delacourte A, Sergeant N, Champain D, et al. Nonoverlapping but synergetic tau and APP pathologies in sporadic Alzheimer's disease. Neurology. 2002;59:398‐407. doi:10.1212/wnl.59.3.398 - DOI - PubMed

Publication types

MeSH terms