. 2022 Oct 1;209(7):1272-1285.
doi: 10.4049/jimmunol.2100737. Epub 2022 Aug 31.

Transcriptomic Profiling Identifies CD8+ T Cells in the Brain of Aged and Alzheimer's Disease Transgenic Mice as Tissue-Resident Memory T Cells

Affiliations

Transcriptomic Profiling Identifies CD8+ T Cells in the Brain of Aged and Alzheimer's Disease Transgenic Mice as Tissue-Resident Memory T Cells

Barbara Altendorfer et al. J Immunol. .

Abstract

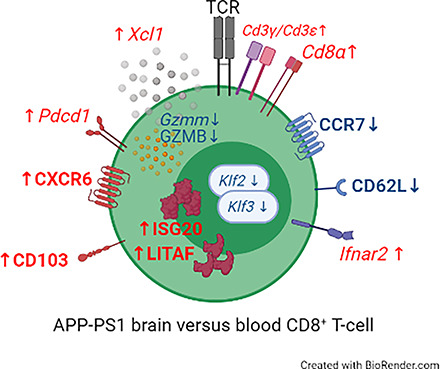
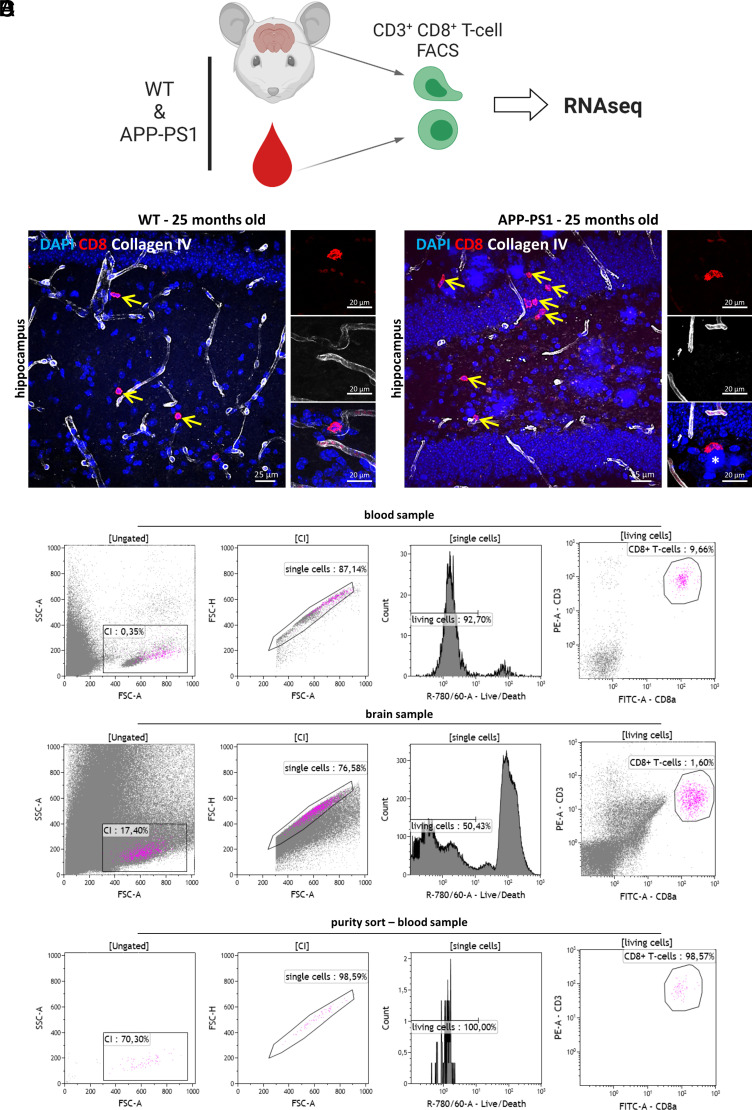
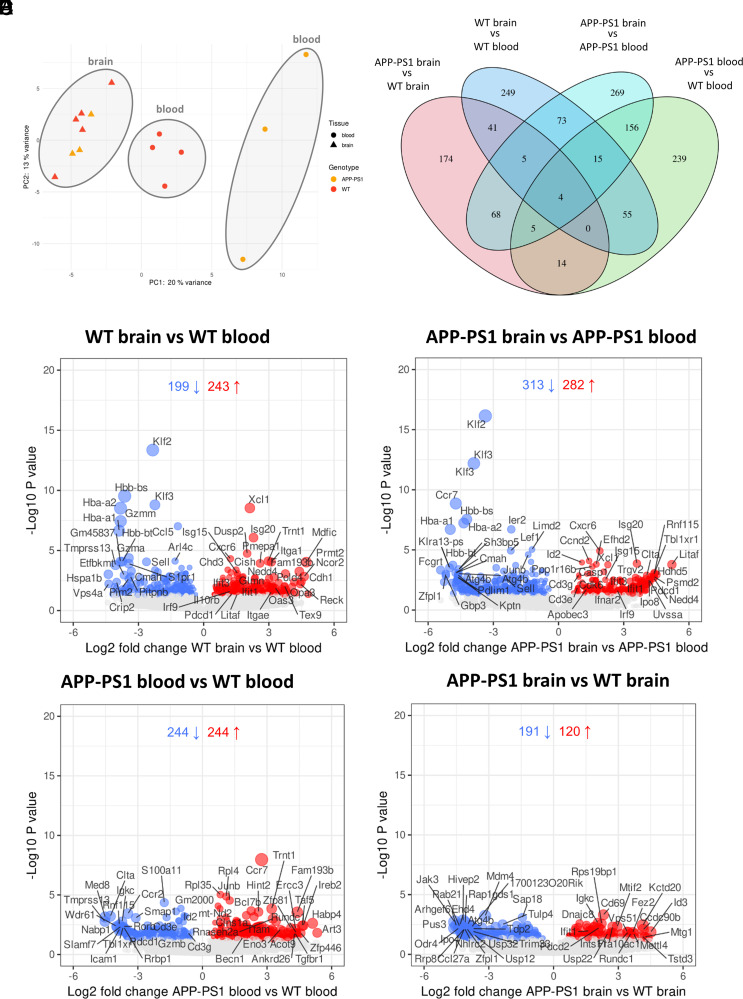
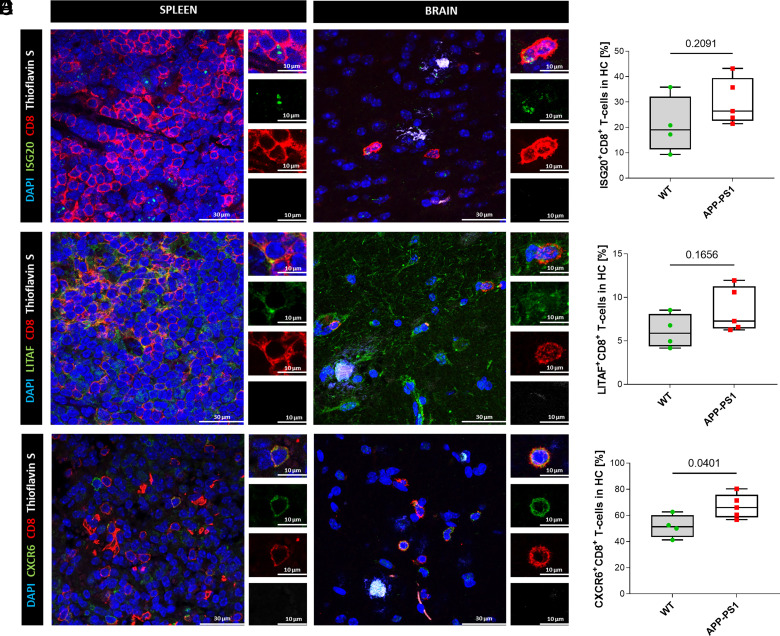
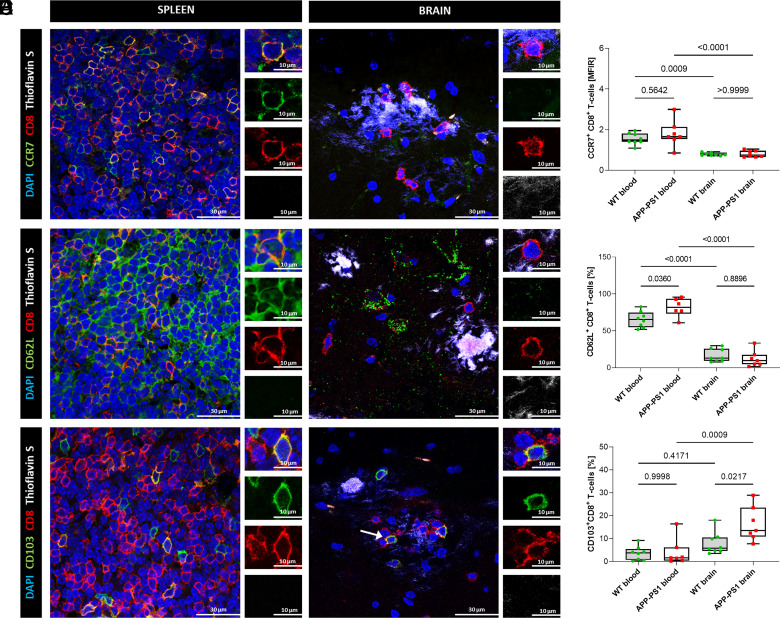
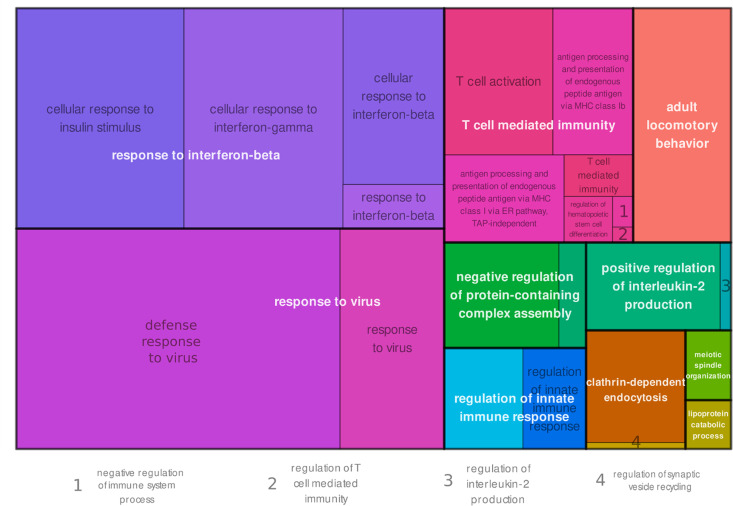
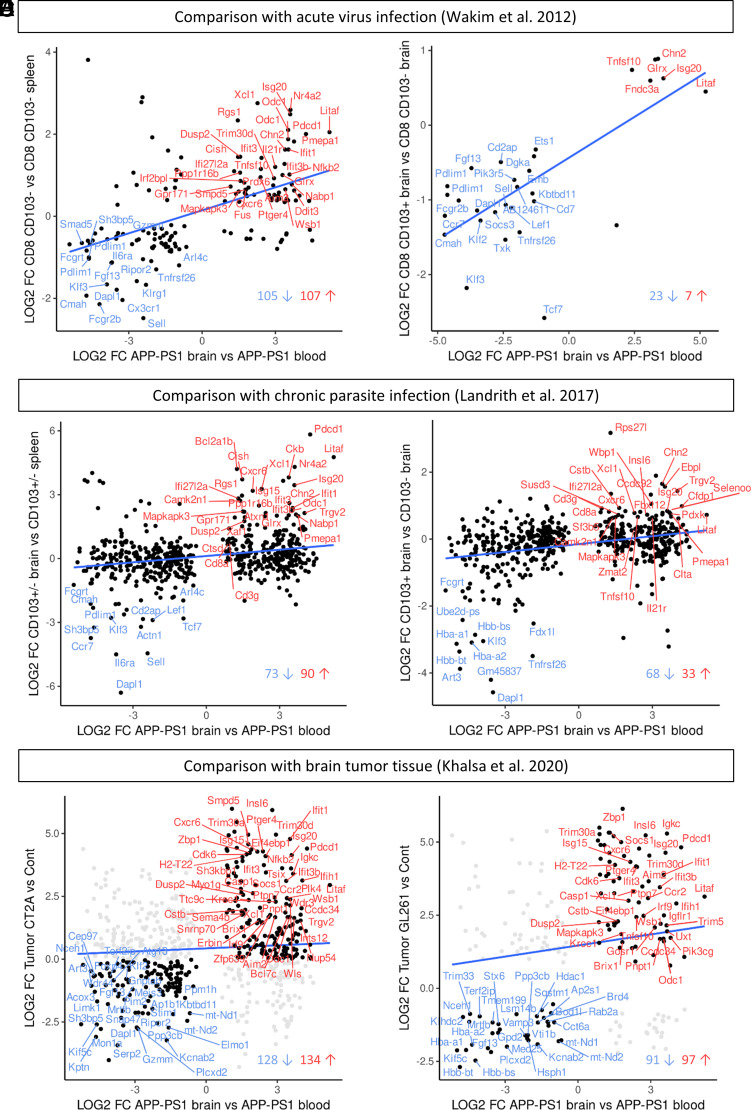
Peripheral immune cell infiltration into the brain is a prominent feature in aging and various neurodegenerative diseases such as Alzheimer's disease (AD). As AD progresses, CD8+ T cells infiltrate into the brain parenchyma, where they tightly associate with neurons and microglia. The functional properties of CD8+ T cells in the brain are largely unknown. To gain further insights into the putative functions of CD8+ T cells in the brain, we explored and compared the transcriptomic profile of CD8+ T cells isolated from the brain and blood of transgenic AD (APPswe/PSEN1dE9, line 85 [APP-PS1]) and age-matched wild-type (WT) mice. Brain CD8+ T cells of APP-PS1 and WT animals had similar transcriptomic profiles and substantially differed from blood circulating CD8+ T cells. The gene signature of brain CD8+ T cells identified them as tissue-resident memory (Trm) T cells. Gene Ontology enrichment and Kyoto Encyclopedia of Genes and Genomes pathway analysis on the significantly upregulated genes revealed overrepresentation of biological processes involved in IFN-β signaling and the response to viral infections. Furthermore, brain CD8+ T cells of APP-PS1 and aged WT mice showed similar differentially regulated genes as brain Trm CD8+ T cells in mouse models with acute virus infection, chronic parasite infection, and tumor growth. In conclusion, our profiling of brain CD8+ T cells suggests that in AD, these cells exhibit similar adaptive immune responses as in other inflammatory diseases of the CNS, potentially opening the door for immunotherapy in AD.


Conflict of interest statement

The authors have no financial conflicts of interest.

Figures

None
Graphical abstract
FIGURE 1.
FIGURE 1.
Isolation of blood and brain CD8+ T cells. (A) Experimental setup. CD3+ CD8+ T cells were isolated from the brain and blood of WT and APP-PS1 mice using FACS and subsequently profiled using mRNA-seq analysis. The image was created with BioRender.com. (B and C) Representative immunohistochemistry images of CD8 (red)- and collagen IV (white)–stained hippocampus brain sections of WT (B) and APP-PS1 mice (C). CD8+ T cells were identified directly in the brain parenchyma (yellow arrows). (D) Representative plots of FACS gating strategy: single, living CD3+CD8+ T cells were isolated from the blood and brain homogenates. Sort purity was regularly analyzed. Scale bars, 25 µm (A, B), 20 µm in inserts (A, B).
FIGURE 2.
FIGURE 2.
Results of the mRNA-seq analysis from brain- and blood-isolated CD8+ T cells. (A) Principal component analysis of brain and blood samples from WT and APP-PS1 mice (n = 3–5/group). (B) Venn diagram with numbers of significantly regulated genes in all four comparisons. (CF) Volcano plots showing significantly regulated genes for the comparisons (C) WT brain versus WT blood, (D) APP-PS1 brain versus APP-PS1 blood, (E) APP-PS1 blood versus WT blood, and (F) APP-PS1 brain versus WT brain. Genes with a p value <0.05 were considered as significantly differentially expressed (blue indicates downregulated, red indicates upregulated). PC2, second principal component.
FIGURE 3.
FIGURE 3.
Immunohistochemistry staining and quantitative colocalization analysis of hippocampal CD8+ T cells. (A, C, and E) Representative images of hippocampal CD8+ T cells of APP-PS1 mice. Spleen tissue was used as positive control for Ab stainings. DAPI (blue) was used as a nucleus stain and thioflavin S (white) was used to visualize amyloid plaques. Scale bars, 30 µm, inserts 10 µm. (B, D, and F) Quantitative analysis of ISG20, LITAF, and CXCR6 coexpression on CD8+ T cells in the hippocampal region of WT and APP-PS1 mice (n = 4–5). Statistical differences between two groups were assessed via a Student t test. A p value <0.05 was considered statistically significant.
FIGURE 4.
FIGURE 4.
Immunohistochemistry staining and flow cytometry analysis of blood and brain CD8+ T cells. (A, C, and E) Representative images of hippocampal CD8+ T cells of APP-PS1 mice. Spleen tissue was used as a positive control for Ab stainings. DAPI (blue) was used as a nucleus stain and thioflavin S (white) was used to visualize amyloid plaques. Scale bars, 30 µm, inserts 10 µm. (B, D, and F) Flow cytometry analysis of CCR7, CD62L, and CD103 coexpression on CD8+ T cells in blood and brain of WT and APP-PS1 mice (n = 7–8). Statistical differences between the groups were identified via an ordinary one-way ANOVA, followed by Šídák’s multiple comparisons test. A p value <0.05 was considered statistically significant.
FIGURE 5.
FIGURE 5.
GO enrichment analysis. Overrepresented GO terms for biological processes of significantly upregulated genes in CD8+ T cells from APP-PS1 brain versus APP-PS1 blood samples. All genes with a p value <0.05 were selected for GO enrichment analysis.
FIGURE 6.
FIGURE 6.
Comparisons with transcriptomic data of different brain inflammation models. (A and B) Comparison with gene microarray data from brain CD8+ T cells of virus-infected mice (Wakim et al. [47]). (A) Significantly DEGs that are shared in APP-PS1 brain CD8+ T cells and brain CD8+ T cells (CD103+ and CD103) from an acute virus infection mouse model. (B) Significantly DEGs that are shared in APP-PS1 brain CD8+ T cells and brain CD103+ CD8+ Trm T cells from the virus infection mouse model. The overlapping genes belong to the top regulated genes in the Wakim et al. data and included the genes Klf2, Sell, Cxcr6, Isg20, and Litaf. (C and D) Comparison with transcriptomic data of brain CD8+ T cells of a chronic parasite infection mouse model (Landrith et al. [48]). (C) Significantly DEGs that are shared in APP-PS1 brain CD8+ T cells and brain CD8+ T cells (CD103+ and CD103) from a chronic parasite infection mouse model. (D) Significantly DEGs that are shared in APP-PS1 brain CD8+ T cells and brain CD103+CD8+ Trm T cells from the parasite infection mouse model. The overlapping genes included Klf2, Sell, Litaf, Cxcr6, and Isg20. (E and F) Comparison with the transcriptomic immune profile of brain tumor (glioblastoma) tissue (Khalsa et al. [49]). (E) Shared DEGs between APP-PS1 brain CD8+ T cells and the immunological inert tumor CT2A. (F) Shared DEGs between APP-PS1 brain CD8+ T cells and the immunological more active tumor GL261. The overlapping genes included Pdcd1, Isg20, Litaf, and Cxcr6 for both tumor types.

References

    1. Querfurth H. W., LaFerla F. M.. 2010. Alzheimer’s disease. N. Engl. J. Med. 362: 329–344. - PubMed
    1. Goedert M., Spillantini M. G.. 2006. A century of Alzheimer’s disease. Science 314: 777–781. - PubMed
    1. Reitz C., Mayeux R.. 2014. Alzheimer disease: epidemiology, diagnostic criteria, risk factors and biomarkers. Biochem. Pharmacol. 88: 640–651. - PMC - PubMed
    1. Brookmeyer R., Johnson E., Ziegler-Graham K., Arrighi H. M.. 2007. Forecasting the global burden of Alzheimer’s disease. Alzheimers Dement. 3: 186–191. - PubMed
    1. Alzheimer’s Association . 2015. 2015 Alzheimer’s disease facts and figures. Alzheimers Dement. 11: 332–384. - PubMed

Publication types

Substances