Review
. 2023 Feb;57(2):370-386.
doi: 10.1002/jmri.28431. Epub 2022 Sep 27.

Breast PET/MRI Hybrid Imaging and Targeted Tracers

Affiliations
Review

Breast PET/MRI Hybrid Imaging and Targeted Tracers

Valeria Romeo et al. J Magn Reson Imaging. 2023 Feb.

Abstract

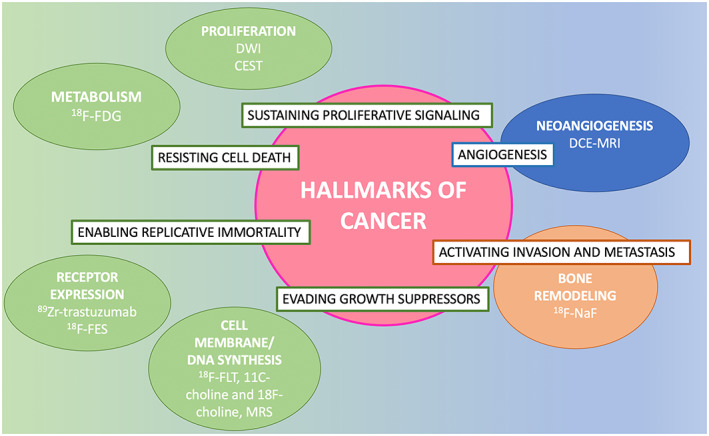
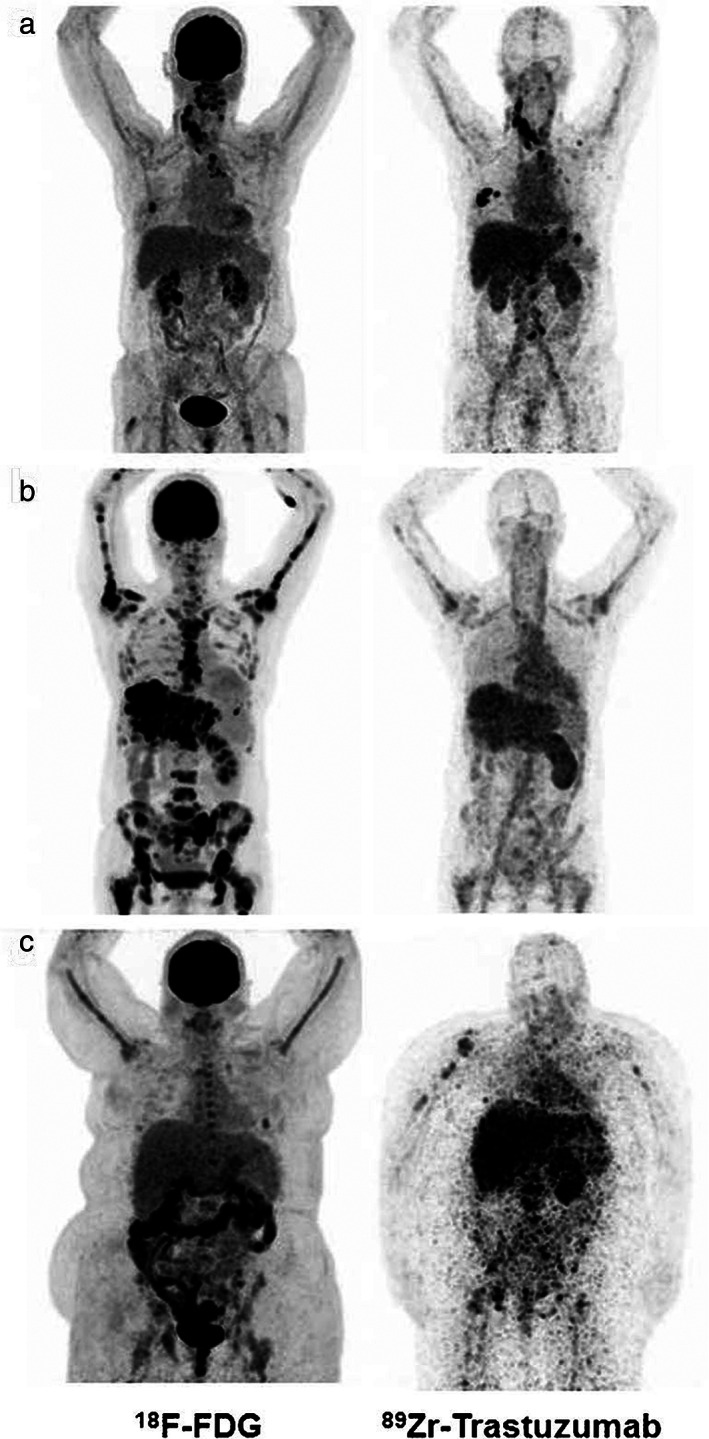
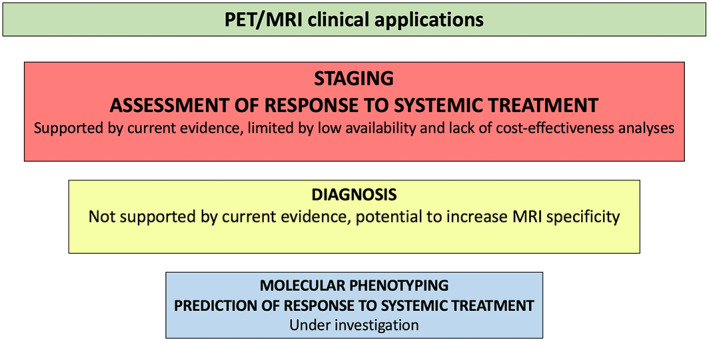
The recent introduction of hybrid positron emission tomography/magnetic resonance imaging (PET/MRI) as a promising imaging modality for breast cancer assessment has prompted fervent research activity on its clinical applications. The current knowledge regarding the possible clinical applications of hybrid PET/MRI is constantly evolving, thanks to the development and clinical availability of hybrid scanners, the development of new PET tracers and the rise of artificial intelligence (AI) techniques. In this state-of-the-art review on the use of hybrid breast PET/MRI, the most promising advanced MRI techniques (diffusion-weighted imaging, dynamic contrast-enhanced MRI, magnetic resonance spectroscopy, and chemical exchange saturation transfer) are discussed. Current and experimental PET tracers (18 F-FDG, 18 F-NaF, choline, 18 F-FES, 18 F-FES, 89 Zr-trastuzumab, choline derivatives, 18 F-FLT, and 68 Ga-FAPI-46) are described in order to provide an overview on their molecular mechanisms of action and corresponding clinical applications. New perspectives represented by the use of radiomics and AI techniques are discussed. Furthermore, the current strengths and limitations of hybrid PET/MRI in the real world are highlighted. EVIDENCE LEVEL: 2 TECHNICAL EFFICACY: Stage 2.

Keywords: breast cancer; magnetic resonance imaging; positron emission tomography.


Conflict of interest statement

Katja Pinker received payment for activities not related to the present article including lectures and service on speakers bureaus and for travel/accommodations/meeting expenses unrelated to activities listed from the European Society of Breast Imaging (MRI educational course, annual scientific meeting), the IDKD 2019 (educational course), and Siemens Healthineers. At the time of the writing of this article, Katja Pinker was also a consultant for Genentech Inc., Merantix Healthcare, and AURA Health Technologies GmbH. Thomas H. Helbich received payment for activities not related to the present article including lectures and service on speakers bureaus and for travel/accommodations/meeting expenses unrelated to activities listed from the European Society of Breast Imaging, the IDKD 2019 (educational course), and Siemens Healthineers, Guerbet, Novomed.

Figures

FIGURE 1
FIGURE 1
Hallmarks of cancer with corresponding PET and MRI biomarkers.
FIGURE 2
FIGURE 2
An example of multiparametric imaging obtained using hybrid 18F‐FDG PET/MRI. A 56‐year‐old woman with invasive ductal breast cancer (G3, triple negative) in the right breast associated with pectoral muscle infiltration and skin thickening, shown on axial (a) fat‐saturated T2‐weighted turbo spin‐echo imaging, (b) diffusion‐weighted echo‐planar imaging and (c) apparent diffusion coefficient mapping, (d) contrast‐enhanced T1‐weighted imaging, (e) PET imaging, and (f) fused PET/MRI imaging.
FIGURE 3
FIGURE 3
Axial (a) subtracted dynamic contrast‐enhanced (DCE)‐MRI, (b) PET, and (c) fused DCE‐MRI and PET imaging. A 66‐year‐old patient with invasive ductal breast cancer (9 mm, G3, ER/PgR−, HER2+) of the left breast (arrows in ac).
FIGURE 4
FIGURE 4
Axial (a) T2‐weighted, (b) fused T2‐weighted and PET, (c) subtracted DCE‐MRI, and (d) fused DCE‐MRI and PET imaging. A heterogeneous axillary metastasis (arrows in a and b) and a rib bone metastasis (arrows in c and d) are detectable in a 66‐year‐old patient with invasive ductal breast cancer (G3, ER/PgR−, HER2+) of the left breast (same patient as Fig. 3).
FIGURE 5
FIGURE 5
(a and b) Fused PET and post‐contrast fat‐saturated T1‐weighted imaging on the coronal plane (whole‐body examination) shows liver and axillary involvement (green and yellow arrows in a, respectively) as well as rib and lumbo‐sacral bone metastases (white arrows in a and b, respectively) in in a 66‐year‐old patient with invasive ductal breast cancer (G3, ER/PgR−, HER2+) in the left breast (same patient as the patient in Figs. 3 and 4).
FIGURE 6
FIGURE 6
Illustration of breast and whole‐body hybrid PET/MRI acquisition protocols.
FIGURE 7
FIGURE 7
(a) T2 weighted MR image of a patient suffering from locally advanced breast cancer while (b) shows the in vivo 1H MR spectrum acquired without water and fat suppression from the VOI shown in (a). (c) MR spectrum obtained from the same voxel with water + fat suppression. VOI, volume of interest. Reprinted under a Creative Commons (CC BY 4.0) license from: Sharma U, Jagannathan NR. In vivo MR spectroscopy for breast cancer diagnosis. BJR Open. 2019;1(1):20180040. doi: 10.1259/bjro.20180040. PMID: 33178927; PMCID: PMC7592438.
FIGURE 8
FIGURE 8
(a) Diagram illustrating the process of chemical exchange saturation transfer (CEST): in a solute, the small quantity of chemical substance containing an amine group (‐NH) is saturated by a RF, which initially reduces the signal of the substance (shown as the hollow bar); then, the saturated hydrogen proton is transferred to water in return for an unsaturated hydrogen; this process continues that leads to amplified water signal reduction (assumes that the saturation level on the chemical substance itself remains unchanged). This process will continue subject to the T1 relaxation and back exchange. (b) Comparison between conventional T2‐weighted image and CEST at 4.2 ppm: only Ultravist (Iopromide solution) and egg white yielded CEST contrast. Reprinted under a Creative Commons (CC BY 4.0) license from: Wu B, Warnock G, Zaiss M, Lin C, Chen M, Zhou Z, Mu L, Nanz D, Tuura R, Delso G. An overview of CEST MRI for non‐MR physicists. EJNMMI Phys. 2016;3(1):19.
FIGURE 9
FIGURE 9
18F‐FDG (left) and 89Zr‐trastuzumab PET scans (right) of three patients: Example of a patient with a 89Zr‐trastuzumab PET scan considered HER2‐positive (a), a 89Zr‐trastuzumab PET scan considered HER2‐negative (b), and an 89Zr‐trastuzumab PET scan considered equivocal (c). Reprinted under a Creative Commons (CC BY 4.0) license from: Bensch F, Brouwers AH, Lub‐de Hooge MN, de Jong JR, van der Vegt B, Sleijfer S, de Vries EGE, Schröder CP. 89Zr‐trastuzumab PET supports clinical decision making in breast cancer patients, when HER2 status cannot be determined by standard work up. Eur J Nucl Med Mol Imaging. 2018;45(13):2300–2306.
FIGURE 10
FIGURE 10
(a) Baseline PET/CT images obtained in a Biograph Duo LSO (Siemens) 75 minutes after injection of 405 MBq of 18FLT in a 47‐year‐old woman with a right‐sided infiltrating ductal carcinoma (SUVmax = 5.42) (arrow) and lymph node uptake (SUVmax = 1.85) (arrowhead). Physiological bone marrow uptake was identified. (b) PET/CT images obtained 75 minutes after injection of 529 MBq of 18FLT after one cycle of neoadjuvant therapy. SUVmax decreased to 3.57 in the primary tumor and to 0.80 in the lymph node, consistent with metabolic response. Reprinted under a Creative Commons (CC BY 4.0) license from: Peñuelas I, Domínguez‐Prado I, García‐Velloso MJ, Martí‐Climent JM, Rodríguez‐Fraile M, Caicedo C, Sánchez‐Martínez M, Richter JA. PET Tracers for Clinical Imaging of Breast Cancer. J Oncol. 2012;2012:710561.
FIGURE 11
FIGURE 11
Clinical applications of hybrid PET/MRI in breast cancer in relation to their current evidence‐based status.
FIGURE 12
FIGURE 12
Images of a patient with no lymph nodes suspicious for metastases on MRI (T2w sequence is shown in the left column) and five axillary FDG hotspots suspicious for lymph node metastases on PET (small arrows, middle column). Adding PET information to MRI, resulted in five lymph nodes marked as suspicious for metastases (big arrows, right column). Reprinted under a Creative Commons (CC BY 4.0) license from: Goorts B, Vöö S, van Nijnatten TJA, Kooreman LFS, de Boer M, Keymeulen KBMI, Aarnoutse R, Wildberger JE, Mottaghy FM, Lobbes MBI, Smidt ML. Hybrid 18F‐FDG PET/MRI might improve locoregional staging of breast cancer patients prior to neoadjuvant chemotherapy. Eur J Nucl Med Mol Imaging. 2017;44(11):1796–1805.
FIGURE 13
FIGURE 13
Example of early assessment of the response to neoadjuvant chemotherapy (NAC) using diffusion weighted imaging (DWI). examinations; (ac) = pre‐NAC examinations; (df) = early assessment examination after two cycles of cytotoxic NAC. (a and d) = dynamic post‐contrast images; (b and e) = DWI images; (c and f) = ADC maps. A 37‐year‐old patient with a G3, triple negative invasive ductal carcinoma of the right breast (white and black arrows). Early assessment showed a reduction of tumor size along with increase of signal intensity on ADC maps (c) compared to the pre‐treatment examination (f). Pathology after surgical resection revealed pathological complete response. Reprinted under a Creative Commons (CC BY 4.0) license from: Romeo V, Accardo G, Perillo T, Basso L, Garbino N, Nicolai E, Maurea S, Salvatore M. Assessment and Prediction of Response to Neoadjuvant Chemotherapy in Breast Cancer: A Comparison of Imaging Modalities and Future Perspectives. Cancers (Basel). 2021;13(14):3521.
FIGURE 14
FIGURE 14
Example of early assessment of the response to NAC using dynamic contrast‐enhanced imaging (DCE‐MRI). 37‐year‐old patient with a G3, triple negative invasive ductal carcinoma of the right breast (arrows, same case shown in Figure 4). (ac) = pre‐NAC examinations; (df) = early assessment examination after two cycles of cytotoxic NAC. Ktrans (a and d), Kep (b and e), and Ve (c and f) maps. Early assessment showed a reduction of Ktrans (286 vs. 83.9 min−1) and kep (91.49 vs. 20.14 min−1 × 100) with a slight increase of Ve (275.34 vs. 308.08 × 1000) signal intensity on ADC maps (c) compared to the pre‐treatment examination (f). Pathological complete response was proved at pathology examination after surgical resection. Reprinted under a Creative Commons (CC BY 4.0) license from: Romeo V, Accardo G, Perillo T, Basso L, Garbino N, Nicolai E, Maurea S, Salvatore M. Assessment and Prediction of Response to Neoadjuvant Chemotherapy in Breast Cancer: A Comparison of Imaging Modalities and Future Perspectives. Cancers (Basel). 2021;13(14):3521.
FIGURE 15
FIGURE 15
A 36‐year‐old patient with left breast cancer undergoing NAC. Fused PET/MRI images acquired before (a), during (b), and after (c) NAC are shown. While a slight reduction of the tumor and its satellite nodule (white arrows in b) is appreciable, 18FFDG uptake is significantly reduced after the second cycle of chemotherapy (b) as compared to the pre‐treatment evaluation (a). The tumor was not detectable at the post‐treatment evaluation (c). Pathology after surgery demonstrated a complete response. Reprinted under a Creative Commons (CC BY 4.0) license from: Romeo V, Accardo G, Perillo T, Basso L, Garbino N, Nicolai E, Maurea S, Salvatore M. Assessment and Prediction of Response to Neoadjuvant Chemotherapy in Breast Cancer: A Comparison of Imaging Modalities and Future Perspectives. Cancers (Basel). 2021;13(14):3521.

References

    1. Hanahan D, Weinberg RA. Hallmarks of cancer: The next generation. Cell 2011;144:646‐674. - PubMed
    1. Hanahan D, Weinberg RA. The hallmarks of cancer. Cell 2000;100:57‐70. - PubMed
    1. Turashvili G, Brogi E. Tumor heterogeneity in breast cancer. Front Med 2017;4:227. - PMC - PubMed
    1. Mann RM, Cho N, Moy L. Breast MRI: State of the art. Radiology 2019;292:520‐536. - PubMed
    1. Tofts PS, Brix G, Buckley DL, et al. Estimating kinetic parameters from dynamic contrast‐enhanced t1‐weighted MRI of a diffusable tracer: Standardized quantities and symbols. J Magn Reson Imaging 1999;10:223‐232. - PubMed

Publication types

LinkOut - more resources