Abdominal CT Body Composition Thresholds Using Automated AI Tools for Predicting 10-year Adverse Outcomes
- PMID: 36165792
- PMCID: PMC9885340
- DOI: 10.1148/radiol.220574
Abdominal CT Body Composition Thresholds Using Automated AI Tools for Predicting 10-year Adverse Outcomes
Abstract
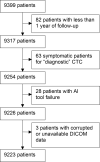
Background CT-based body composition measures derived from fully automated artificial intelligence tools are promising for opportunistic screening. However, body composition thresholds associated with adverse clinical outcomes are lacking. Purpose To determine population and sex-specific thresholds for muscle, abdominal fat, and abdominal aortic calcium measures at abdominal CT for predicting risk of death, adverse cardiovascular events, and fragility fractures. Materials and Methods In this retrospective single-center study, fully automated algorithms for quantifying skeletal muscle (L3 level), abdominal fat (L3 level), and abdominal aortic calcium were applied to noncontrast abdominal CT scans from asymptomatic adults screened from 2004 to 2016. Longitudinal follow-up documented subsequent death, adverse cardiovascular events (myocardial infarction, cerebrovascular event, and heart failure), and fragility fractures. Receiver operating characteristic (ROC) curve analysis was performed to derive thresholds for body composition measures to achieve optimal ROC curve performance and high specificity (90%) for 10-year risks. Results A total of 9223 asymptomatic adults (mean age, 57 years ± 7 [SD]; 5152 women and 4071 men) were evaluated (median follow-up, 9 years). Muscle attenuation and aortic calcium had the highest diagnostic performance for predicting death, with areas under the ROC curve of 0.76 for men (95% CI: 0.72, 0.79) and 0.72 for women (95% CI: 0.69, 0.76) for muscle attenuation. Sex-specific thresholds were higher in men than women (P < .001 for muscle attenuation for all outcomes). The highest-performing markers for risk of death were muscle attenuation in men (31 HU; 71% sensitivity [164 of 232 patients]; 72% specificity [1114 of 1543 patients]) and aortic calcium in women (Agatston score, 167; 70% sensitivity [152 of 218 patients]; 70% specificity [1427 of 2034 patients]). Ninety-percent specificity thresholds for muscle attenuation for both risk of death and fragility fractures were 23 HU (men) and 13 HU (women). For aortic calcium and risk of death and adverse cardiovascular events, 90% specificity Agatston score thresholds were 1475 (men) and 735 (women). Conclusion Sex-specific thresholds for automated abdominal CT-based body composition measures can be used to predict risk of death, adverse cardiovascular events, and fragility fractures. © RSNA, 2022 Online supplemental material is available for this article. See also the editorial by Ohliger in this issue.
Conflict of interest statement
Figures


Comment in
-
Body Composition at CT and Risk of Future Disease.Radiology. 2023 Feb;306(2):e222162. doi: 10.1148/radiol.222162. Epub 2022 Sep 27. Radiology. 2023. PMID: 36165799 Free PMC article. No abstract available.
Similar articles
-
Utility of Fully Automated Body Composition Measures on Pretreatment Abdominal CT for Predicting Survival in Patients With Colorectal Cancer.AJR Am J Roentgenol. 2023 Mar;220(3):371-380. doi: 10.2214/AJR.22.28043. Epub 2022 Aug 24. AJR Am J Roentgenol. 2023. PMID: 36000663
-
Automated Abdominal CT Imaging Biomarkers for Opportunistic Prediction of Future Major Osteoporotic Fractures in Asymptomatic Adults.Radiology. 2020 Oct;297(1):64-72. doi: 10.1148/radiol.2020200466. Epub 2020 Aug 11. Radiology. 2020. PMID: 32780005 Free PMC article.
-
AI-generated CT body composition biomarkers associated with increased mortality risk in socioeconomically disadvantaged individuals.Abdom Radiol (NY). 2024 Apr;49(4):1330-1340. doi: 10.1007/s00261-023-04161-z. Epub 2024 Jan 27. Abdom Radiol (NY). 2024. PMID: 38280049
-
Visceral adiposity and inflammatory bowel disease.Int J Colorectal Dis. 2021 Nov;36(11):2305-2319. doi: 10.1007/s00384-021-03968-w. Epub 2021 Jun 9. Int J Colorectal Dis. 2021. PMID: 34104989 Review.
-
Opportunistic Screening at Abdominal CT: Use of Automated Body Composition Biomarkers for Added Cardiometabolic Value.Radiographics. 2021 Mar-Apr;41(2):524-542. doi: 10.1148/rg.2021200056. Radiographics. 2021. PMID: 33646902 Free PMC article. Review.
Cited by
-
Body Composition at CT and Risk of Future Disease.Radiology. 2023 Feb;306(2):e222162. doi: 10.1148/radiol.222162. Epub 2022 Sep 27. Radiology. 2023. PMID: 36165799 Free PMC article. No abstract available.
-
Body composition after treatment of intra-mucosal gastric cancer with endoscopic resection compared to gastrectomy.Commun Med (Lond). 2025 Jun 13;5(1):231. doi: 10.1038/s43856-025-00931-6. Commun Med (Lond). 2025. PMID: 40514447 Free PMC article.
-
AI-based volumetric six-tissue body composition quantification from CT cardiac attenuation scans for mortality prediction: a multicentre study.Lancet Digit Health. 2025 May;7(5):100862. doi: 10.1016/j.landig.2025.02.002. Epub 2025 May 16. Lancet Digit Health. 2025. PMID: 40382274 Free PMC article.
-
Study protocol to redefine muscle attenuation cut-offs for better prediction of mortality in patients with cirrhosis: a comprehensive post hoc validation study - a study protocol.BMJ Open. 2025 Mar 25;15(3):e094252. doi: 10.1136/bmjopen-2024-094252. BMJ Open. 2025. PMID: 40132832 Free PMC article.
-
AI-based volumetric six-tissue body composition quantification from CT cardiac attenuation scans enhances mortality prediction: multicenter study.medRxiv [Preprint]. 2024 Aug 1:2024.07.30.24311224. doi: 10.1101/2024.07.30.24311224. medRxiv. 2024. Update in: Lancet Digit Health. 2025 May;7(5):100862. doi: 10.1016/j.landig.2025.02.002. PMID: 39132480 Free PMC article. Updated. Preprint.
References
MeSH terms
Substances
Grants and funding
LinkOut - more resources
Full Text Sources
Medical

