Review
. 2022 Nov;305(2):250-264.
doi: 10.1148/radiol.213303. Epub 2022 Sep 27.

Microvascular Flow Imaging: A State-of-the-Art Review of Clinical Use and Promise

Affiliations
Review

Microvascular Flow Imaging: A State-of-the-Art Review of Clinical Use and Promise

Muhammad Usman Aziz et al. Radiology. 2022 Nov.

Abstract

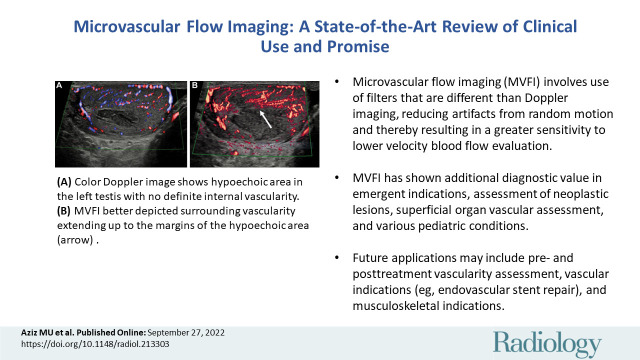
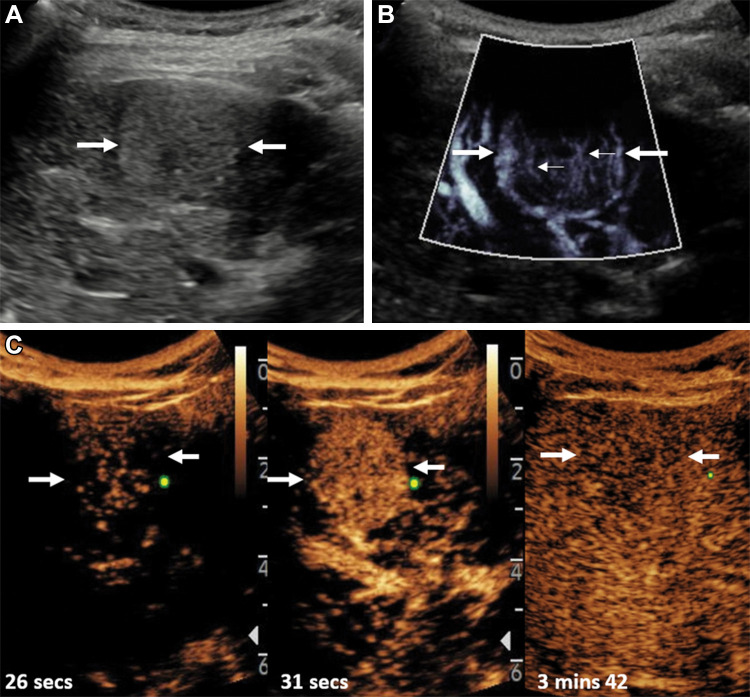
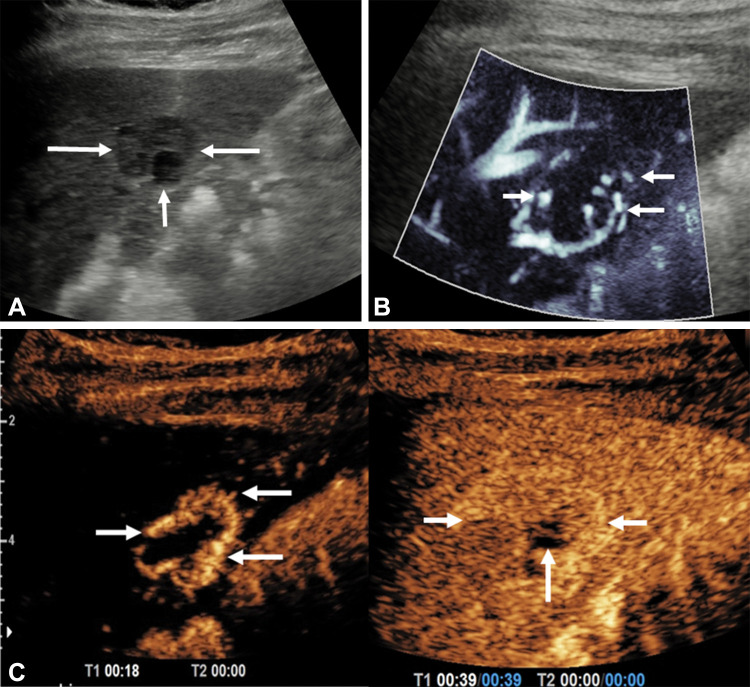
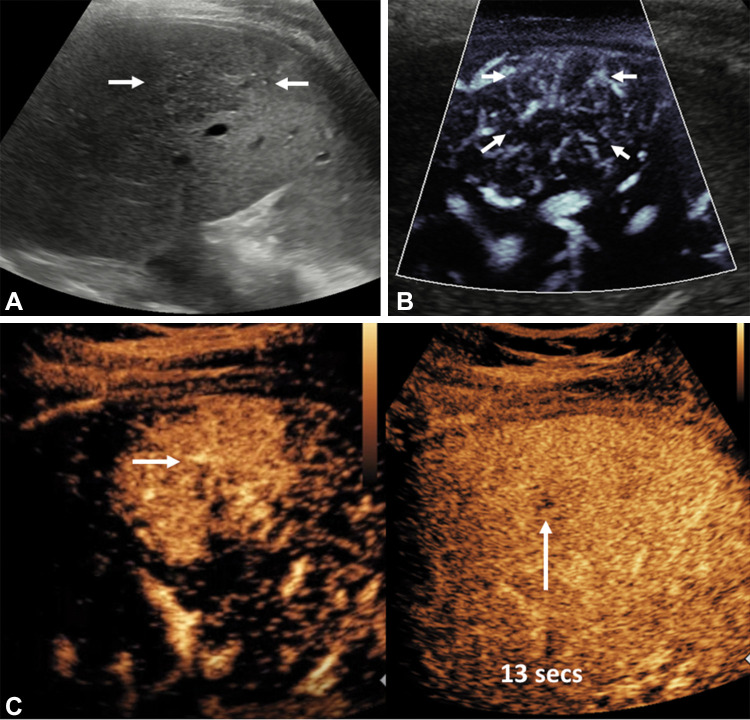
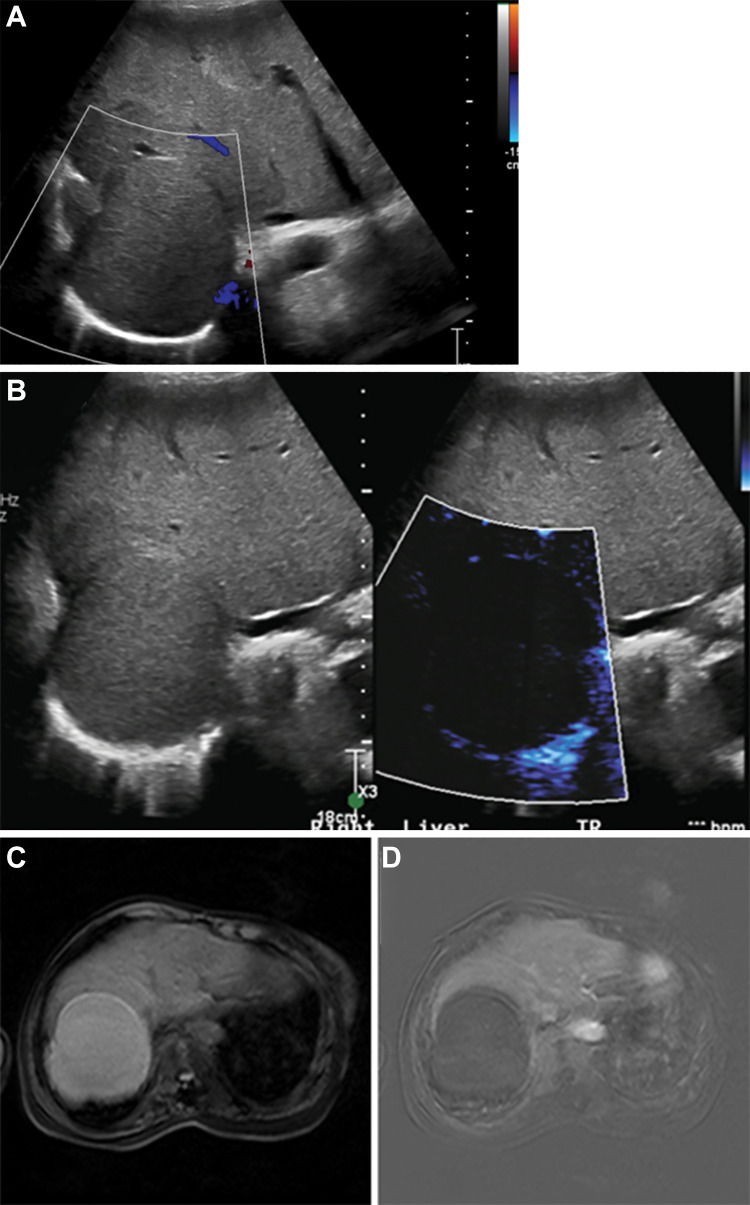
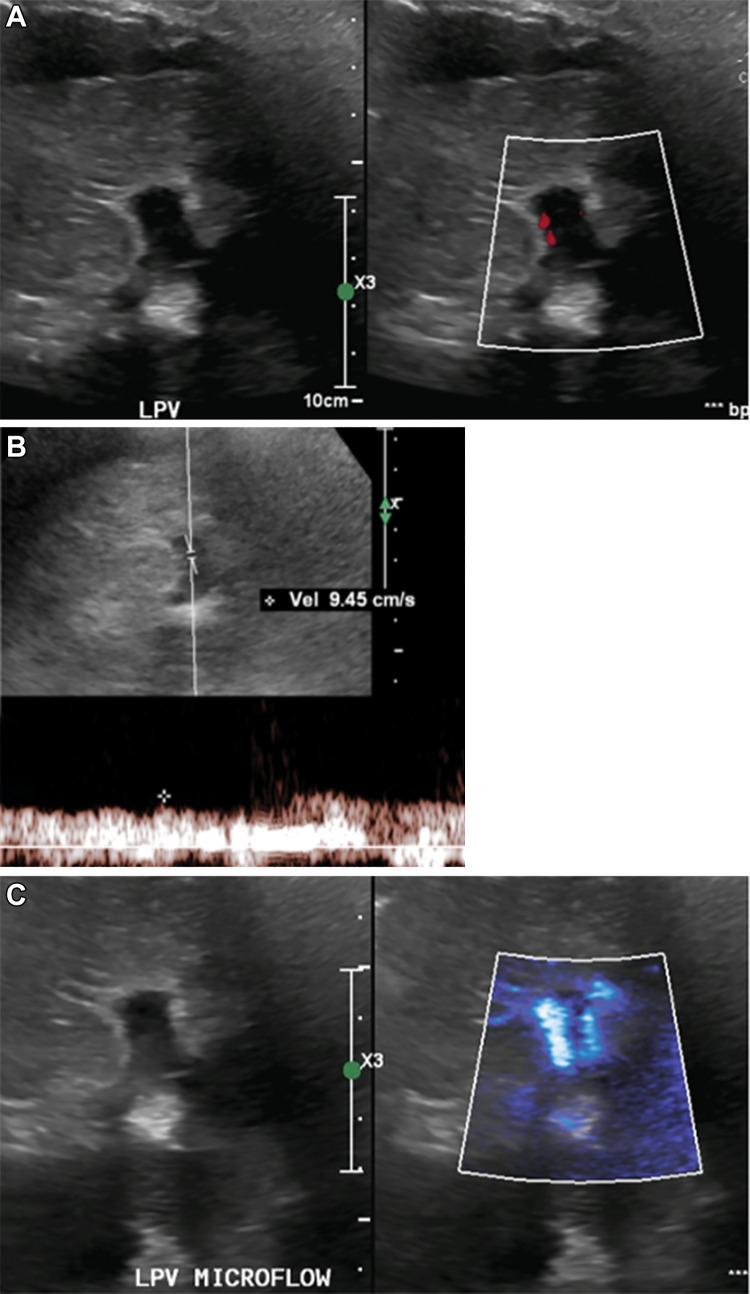
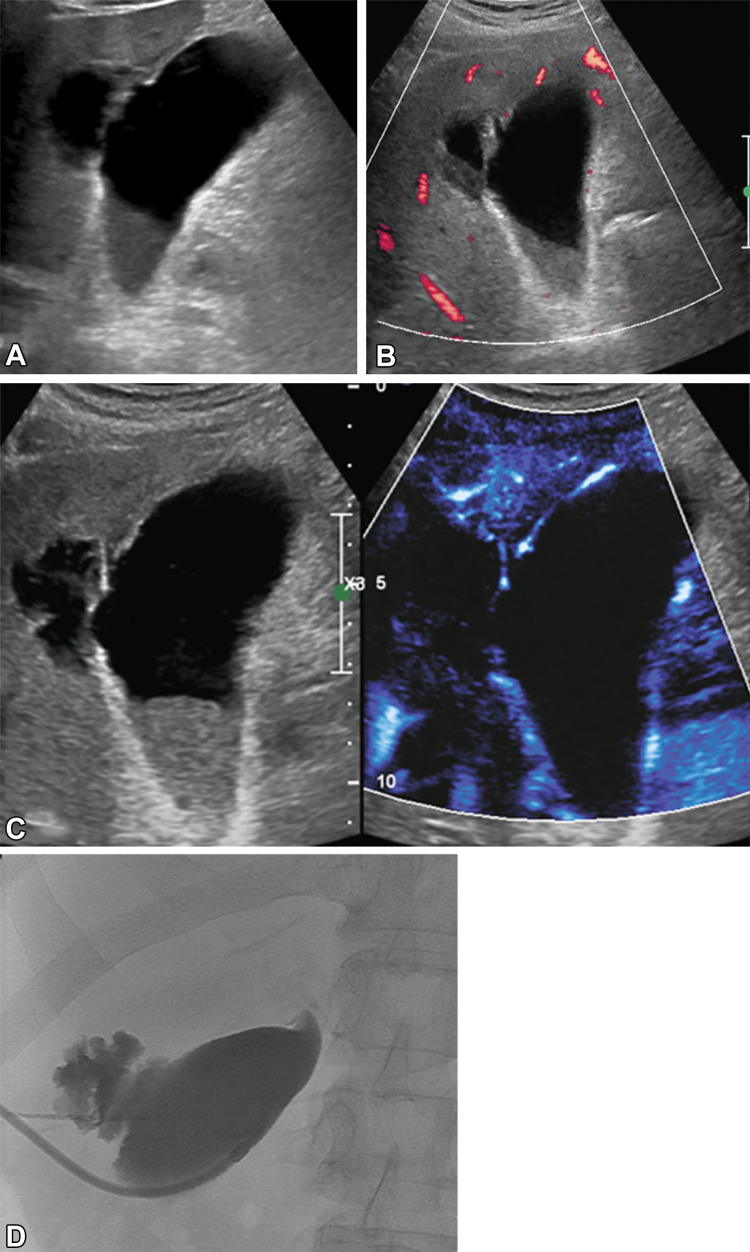
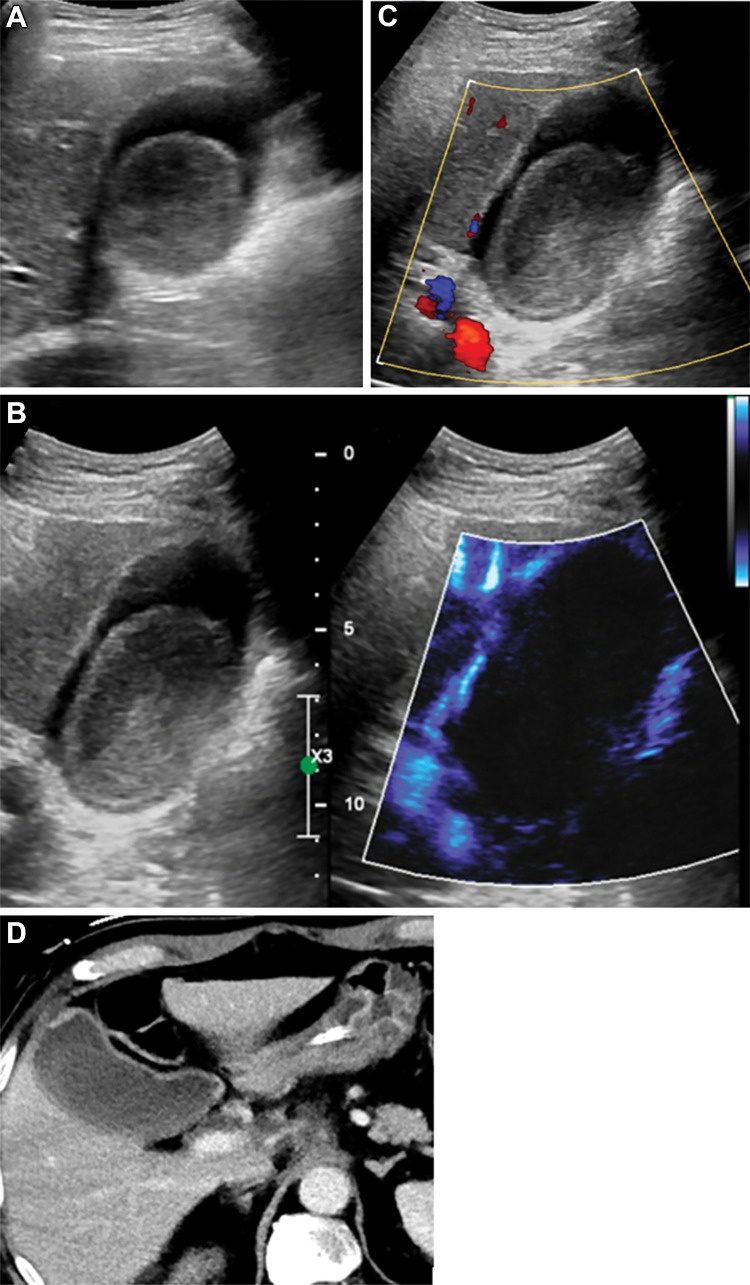
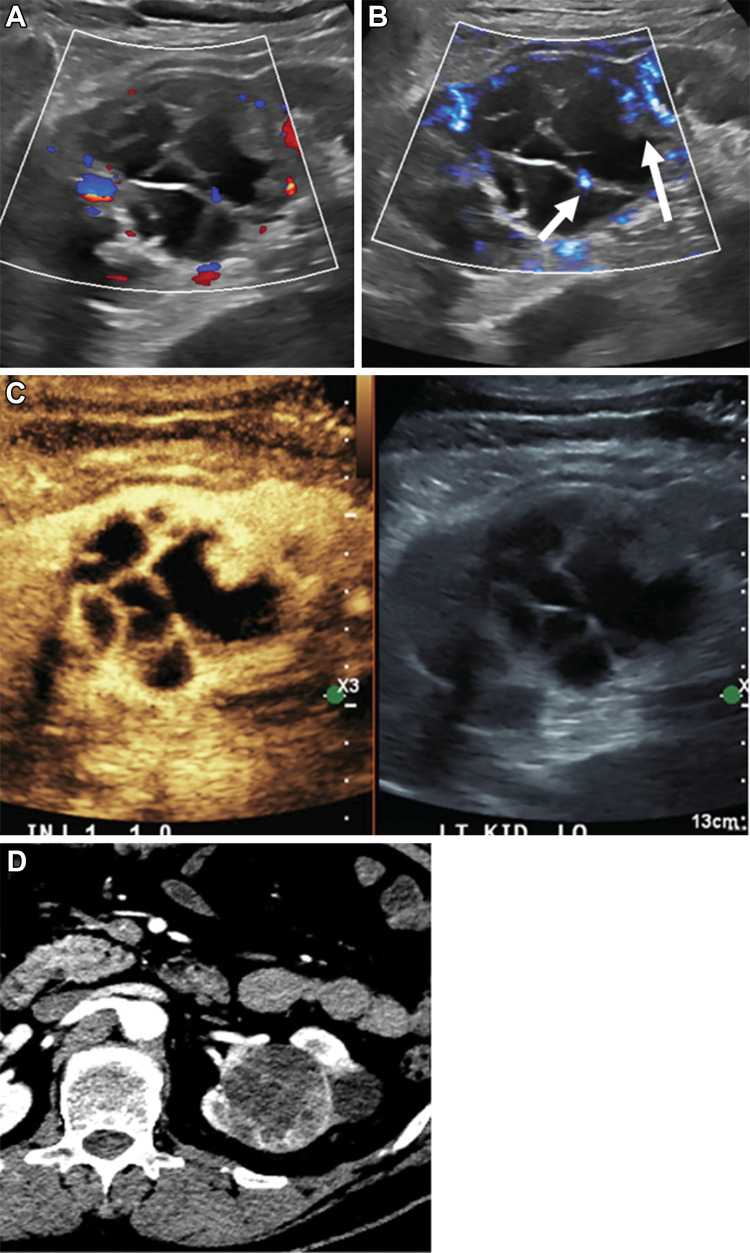
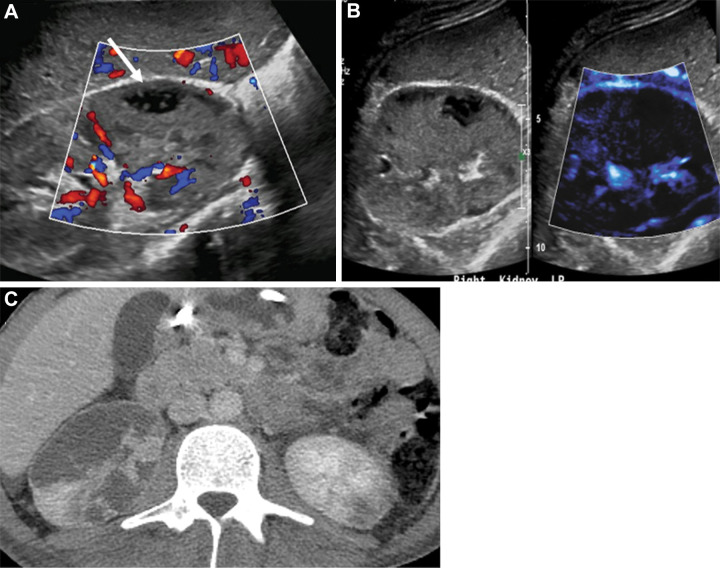
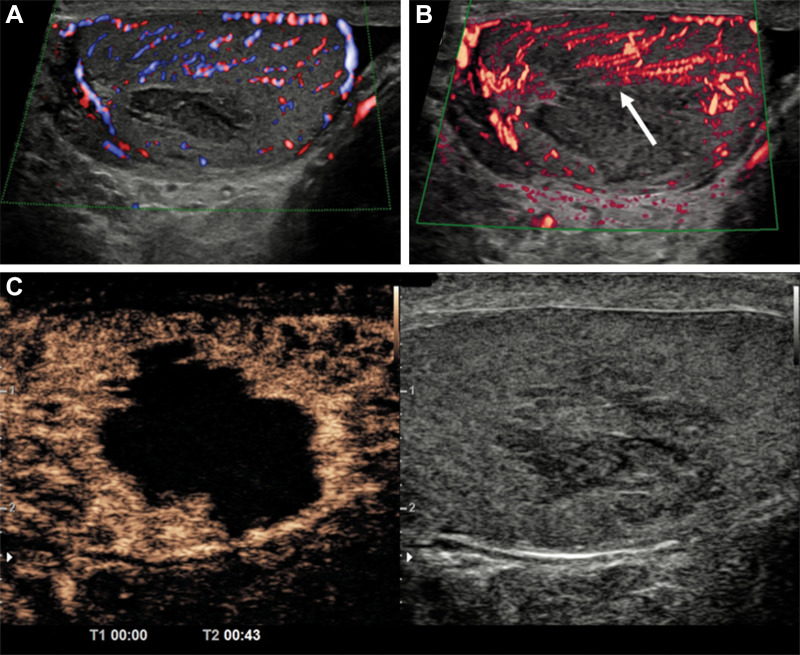
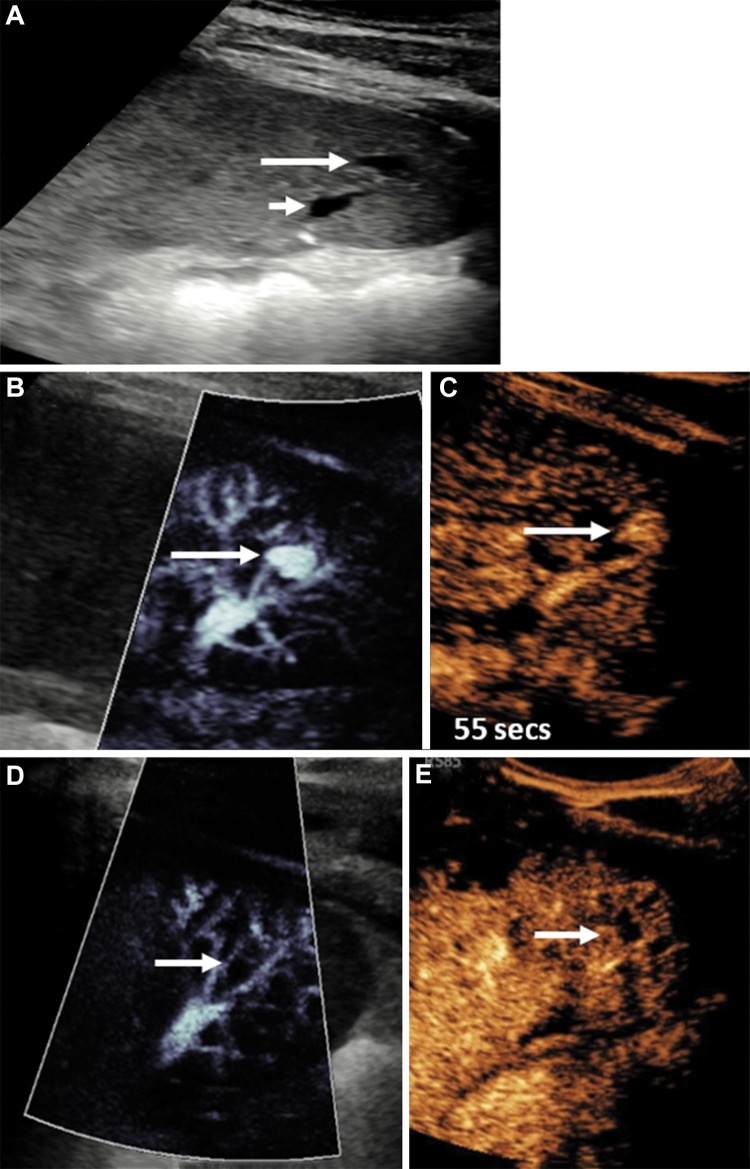
Vascular imaging with color and power Doppler is a useful tool in the assessment of various disease processes. Assessment of blood flow, from infarction and ischemia to hyperemia, in organs, neoplasms, and vessels, is used in nearly every US investigation. Recent developments in this area are sensitive to small-vessel low velocity flow without use of intravenous contrast agents, known as microvascular flow imaging (MVFI). MVFI is more sensitive in detection of small vessels than color, power, and spectral Doppler, reducing the need for follow-up contrast-enhanced US (CEUS), CT, and MRI, except when arterial and venous wash-in and washout characteristics would be helpful in diagnosis. Varying clinical applications of MVFI are reviewed in adult and pediatric populations, including its technical underpinnings. MVFI shows promise in assessment of several conditions including benign and malignant lesions in the liver and kidney, acute pathologic abnormalities in the gallbladder and testes, and superficial lymph nodes. Future potential of MVFI in different conditions (eg, endovascular repair) is discussed. Finally, clinical cases in which MVFI correlated and potentially obviated additional CEUS, CT, or MRI are shown.


Conflict of interest statement

Disclosures of conflicts of interest: M.U.A. No relevant relationships. J.R.E. Royalties from Elsevier; reviewer honorarium from NIH; support for meeting attendance from International Contrast Ultrasound Society; data safety monitoring board at Thomas Jefferson University; chair of High Frequency and Preclinical US Community at AIUM; receipt of equipment and grant support from GE Healthcare, Siemens Healthcare, Canon, Lantheus Medical Imaging. A.D. No relevant relationships. M.Z. No relevant relationships. K.S. No relevant relationships. P.S. Equipment loan from Samsung; consulting fees from ITREAS; speaker fees from Siemens Heathcare, Bracco, Samsung, Philips Healthcare; treasurer of WFUMB; member of Radiology editorial board. M.L.R. New equipment evaluation and contract from Philips Ultrasound; payment or honoraria from Philips Ultrasound; member of Radiology editorial board.

Figures

None
Graphical abstract
Images of hepatocellular carcinoma in a 16-year-old girl with
cryptogenic cirrhosis who was found to have a focal liver lesion increasing
in size on serial US images. (A, B) Longitudinal gray-scale image through
the right liver lobe. (A) On baseline US image, the lesion (arrows) was
slightly hyperechoic with a hypoechoic halo. (B) Microvascular flow imaging
showed hypertrophic peripheral vessels (thick arrows) with abnormal central
vessels in a haphazard distribution (thin arrows). (C) Contrast-enhanced US
of the focal liver lesion (arrows) showed early arterial enhancement at 26
seconds after administration of contrast agent, with more avid arterial
enhancement at 31 seconds and subsequent late washout at 3 minutes 42
seconds.
Figure 1:
Images of hepatocellular carcinoma in a 16-year-old girl with cryptogenic cirrhosis who was found to have a focal liver lesion increasing in size on serial US images. (A, B) Longitudinal gray-scale image through the right liver lobe. (A) On baseline US image, the lesion (arrows) was slightly hyperechoic with a hypoechoic halo. (B) Microvascular flow imaging showed hypertrophic peripheral vessels (thick arrows) with abnormal central vessels in a haphazard distribution (thin arrows). (C) Contrast-enhanced US of the focal liver lesion (arrows) showed early arterial enhancement at 26 seconds after administration of contrast agent, with more avid arterial enhancement at 31 seconds and subsequent late washout at 3 minutes 42 seconds.
Longitudinal images through the left liver lobe of hemangioma in a
39-year-old man referred for investigation of microscopic hematuria, noted
to have an incidental solitary liver lesion at US. (A) B-mode scan showed an
isoechoic lesion (long arrows) with an eccentric hypoechoic component (short
arrow). (B) At microvascular flow imaging, there were peripheral globular
vessels observed in the periphery (arrows) of the focal liver lesion. (C) A
contrast-enhanced US examination depicted globular enhancement at 18 seconds
(short arrows), centripetal filling of the lesion (long arrows), with
incomplete filling attributed to either a thrombus or scar and hyalinization
(short arrow) at 39 seconds of contrast agent administration.
Figure 2:
Longitudinal images through the left liver lobe of hemangioma in a 39-year-old man referred for investigation of microscopic hematuria, noted to have an incidental solitary liver lesion at US. (A) B-mode scan showed an isoechoic lesion (long arrows) with an eccentric hypoechoic component (short arrow). (B) At microvascular flow imaging, there were peripheral globular vessels observed in the periphery (arrows) of the focal liver lesion. (C) A contrast-enhanced US examination depicted globular enhancement at 18 seconds (short arrows), centripetal filling of the lesion (long arrows), with incomplete filling attributed to either a thrombus or scar and hyalinization (short arrow) at 39 seconds of contrast agent administration.
Longitudinal image through the right liver lobe in a 14-year-old girl
with a background fatty liver and an incidental focal liver lesion. (A)
B-mode US showed a focal liver lesion (arrows) of low reflectivity compared
with the background liver parenchyma, measuring 58 × 47 × 36
mm. (B) Microvascular flow image of the lesion showed a so-called spoke
wheel distribution of vessels (arrows). (C) Contrast-enhanced US performed
at the arterial phase confirmed this pattern of spoke wheel vascularization
(horizontal arrow), with central vessels at 13 seconds after contrast agent
injection and hyperenhancement of the lesion (vertical arrow) at 38 seconds
after contrast agent administration. The lesion had complete fill-in and no
washout, with no observed central scar. A subsequent MRI scan verified the
findings at US of a focal nodular hyperplasia (not shown).
Figure 3:
Longitudinal image through the right liver lobe in a 14-year-old girl with a background fatty liver and an incidental focal liver lesion. (A) B-mode US showed a focal liver lesion (arrows) of low reflectivity compared with the background liver parenchyma, measuring 58 × 47 × 36 mm. (B) Microvascular flow image of the lesion showed a so-called spoke wheel distribution of vessels (arrows). (C) Contrast-enhanced US performed at the arterial phase confirmed this pattern of spoke wheel vascularization (horizontal arrow), with central vessels at 13 seconds after contrast agent injection and hyperenhancement of the lesion (vertical arrow) at 38 seconds after contrast agent administration. The lesion had complete fill-in and no washout, with no observed central scar. A subsequent MRI scan verified the findings at US of a focal nodular hyperplasia (not shown).
Hemorrhagic hepatic cyst in a 55-year-old man with hepatic mass. (A)
Gray-scale image with color Doppler showed a solid mass with isoechoic
echotexture in the liver without color flow at Doppler. (B) Corresponding
microvascular flow imaging (MVFI) did not show any internal vascularity;
however, some of the posterior aspects were considered too deep for
definitive characterization. (C) The lesion was hyperintense at
contrast-enhanced T1-weighted MRI. (D) No enhancement was identified on the
subtraction image, confirming the assessment at MVFI.
Figure 4:
Hemorrhagic hepatic cyst in a 55-year-old man with hepatic mass. (A) Gray-scale image with color Doppler showed a solid mass with isoechoic echotexture in the liver without color flow at Doppler. (B) Corresponding microvascular flow imaging (MVFI) did not show any internal vascularity; however, some of the posterior aspects were considered too deep for definitive characterization. (C) The lesion was hyperintense at contrast-enhanced T1-weighted MRI. (D) No enhancement was identified on the subtraction image, confirming the assessment at MVFI.
(A) Gray-scale and color Doppler US images in an adult patient with
elevated liver function tests without clinically significant color flow
within the left portal vein (LPV). (B) Spectral Doppler image showed slow
velocity flow in the left portal vein. (C) Microvascular flow imaging
depicted internal vascularity, which confirmed patency and obviated further
investigations.
Figure 5:
(A) Gray-scale and color Doppler US images in an adult patient with elevated liver function tests without clinically significant color flow within the left portal vein (LPV). (B) Spectral Doppler image showed slow velocity flow in the left portal vein. (C) Microvascular flow imaging depicted internal vascularity, which confirmed patency and obviated further investigations.
(A) Gray-scale US image shows irregular gallbladder wall in a
65-year-old female patient with upper abdominal pain. There is a fluid
collection in the liver adjacent to the gallbladder, as seen. (B) Power
Doppler mode shows only limited vascularity in the most superficial portion
of the gallbladder wall. (C) Microvascular flow image and gray-scale image
depicted diffuse vascularity in the gallbladder wall, without definite blood
flow in the irregular portion of the gallbladder wall of concern. This
increased confidence in diagnosis of gallbladder wall perforation, with
communication with the adjacent intrahepatic collection. (D) Spot image from
cholecystostomy tube placement confirmed focal perforation of the
gallbladder with contrast leak into the adjacent collection.
Figure 6:
(A) Gray-scale US image shows irregular gallbladder wall in a 65-year-old female patient with upper abdominal pain. There is a fluid collection in the liver adjacent to the gallbladder, as seen. (B) Power Doppler mode shows only limited vascularity in the most superficial portion of the gallbladder wall. (C) Microvascular flow image and gray-scale image depicted diffuse vascularity in the gallbladder wall, without definite blood flow in the irregular portion of the gallbladder wall of concern. This increased confidence in diagnosis of gallbladder wall perforation, with communication with the adjacent intrahepatic collection. (D) Spot image from cholecystostomy tube placement confirmed focal perforation of the gallbladder with contrast leak into the adjacent collection.
Images in a 67-year-old man who was positive for COVID-19 and who
presented with fever and abdominal pain. (A) Gray-scale US image showed a
large isoechoic mass in the gallbladder lumen, and gallbladder tumor was in
the differential. (B) Limited color Doppler was observed in the gallbladder
wall; therefore, confidence was low that absence of flow in the gallbladder
mass indicated sludge versus tumor. (C) Increased depiction of vascularity
of the gallbladder wall and adjacent liver on microvascular flow image with
no internal vascularity in the gallbladder mass improved confidence in a
diagnosis of tumefactive sludge. (D) Follow-up CT confirmed lack of
contrast-enhanced mass in the gallbladder.
Figure 7:
Images in a 67-year-old man who was positive for COVID-19 and who presented with fever and abdominal pain. (A) Gray-scale US image showed a large isoechoic mass in the gallbladder lumen, and gallbladder tumor was in the differential. (B) Limited color Doppler was observed in the gallbladder wall; therefore, confidence was low that absence of flow in the gallbladder mass indicated sludge versus tumor. (C) Increased depiction of vascularity of the gallbladder wall and adjacent liver on microvascular flow image with no internal vascularity in the gallbladder mass improved confidence in a diagnosis of tumefactive sludge. (D) Follow-up CT confirmed lack of contrast-enhanced mass in the gallbladder.
Incidentally detected renal cystic lesion in a 53-year-old male
patient (Bosniak type IV). (A) A mixed cystic and solid lesion with little
internal vascularity on color Doppler images. (B) At microvascular flow
imaging, greater discrete internal vascularity (arrows) was observed within
the solid component of the mass and septations, increasing diagnostic
confidence in diagnosis of Bosniak type IV renal cell carcinoma. (C)
Subsequent contrast-enhanced US imaging depicted vascular septations and
mural nodules, consistent with cystic renal cell carcinoma. (D) Subsequent
CT confirmed presence of cystic renal cell carcinoma.
Figure 8:
Incidentally detected renal cystic lesion in a 53-year-old male patient (Bosniak type IV). (A) A mixed cystic and solid lesion with little internal vascularity on color Doppler images. (B) At microvascular flow imaging, greater discrete internal vascularity (arrows) was observed within the solid component of the mass and septations, increasing diagnostic confidence in diagnosis of Bosniak type IV renal cell carcinoma. (C) Subsequent contrast-enhanced US imaging depicted vascular septations and mural nodules, consistent with cystic renal cell carcinoma. (D) Subsequent CT confirmed presence of cystic renal cell carcinoma.
Images in a 28-year-old man with history of trauma. (A) US Doppler
image depicted a heterogeneous area in the right kidney with relative
paucity of flow in the mid and lower pole. Hypoechoic area (white arrow)
within infarcted zone represented laceration with hemorrhage and fluid,
which was observed at CT. (B) Noncontrast microvascular flow image clearly
demarcated the area without vascularity that was confirmed on the (C)
subsequent contrast-enhanced CT image.
Figure 9:
Images in a 28-year-old man with history of trauma. (A) US Doppler image depicted a heterogeneous area in the right kidney with relative paucity of flow in the mid and lower pole. Hypoechoic area (white arrow) within infarcted zone represented laceration with hemorrhage and fluid, which was observed at CT. (B) Noncontrast microvascular flow image clearly demarcated the area without vascularity that was confirmed on the (C) subsequent contrast-enhanced CT image.
Images in a 50-year-old man with no predisposing factors and sudden
onset of pain in the left testis. (A) Color Doppler image shows hypoechoic
area in the left testis with no definite internal vascularity. (B)
Microvascular flow image better depicted surrounding vascularity extending
up to the margins of the hypoechoic area (arrow) compared with the color
Doppler image, which increased its diagnostic value. (C) Contrast-enhanced
US (CEUS) showed no internal vascularity consistent with segmental
infarction. The CEUS image gave the best definition of the vascularized
borders. Contraction and resolution were identified over 6 months of serial
US.
Figure 10:
Images in a 50-year-old man with no predisposing factors and sudden onset of pain in the left testis. (A) Color Doppler image shows hypoechoic area in the left testis with no definite internal vascularity. (B) Microvascular flow image better depicted surrounding vascularity extending up to the margins of the hypoechoic area (arrow) compared with the color Doppler image, which increased its diagnostic value. (C) Contrast-enhanced US (CEUS) showed no internal vascularity consistent with segmental infarction. The CEUS image gave the best definition of the vascularized borders. Contraction and resolution were identified over 6 months of serial US.
Longitudinal US image in the spleen in a 14-year-old boy who fell on his
elbow while playing soccer, sustaining a grade 4 splenic laceration. (A) Day 5
postinjury US image showed a small anechoic lesion within the splenic fracture
plane (long arrow) adjacent to splenic vessels (short arrow). (B) Microvascular
flow image showed a pseudoaneurysm of the splenic artery (arrow), confirmed on a
(C) contrast-enhanced US (CEUS) image (arrow) at 55 seconds after contrast agent
administration. A follow-up examination 3 days later, with both microvascular
flow imaging (D) and CEUS (E), showed that the pseudoaneurysm (arrows in D and
E) had spontaneously thrombosed without any intervention.
Figure 11:
Longitudinal US image in the spleen in a 14-year-old boy who fell on his elbow while playing soccer, sustaining a grade 4 splenic laceration. (A) Day 5 postinjury US image showed a small anechoic lesion within the splenic fracture plane (long arrow) adjacent to splenic vessels (short arrow). (B) Microvascular flow image showed a pseudoaneurysm of the splenic artery (arrow), confirmed on a (C) contrast-enhanced US (CEUS) image (arrow) at 55 seconds after contrast agent administration. A follow-up examination 3 days later, with both microvascular flow imaging (D) and CEUS (E), showed that the pseudoaneurysm (arrows in D and E) had spontaneously thrombosed without any intervention.

References

    1. Martinoli C , Derchi LE , Rizzatto G , Solbiati L . Power Doppler sonography: general principles, clinical applications, and future prospects . Eur Radiol 1998. ; 8 ( 7 ): 1224 – 1235 . - PubMed
    1. Cosgrove D , Lassau N . Imaging of perfusion using ultrasound . Eur J Nucl Med Mol Imaging 2010. ; 37 ( Suppl 1 ): S65 – S85 . - PubMed
    1. Evans DH , Jensen JA , Nielsen MB . Ultrasonic colour Doppler imaging . Interface Focus 2011. ; 1 ( 4 ): 490 – 502 . - PMC - PubMed
    1. Ma Y , Li G , Li J , Ren WD . The Diagnostic Value of Superb Microvascular Imaging (SMI) in Detecting Blood Flow Signals of Breast Lesions: A Preliminary Study Comparing SMI to Color Doppler Flow Imaging . Medicine (Baltimore) 2015. ; 94 ( 36 ): e1502 . - PMC - PubMed
    1. Tierney J , Walsh K , Griffith H , Baker J , Brown DB , Byram B . Combining Slow Flow Techniques With Adaptive Demodulation for Improved Perfusion Ultrasound Imaging Without Contrast . IEEE Trans Ultrason Ferroelectr Freq Control 2019. ; 66 ( 5 ): 834 – 848 . - PMC - PubMed

Publication types

LinkOut - more resources