. 2022 Oct 14;50(18):10756-10771.
doi: 10.1093/nar/gkac799.

Translational enhancement by base editing of the Kozak sequence rescues haploinsufficiency

Affiliations

Translational enhancement by base editing of the Kozak sequence rescues haploinsufficiency

Chiara Ambrosini et al. Nucleic Acids Res. .

Abstract

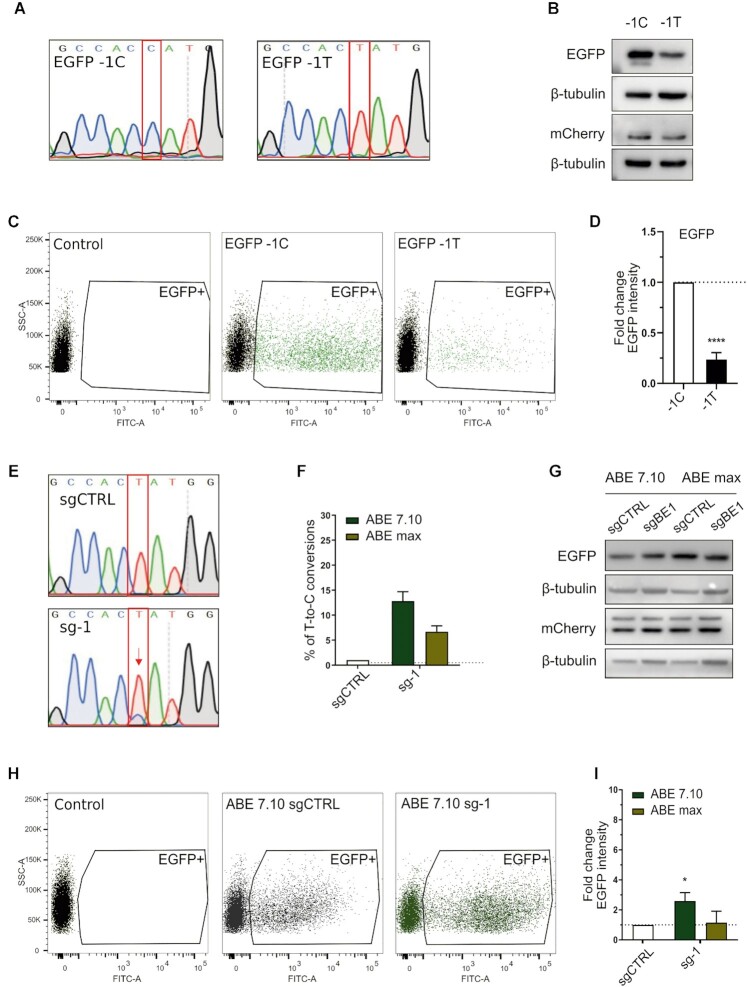
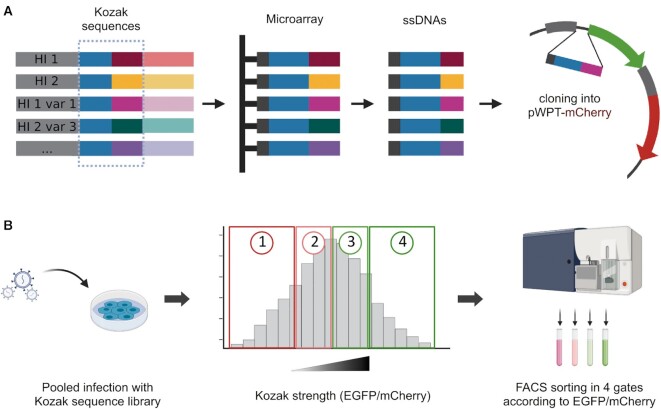
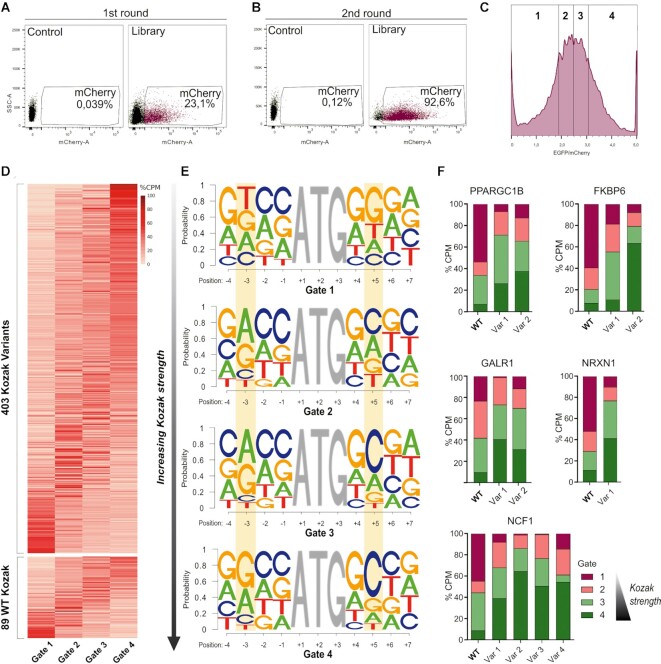
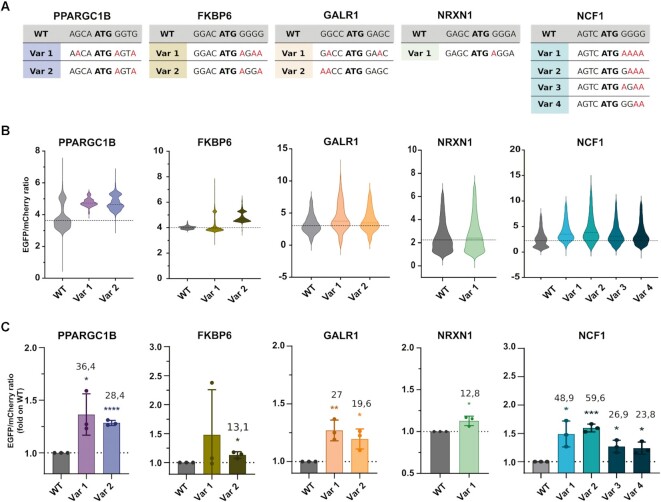
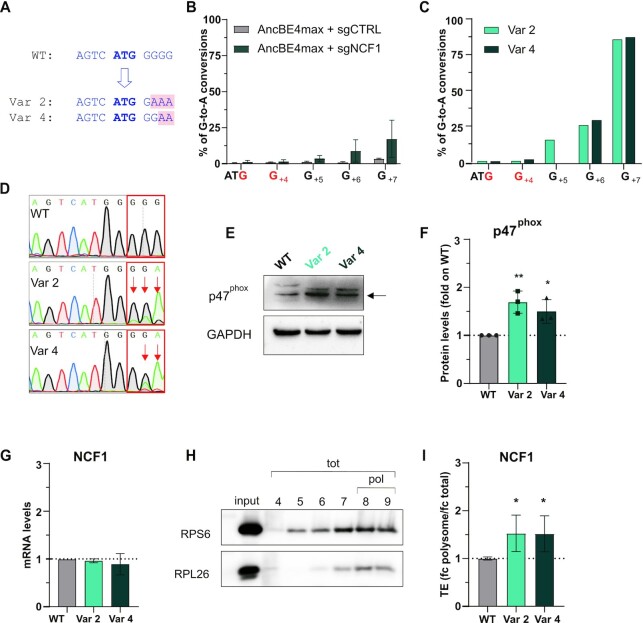
A variety of single-gene human diseases are caused by haploinsufficiency, a genetic condition by which mutational inactivation of one allele leads to reduced protein levels and functional impairment. Translational enhancement of the spare allele could exert a therapeutic effect. Here we developed BOOST, a novel gene-editing approach to rescue haploinsufficiency loci by the change of specific single nucleotides in the Kozak sequence, which controls translation by regulating start codon recognition. We evaluated for translational strength 230 Kozak sequences of annotated human haploinsufficient genes and 4621 derived variants, which can be installed by base editing, by a high-throughput reporter assay. Of these variants, 149 increased the translation of 47 Kozak sequences, demonstrating that a substantial proportion of haploinsufficient genes are controlled by suboptimal Kozak sequences. Validation of 18 variants for 8 genes produced an average enhancement in an expression window compatible with the rescue of the genetic imbalance. Base editing of the NCF1 gene, whose monoallelic loss causes chronic granulomatous disease, resulted in the desired increase of NCF1 (p47phox) protein levels in a relevant cell model. We propose BOOST as a fine-tuned approach to modulate translation, applicable to the correction of dozens of haploinsufficient monogenic disorders independently of the causing mutation.


Figures

Figure 1.
Figure 1.
Boosting of a suboptimal Kozak sequence by base editing. (A) Sanger sequencing chromatograms representing the wild-type (EGFP-1C) and the mutated EGFP version (EGFP-1T), with a single variation in position –1 of the Kozak sequence. (B) Western blot analysis of EGFP and mCherry expression in HEK293T cells transiently transfected with EGFP-1C or EGFP-1T plasmids. (C) Representative FACS dot plots of HEK293T cells three days after transient transfection. (D) FACS analysis of HEK293T cells transiently transfected with the respective plasmids. The average EGFP intensity of EGFP-1T is normalised over EGFP-1C. Data are reported as mean ± SD of n = 3 biological replicates. Statistically significant differences were calculated by unpaired t-test. (E) Representative Sanger sequencing chromatograms of HEK293T cells edited with the ABE7.10 base editor and sg-1, compared with ABE7.10 combined with a scrambled sgRNA (sgCTRL). (F) Percentage of correct T-to-C conversion analysed with the EditR software. (G) Western blot analysis of EGFP and mCherry expression in HEK293T cells edited with ABE 7.10 or ABEmax combined with sg-1 or sgCTRL. (H) Representative FACS dot plots of cells edited with ABE7.10 and sg-1, compared with ABE7.10 combined with a scrambled sgRNA (sgCTRL) 3 days after transfection. (I). FACS analysis of EGFP expression in cells transfected with the base editors (ABE7.10 and ABEmax) and sgCTRL or sg-1. The average EGFP intensity of sg-1 is normalised over sgCTRL. Data are means ± SD from n = 3 biological replicates. Statistically significant differences were calculated by unpaired t-test (P value = 0,0483).
Figure 2.
Figure 2.
Schematic workflow of library generation and selection screening for Kozak strength. (A) The Kozak variants were designed as oligonucleotides bearing the overhangs to be cloned in the destination vector. The oligos were synthesised on a custom microarray. The library was cloned in place of the EGFP Kozak sequence in a bicistronic reporter vector. (B) The Kozak sequence library was used to transduce HEK293T cells. Transduced cells were sorted according to their EGFP/mCherry ratio as a measure of Kozak strength. The four gates were drawn so that each gate contained 25% of the total population.
Figure 3.
Figure 3.
High-throughput determination of protein levels from Kozak sequence variants. (A) mCherry expression of the transduced cells in FACS-seq first round of sorting. 5 × 106 mCherry-positive cells (23.1% of the total) were sorted. (B) FACS-seq second round of sorting. (C) mCherry-positive cells from the gate drawn in (B) were divided into four gates according to EGFP/mCherry expression, defined in such a way that each bin contains 25% of the total population of interest. (D) The heatmap represents the distribution of the percentage of the count per million reads (CPM) in the four gates of the candidate HI genes and variants which passed the statistical analysis. In the upper panel, the Kozak variants are represented. The WT Kozak sequences of the HI genes are shown in the lower panel. Each column corresponds to one of the four gates, while each row stands for one of the Kozak sequences. Rows are ordered by the expected value (EV) of the corresponding sequence. (E) Logo representation of the Kozak sequences extracted from each of the four gates. In each panel, the positions along the Kozak sequence (with A of ATG being position +1) are represented on the x-axis, and the probability of occurrence of each base is shown on the y-axis. Gate 1 (upper panel) represents the lowest translational efficiency, while gate 4 (lower panel) corresponds to the most performing Kozak sequences. Relevant positions (–3 and +5) are highlighted in yellow. (F) Percentage of the count per million reads (CPM) in the four gates of the wild-type (WT) and the respective variants (Var) of the five selected genes.
Figure 4.
Figure 4.
Validation of actionable hit variants. (A) Wild-type (WT) and variants (Var) Kozak sequences of the selected hit genes. (B) Translational enhancement analysed as EGFP/mCherry expression by high content image analysis. The violin plots report the data distribution from n = 3 biological replicates. The dashed line indicates the population median. (C) The histogram represents the mean of the populations analysed by high content image analysis. Data are means ± SD from n = 3 biological replicates. The numbers indicate the percentage of mean increase of the variants over the WT. Statistically significant differences were calculated using the unpaired t-test of each variant versus the corresponding WT.
Figure 5.
Figure 5.
BOOST of the NCF1 Kozak sequence. (A) Schematic representation of the NCF1 wild-type (WT), variant 2 (Var 2) and variant 4 (Var 4) Kozak sequences. The starting codon is bold blue; the base changes in the variants are highlighted in pink. (B) Editing efficiency in the Raji bulk population at target and bystander (in red) guanines analysed with the EditR software five days post-electroporation of AncBE4max and sgNCF1 or sgCTRL. The percentage of corrected G-to-A conversions (y-axis) is shown for each position in the NCF1 Kozak sequence (x-axis, with the A of ATG being position + 1). Data are means ± SD from n = 3 independent experiments. (C). Editing efficiency in the two clones isolated from the bulk population (Var 2 and Var 4 cells) at target and bystander (in red) guanines. (D) Sanger sequencing chromatograms of NCF1 Kozak sequence in Raji WT, Var 2 and Var 4 cells. (E) Western blot analysis of the p47phox protein in Raji cells (WT, Var 2, and Var 4). One representative blot result is shown. The arrow indicates the 47KDa band corresponding to p47phox. (F) Western blot quantification. p47phox levels were normalised on the housekeeping protein, and the fold change with respect to the WT levels is shown, n = 3 biological replicates. (G) qPCR of NCF1 on WT, Var 2 or Var 4 Raji cells. Data are means ± SD from n = 3 independent experiments. (H). Representative western blot of two polysomal markers (RPS6 and RPL26) in the fractions isolated by sucrose gradient centrifugation. The input is the cellular cytoplasmic lysate loaded on the sucrose gradient. tot= fractions corresponding to the total RNA; pol= fractions selected as polysomes and used in (I). (I) Translational efficiency (TE) quantification of NCF1 in Var 2 and Var 4 cells with respect to the WT cells. TE is the ratio between polysomal (fractions 8–9) and total (fractions 4–9) mRNA levels (fold change polysome/fold change total) measured by qPCR. Data are means ± SD from n = 3 independent experiments. Statistically significant differences were calculated by unpaired t-test of each variant versus the WT.

References

    1. Torgerson T., Ochs H.. Genetics of primary immune deficiencies. Stiehm's Immune Defic. 2014; 2014:73–81.
    1. Han X., Chen S., Flynn E., Wu S., Wintner D., Shen Y.. Distinct epigenomic patterns are associated with haploinsufficiency and predict risk genes of developmental disorders. Nat. Commun. 2018; 9:2138. - PMC - PubMed
    1. Huang N., Lee I., Marcotte E.M., Hurles M.E.. Characterising and predicting haploinsufficiency in the human genome. PLoS Genet. 2010; 6:e1001154. - PMC - PubMed
    1. Dang V.T., Kassahn K.S., Marcos A.E., Ragan M.A.. Identification of human haploinsufficient genes and their genomic proximity to segmental duplications. Eur. J. Hum. Genet. 2008; 16:1350–1357. - PubMed
    1. Lek M., Karczewski K.J., Minikel E.V., Samocha K.E., Banks E., Fennell T., O’Donnell-Luria A.H., Ware J.S., Hill A.J., Cummings B.B.et al. .. Analysis of protein-coding genetic variation in 60,706 humans. Nature. 2016; 536:285–291. - PMC - PubMed

Publication types