. 2022 Dec 2;12(12):2774-2799.
doi: 10.1158/2159-8290.CD-22-0192.

Stromal Reprogramming by FAK Inhibition Overcomes Radiation Resistance to Allow for Immune Priming and Response to Checkpoint Blockade

Affiliations

Stromal Reprogramming by FAK Inhibition Overcomes Radiation Resistance to Allow for Immune Priming and Response to Checkpoint Blockade

Varintra E Lander et al. Cancer Discov. .

Abstract

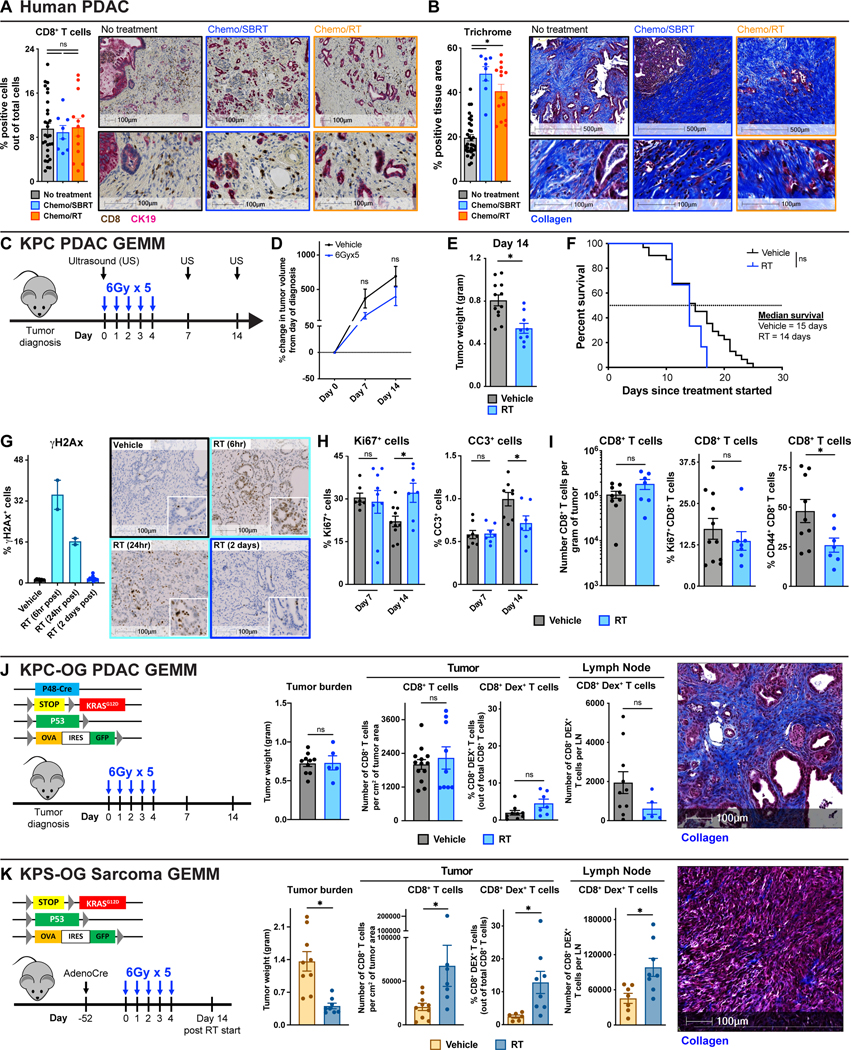
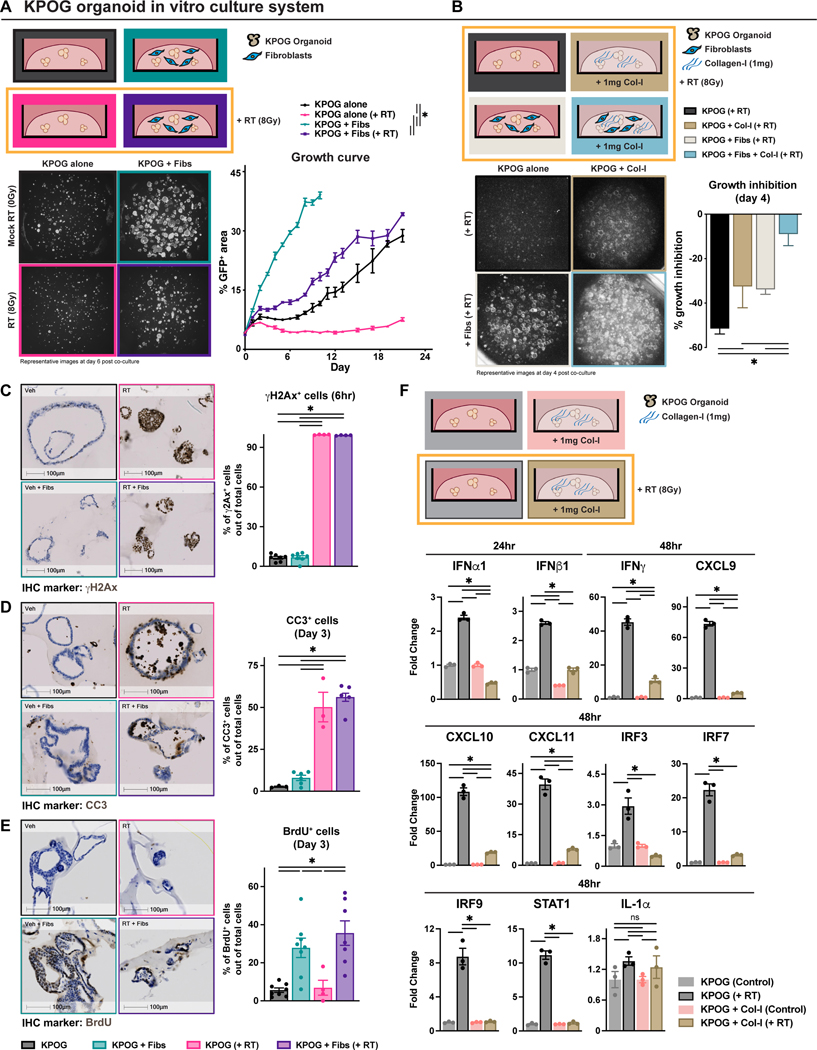
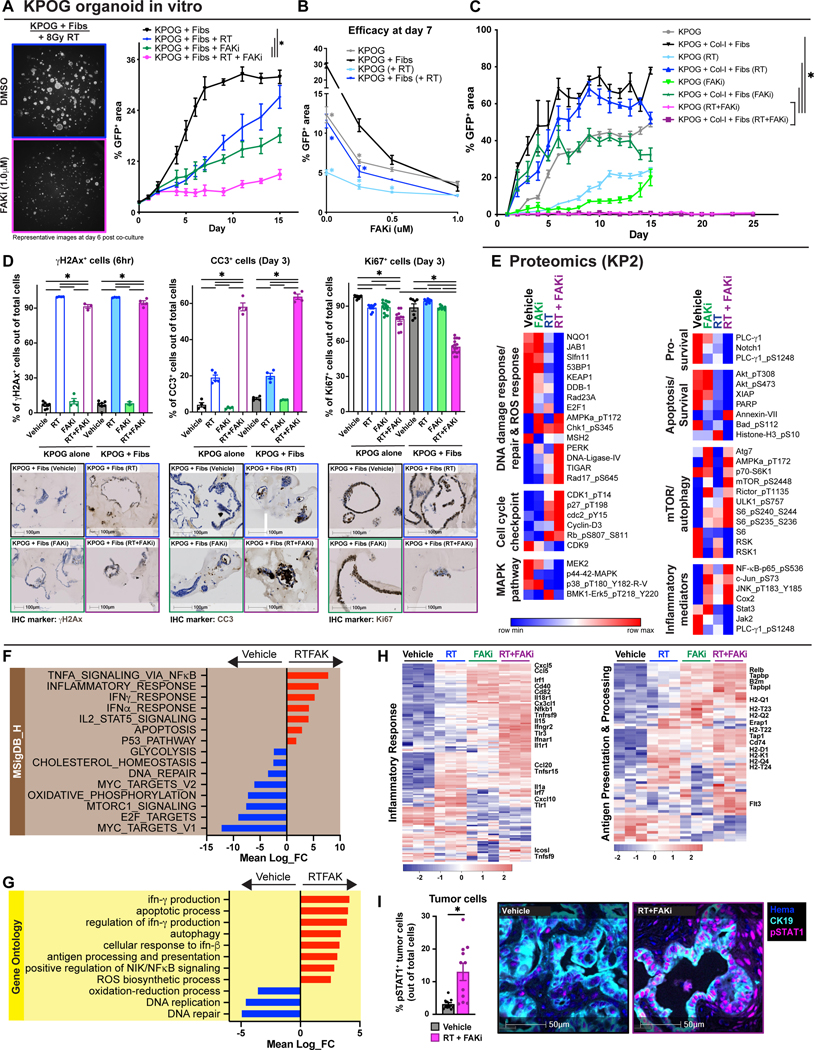
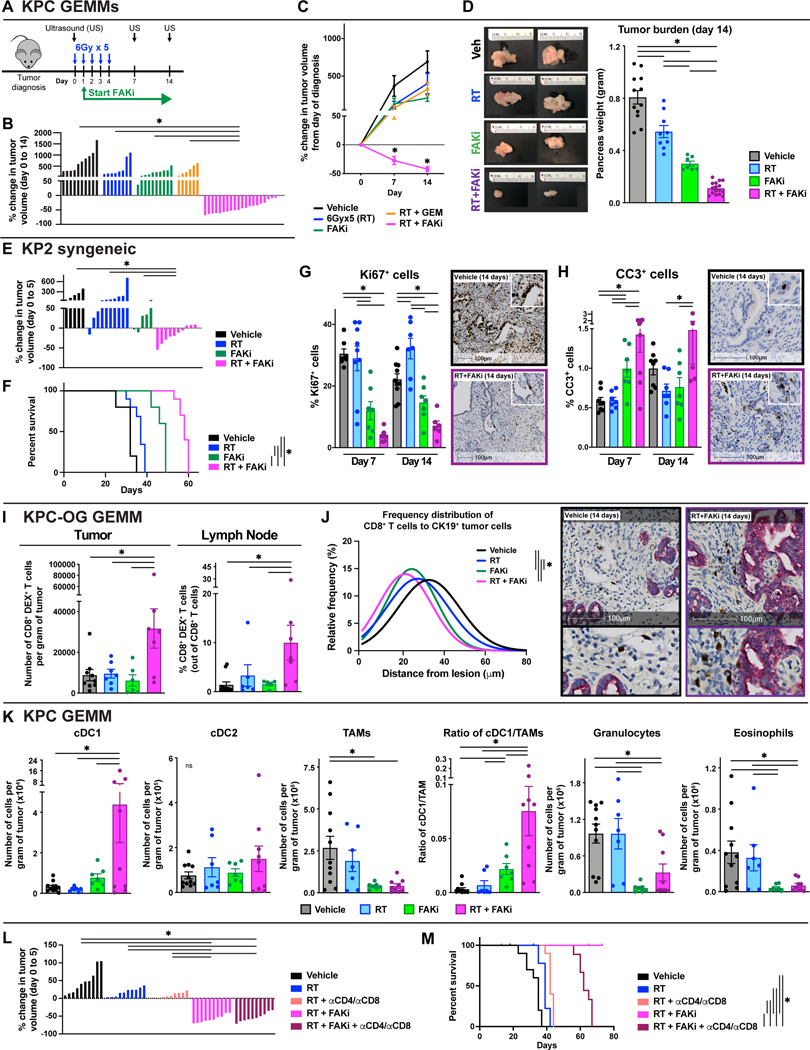
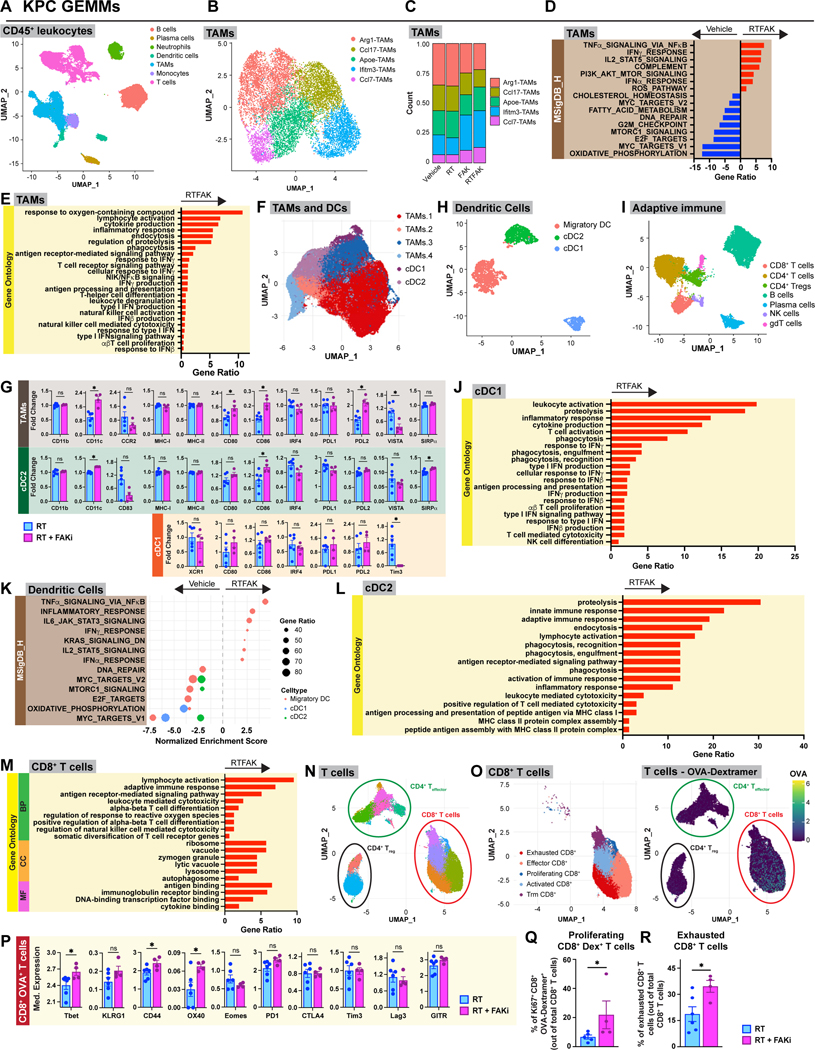
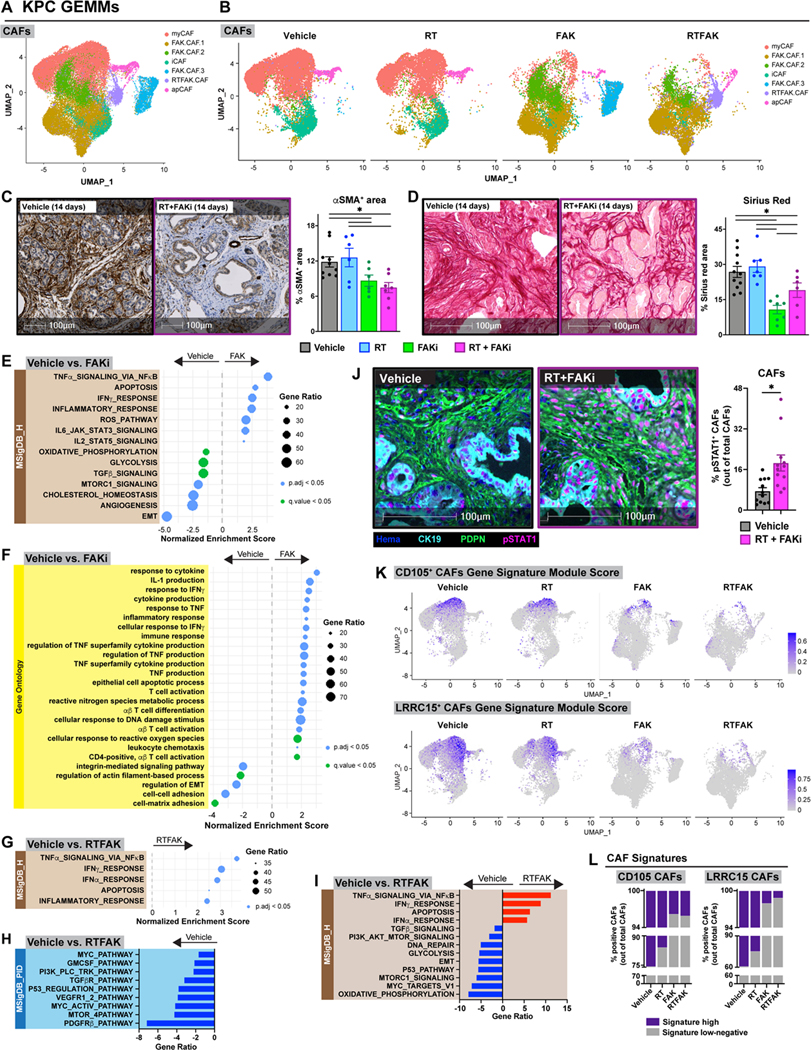
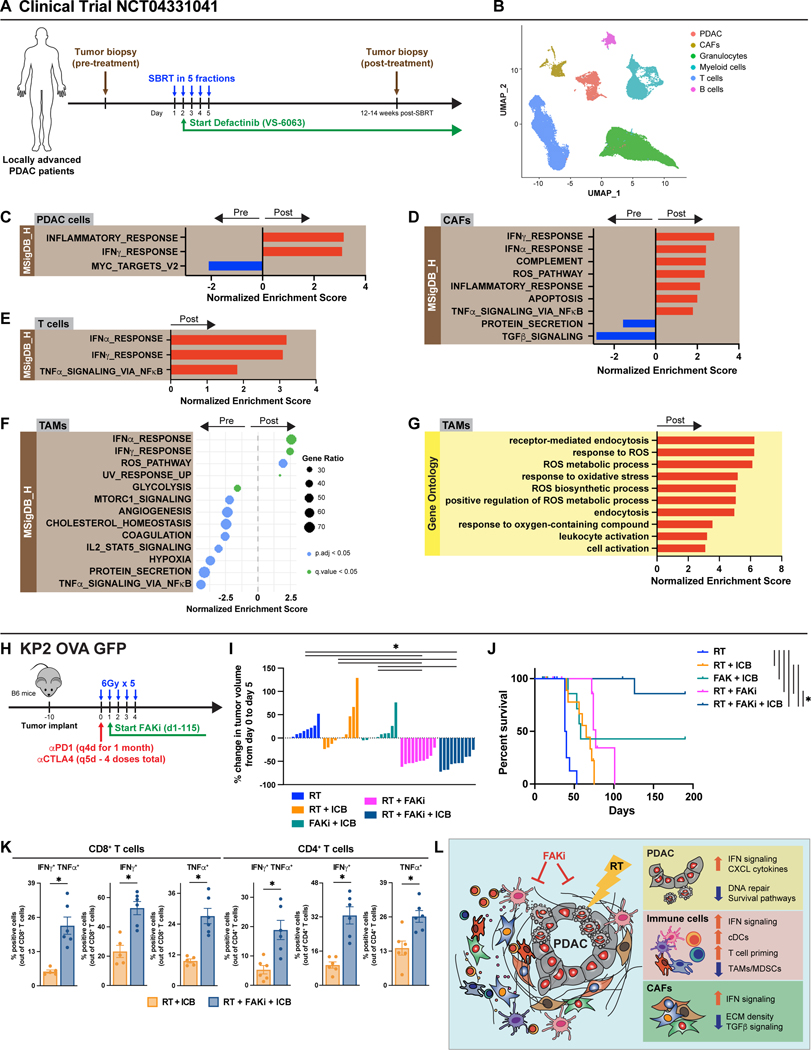
The effects of radiotherapy (RT) on tumor immunity in pancreatic ductal adenocarcinoma (PDAC) are not well understood. To better understand if RT can prime antigen-specific T-cell responses, we analyzed human PDAC tissues and mouse models. In both settings, there was little evidence of RT-induced T-cell priming. Using in vitro systems, we found that tumor-stromal components, including fibroblasts and collagen, cooperate to blunt RT efficacy and impair RT-induced interferon signaling. Focal adhesion kinase (FAK) inhibition rescued RT efficacy in vitro and in vivo, leading to tumor regression, T-cell priming, and enhanced long-term survival in PDAC mouse models. Based on these data, we initiated a clinical trial of defactinib in combination with stereotactic body RT in patients with PDAC (NCT04331041). Analysis of PDAC tissues from these patients showed stromal reprogramming mirroring our findings in genetically engineered mouse models. Finally, the addition of checkpoint immunotherapy to RT and FAK inhibition in animal models led to complete tumor regression and long-term survival.

Significance: Checkpoint immunotherapeutics have not been effective in PDAC, even when combined with RT. One possible explanation is that RT fails to prime T-cell responses in PDAC. Here, we show that FAK inhibition allows RT to prime tumor immunity and unlock responsiveness to checkpoint immunotherapy. This article is highlighted in the In This Issue feature, p. 2711.


Conflict of interest statement

The authors declare no potential conflicts of interest.

Figures

Figure 1:
Figure 1:. Radiation therapy is insufficient to optimally prime robust T cell responses in PDAC
(A-B) Analysis of CD8α T cell number and collagen density in surgical resection samples from patients who received neoadjuvant Chemo/SBRT, Chemo/RT, or no neoadjuvant therapy. Representative CD8α/CK19 IHC and Trichrome images and quantification are depicted. n = 8–32 patients/group. (C) Schematic of RT administration and tumor burden monitoring in KPC GEMMs. KPC mice diagnosed with ultrasound (US) were treated with hypofractionated RT (6Gy x 5) and longitudinally assessed for tumor burden. (D) Tumor growth kinetics of vehicle and RT-treated KPC mice from (C) quantified by US measurements. n = 8–12 mice/group. (E) Day 14 pancreas weight of KPC mice from (C). n = 9–13 mice/group. (F) Kaplan-Meier survival curve of KPC mice from (C). n = 6–31 mice/group. (G) Analysis of DNA damage (γH2Ax) on tissues from KPC vehicle or RT-treated mice at various time points. Representative γH2Ax IHC images are depicted. n = 2–10 mice/group (H) IHC analysis of proliferation (Ki67) and apoptosis (CC3) on tissues from KPC mice at days 7 and 14 post-RT. n = at least 7 mice/group. (I) Flow cytometry quantification of total CD8+ T cells and percentage of Ki67+ or CD44+ CD8+ T cells out of total CD8+ T cells in KPC vehicle or RT-treated mice at day 14. n = at least 7 mice/group. (J) Genetic loci for KPC-OG PDAC GEMMs and schematic of RT administration. Pancreas weight of KPC-OG vehicle or RT-treated mice. IHC analysis of CD8α T cell number from KPC-OG vehicle or RT-treated mice. Flow cytometry quantification of total CD8+ OVA-Dextramer+ tumor-specific T cells from tumor and pancreas draining lymph nodes in KPC-OG vehicle or RT-treated mice. Representative Trichrome image from KPC-OG vehicle-treated mice is depicted. All analyses were done at day 14 post-RT start. n = at least 6 mice/group. (K) Genetic loci for KPS-OG sarcoma GEMMs and schematic of AdenoCre injection and RT administration. Tumor weight of KPS-OG vehicle or RT-treated mice. IHC analysis of CD8α T cell number from KPS-OG vehicle or RT-treated mice. Flow cytometry quantification of total CD8+ OVA-Dextramer+ tumor-specific T cells from tumor and draining lymph nodes in KPS-OG vehicle or RT-treated mice. Representative Trichrome image from KPS-OG vehicle-treated mice is depicted. All analyses were done at day 14 post-RT start. n = at least 7 mice/group. All graphs depict mean +/− SEM. For comparisons between two groups, “*” denotes p < 0.05 by two-tailed t-test, one-way ANOVA, or Kaplan-Meier as appropriate. “ns” denotes not significant.
Figure 2:
Figure 2:. Stromal elements repress RT efficacy and induction of interferons
(A) Experimental schematic of KPOG organoids co-cultured with fibroblasts. Cells were cultured for one day before RT. Representative GFP images taken with a fluorescent microscope at day 6 post co-culture. Tumor growth analysis of KPOG organoids tracked overtime. n = at least 3/group. (B) Experimental schematic of KPOG organoids co-cultured with fibroblasts and collagen-I. Cells were cultured for one day before RT. Representative fluorescent images and quantification of tumor growth inhibition at day 4. n = at least 3/group. (C) IHC analysis and representative images of γH2Ax in KPOG organoid cultures at 6 hours post-RT. n = at least 3 sets/group. (D-E) IHC analysis and representative images of CC3 (D) and 5hr-pulsed BrdU (E) in KPOG organoid cultures at day 3 post-RT. n = at least 3/group. (F) Experimental schematic of KPOG organoids co-cultured with collagen-I. RT-PCR measurements of IFN-related genes measured in KPOG organoid cultures treated with different conditions at the indicated timepoints. n = at least 3/group. All graphs depict mean +/− SEM. “*” denotes p < 0.05 by two-tailed t-test or one-way ANOVA as appropriate. “ns” denotes not significant.
Figure 3:
Figure 3:. Inhibition of Focal Adhesion Kinase overcomes stromal-induced RT resistance
(A) Tumor growth analysis of KPOG organoids co-cultured with fibroblasts treated with RT +/− FAKi. Cells were cultured as in Fig. 2A. Representative fluorescent images at day 6 post co-culture. n = at least 3/group. (B) Growth analysis of KPOG organoids co-cultured with fibroblasts after treatment with RT +/− FAKi at varying concentrations at day 7 post co-culture. n = at least 3/group. (C) Tumor growth analysis of KPOG organoids co-cultured with fibroblasts and collagen-I treated with RT +/− FAKi. n = at least 3/group. (D) IHC analysis of γH2Ax in KPOG organoid cultures taken 6 hours post-RT. IHC analysis of CC3 and Ki67 in KPOG organoid cultures taken 3 days post-RT. Representative γH2Ax, CC3, and Ki67 IHC images are depicted. n = at least 3/group. (E) RPPA analysis heatmap displaying expression level of proteins related to: (i) DNA damage response/repair and ROS response, (ii) cell cycle checkpoint, (iii) MAPK pathway, (iv) pro-survival, (v) apoptosis/survival, (vi) mTOR/autophagy, and (vii) inflammatory mediators. Proteins were taken from KP2 cells at 24 hours post-RT. n = at least 3/group. (F-G) Bar graphs displaying over-representation analysis of KPOG organoids differentially expressed genes (DEGs) in Molecular Signatures Database (MSigDB)_Hallmark (F) and Gene Ontology (GO) (G) gene sets. All graphs display comparisons of vehicle to RT+FAKi-treated cells. All pathways were filtered with p value < 0.05. (H) Heatmap displaying expression level of genes in MSigDB_Hallmark database for “inflammatory response” and in GO database for “antigen processing and presentation”. (I) mIHC analysis of CK19+ pSTAT1+ cells in tissues of KPC mice from Fig. 4A. Representative CK19 and pSTAT1 fused mIHC images are depicted. n = at least 6 mice/group. All graphs depict mean +/− SEM. “*” denotes p < 0.05 by two-tailed t-test or one-way ANOVA as appropriate.
Figure 4:
Figure 4:. Combining FAKi with RT leads to immune priming in-vivo
(A) Schematic of RT (6Gy x 5) and FAKi (75mg/kg BID) administration and tumor burden monitoring in KPC GEMMs. KPC mice diagnosed with US were treated and longitudinally assessed for tumor burden. (B) Waterfall plot of KPC GEMMs from (A) evaluating tumor growth difference from day 0 to 14 by US measurement. Gemcitabine (GEM) was given at a dose of 75mg/kg every 5 days starting at day 0. n = 6–20 mice/group. (C) Tumor growth kinetics of KPC mice from (B) quantified by US measurements. n = 6–20 mice/group. (D) Day 14 pancreas weight of KPC mice from (A). Representative gross tissue images are depicted. n = 6–20 mice/group. (E) Waterfall plot of KP2 syngeneic tumor-bearing mice treated as depicted in (A) evaluating tumor growth difference from day 0 to 5. n = 5–10 mice/group. (F) Kaplan-Meier survival curve of KP2 syngeneic tumor-bearing mice from (G). n = 5–10 mice/group. (G-H) IHC analysis of Ki67 (G) and CC3 (H) in tissues from KPC mice at days 7 and 14 post-treatment start. Representative Ki67 and CC3 IHC images are depicted. n = at least 7 mice/group. (I) Flow cytometry quantification of total CD8+ OVA-Dextramer+ T cells in tumor and pancreas draining lymph node from KPC-OG mice treated as in (A). n = at least 7 mice/group. (J) Frequency distribution of CD8+ T cell proximity to nearest CK19+ tumor cell in KPC-OG mice treated as indicated. Representative dual stained CD8α and CK19 images are depicted. n = at least 5 mice/group. (K) Flow cytometry quantification of various innate immune infiltrates: (i) cDC1 (CD45+ CD3 CD19 Ly6C Ly6G F4/80lo MHC-IIhi CD24hi CD103+), (ii) cDC2 (CD45+ CD3 CD19 Ly6C Ly6G F4/80lo MHC-IIhi CD24lo CD11b+), (iii) TAMs (CD45+ CD3 CD19 Ly6C Ly6G CD11b+ F4/80+ MHC-II+), (iv) granulocytes (CD45+ CD3 CD19 Ly6C Ly6G+), and (v) eosinophils (CD45+ CD3 CD19 Ly6C Ly6G CD11b+ F4/80 MHC-II) in KPC mice from (A). n = at least 7 mice/group. (L) Waterfall plot of KP2 syngeneic tumor-bearing mice treated as in (A) evaluating tumor growth difference from day 0 to 5. Depleting αCD4 and αCD8 IgGs were given starting at day −2 every 4 days for a total of 30 days. n = 10 mice/group. (M) Kaplan-Meier survival curve of KP2 syngeneic tumor-bearing mice from (L). n = 10 mice/group. All graphs depict mean +/− SEM. “*” denotes p < 0.05 by two-tailed t-test or one-way ANOVA or Kaplan-Meier as appropriate. “ns” denotes not significant.
Figure 5:
Figure 5:. Tumor-infiltrating immune cells from RT+FAKi treated mice have better anti-tumor signatures
(A) UMAP dimensionality reduction plot of scRNA-seq data on CD45+ leukocytes from KPC mice at day 14 treated as depicted in Fig. 4A. Annotation shows different cell types. (B) UMAP analysis of TAMs subsets isolated from (A). Five different TAM clusters are depicted. (C) Count ratio of the TAM clusters from (B). (D-E) Bar graph displaying over-representation analysis of DEGs on all the TAMs in (B) to known biological functions in MSigDB_Hallmark (D) and GO databases (E). All graphs display comparisons of vehicle to RT+FAKi-treated mice. All pathways were filtered with p.adj value < 0.05. (F) UMAP dimensionality reduction plot of CyTOF data on TAMs and cDCs from KP2-OVA-GFP tumor-bearing RT and RT+FAKi-treated mice treated as depicted in Fig. 4A. Annotation shows different cell types. (G) Analysis of median expression levels of various markers on the TAMs, cDC1, and cDC2 in (F). n = at least 4 groups of pooled mice/group. (H) UMAP analysis of cDC subsets isolated from (A). Three different cDC clusters are depicted. (I) UMAP dimensionality reduction plot of scRNA-seq data on the adaptive immune cells from KPC mice. Annotation shows different cell types. (J) Bar graph displaying over-representation analysis of DEGs on cDC1 to known biological functions in GO database. All graphs display comparisons of vehicle to RT+FAKi-treated mice. All pathways were filtered with p.adj value < 0.05. (K) Dot plot displaying GSEA results from MSigDB_Hallmark database comparing different cDC clusters from (H). All graphs display comparisons of vehicle to RT+FAKi-treated mice. All pathways were filtered with p.adj value < 0.05. (L) Bar graph displaying over-representation analysis of DEGs on cDC2 to known biological functions in GO database. All graphs display comparisons of vehicle to RT+FAKi-treated mice. All pathways were filtered with p.adj value < 0.05. (M) Bar graph displaying over-representation analysis of DEGs on CD8+ T cells to known biological functions in GO database for Biological Process (BP), Cellular Component (CC), and Molecular Function (MF). All graphs display comparisons of vehicle to RT+FAKi-treated mice. All pathways were filtered with p.adj value < 0.05. (N) UMAP dimensionality reduction plot of CyTOF data on CD8+ and CD4+ T cell populations from KP2-OVA-GFP tumor-bearing RT and RT+FAKi-treated mice. Annotation shows different cell types. (O) UMAP dimensionality reduction plot of CyTOF data on CD8+ T cell populations from (N). Annotation shows five different CD8+ T cell subclusters. OVA-Dextramer expression levels projected onto UMAP plots in (N). (P) Analysis of median expression levels of various markers on CD8+ OVA-Dextramer+ T cells in (O). n = at least 4 groups of pooled mice/group. (Q) Quantification of proliferating CD8+ OVA-Dextramer+ T cells out of total CD8+ T cells from mice treated as indicated. n = at least 4 groups of pooled mice/group. (R) CyTOF quantification analysis of exhausted CD8+ T cells in Fig. 5N. n = at least 4 groups of pooled mice/group. All graphs depict mean +/− SEM. “*” denotes p < 0.05 by two-tailed t-test or one-way ANOVA as appropriate. “ns” denotes not significant.
Figure 6:
Figure 6:. FAKi reshapes CAFs to participate in tumor immunity
(A) UMAP dimensionality reduction plot of scRNA-seq data on CD45 CD31 Epcam PDPN+ FACS-sorted CAFs-enriched from KPC mice at day 14 treated as depicted in Fig. 4A. Annotation shows different cell types. (B) UMAP distribution from (A) split by treatment conditions. (C-D) Analysis of αSMA IHC (C) and collagen density (D) on tissues from KPC mice 14 days post-RT start. Representative αSMA IHC and Sirius Red images are depicted. n = at least 7 mice/group. (E-F) Dot plot displaying GSEA results from MSigDB_Hallmark (E) and GO (F) databases. All graphs display comparisons of CAFs from vehicle to FAKi-treated mice. All pathways were filtered with p.adj value or q value < 0.05. (G-I) Dot plot displaying GSEA results from MSigDB_Hallmark database (G) and bar graphs displaying over-representation analysis of DEGs on CAFs in (A) to known biological functions in MSigDB_PID (H) and MSigDB_Hallmark (I) databases. All graphs display comparisons of CAFs from vehicle mice to RT+FAKi-treated mice. All pathways were filtered with p.adj value < 0.05. (J) mIHC analysis of CK19 PDPN+ pSTAT1+ cells in tissues of KPC mice from Fig. 4A. Representative CK19, PDPN, and pSTAT1 fused mIHC images are depicted. n = at least 6 mice/group. (K) UMAP representation of CD105+ CAFs or LRRC15+ CAFs gene signature module scores mapped onto CAFs in (A-B). (L) Quantification of CAFs in (A) for CD105+ CAFs gene signature or LRRC15+ CAFs gene signature. All graphs depict mean +/− SEM. “*” denotes p < 0.05 by two-tailed t-test or one-way ANOVA as appropriate.
Figure 7:
Figure 7:. FAK inhibition in combination with RT in PDAC patients activates interferon signaling
(A) Schematic of clinical trial (NCT04331041). Patients received SBRT with a total of 50Gy given in 5 fractions. Defactinib (VS-6063) was given at a dose of 400mg BID starting the end of day 2 post-SBRT and continued up to one year. Tissues were obtained pre-treatment and 12–14 weeks post-SBRT. (B) UMAP analysis of eight pre- and post-treatment biopsies from (A). (C) Bar graph displaying GSEA analysis of DEGs on all the PDAC cells in (B) to known biological functions in MSigDB_Hallmark database. All graphs display comparisons of pre-treatment to post-treatment biopsies. All pathways were filtered with p.adj value < 0.05. (D) Bar graph displaying GSEA analysis of DEGs on all the CAFs in (B) to known biological functions in MSigDB_Hallmark database. All graphs display comparisons of pre-treatment to post-treatment biopsies. All pathways were filtered with p.adj value < 0.05. (E) Bar graph displaying GSEA analysis of DEGs on all the T cells in (B) to known biological functions in MSigDB_Hallmark database. All graphs display comparisons of pre-treatment to post-treatment biopsies. All pathways were filtered with p.adj value < 0.05. (F) Dot plot displaying GSEA analysis of DEGs on all the TAMs in (B) to known biological functions in MSigDB_Hallmark database. All graphs display comparisons of pre-treatment to post-treatment biopsies. All pathways were filtered with p.adj value < 0.05 or q value < 0.05. (G) Bar graph displaying GSEA analysis of DEGs on all the TAMs in (B) to known biological functions in and GO database. All graphs display comparisons of pre-treatment to post-treatment biopsies. All pathways were filtered with p.adj value < 0.05. (H) Schematic of RT (6Gy x 5), FAKi (75mg/kg BID), and ICB (αPD1, 200μg and αCTLA4, 200μg) administration in KP2-OVA-GFP tumor-bearing mice. Mice were treated and longitudinally assessed for tumor burden. (I) Waterfall plot of KP2-OVA-GFP tumor-bearing mice from (H) evaluating tumor growth difference from day 0 to 5. n = 10 mice/group. (J) Kaplan-Meier survival curve of KP2-OVA-GFP mice from (H). n = 10 mice/group. (K) Functional assay of CD8+ and CD4+ T cells by flow cytometry from mice treated as in (H). Tumors were isolated at day 10 post the start of treatment. Bar graphs showed quantification of IFNγ ± TNFα positive CD8+ and CD4+ T cells. n = at least 6 mice/group. (L) Graphical abstract of primary findings. For comparison between multiple groups, “*” denotes p < 0.05 by two-tailed t-test, one-way ANOVA, or Kaplan-Meier as appropriate.

References

    1. Cid-Arregui A, Juarez V. Perspectives in the treatment of pancreatic adenocarcinoma. World J Gastroenterol 2015;21(31):9297–316 doi 10.3748/wjg.v21.i31.9297. - DOI - PMC - PubMed
    1. Sarantis P, Koustas E, Papadimitropoulou A, Papavassiliou AG, Karamouzis MV. Pancreatic ductal adenocarcinoma: Treatment hurdles, tumor microenvironment and immunotherapy. World J Gastrointest Oncol 2020;12(2):173–81 doi 10.4251/wjgo.v12.i2.173. - DOI - PMC - PubMed
    1. McGuigan A, Kelly P, Turkington RC, Jones C, Coleman HG, McCain RS. Pancreatic cancer: A review of clinical diagnosis, epidemiology, treatment and outcomes. World J Gastroenterol 2018;24(43):4846–61 doi 10.3748/wjg.v24.i43.4846. - DOI - PMC - PubMed
    1. Hull A, Li Y, Bartholomeusz D, Hsieh W, Allen B, Bezak E. Radioimmunotherapy of Pancreatic Ductal Adenocarcinoma: A Review of the Current Status of Literature. Cancers 2020;12(2) doi 10.3390/cancers12020481. - DOI - PMC - PubMed
    1. Hazard L. The role of radiation therapy in pancreas cancer. Gastrointest Cancer Res 2009;3(1):20–8. - PMC - PubMed

Publication types

Substances