County-Level Social Vulnerability and Breast, Cervical, and Colorectal Cancer Screening Rates in the US, 2018
- PMID: 36166230
- PMCID: PMC9516325
- DOI: 10.1001/jamanetworkopen.2022.33429
County-Level Social Vulnerability and Breast, Cervical, and Colorectal Cancer Screening Rates in the US, 2018
Abstract
Importance: Area-level factors have been identified as important social determinants of health (SDoH) that impact many health-related outcomes. Less is known about how the social vulnerability index (SVI), as a scalable composite score, can multidimensionally explain the population-based cancer screening program uptake at a county level.
Objective: To examine the geographic variation of US Preventive Services Task Force (USPSTF)-recommended breast, cervical, and colorectal cancer screening rates and the association between county-level SVI and the 3 screening rates.
Design, setting, and participants: This population-based cross-sectional study used county-level information from the Centers for Disease Control and Prevention's PLACES and SVI data sets from 2018 for 3141 US counties. Analyses were conducted from October 2021 to February 2022.
Exposures: Social vulnerability index score categorized in quintiles.
Main outcomes and measures: The main outcome was county-level rates of USPSTF guideline-concordant, up-to-date breast, cervical, and colorectal screenings. Odds ratios were calculated for each cancer screening by SVI quintile as unadjusted (only accounting for eligible population per county) or adjusted for urban-rural status, percentage of uninsured adults, and primary care physician rate per 100 000 residents.
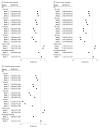
Results: Across 3141 counties, county-level cancer screening rates showed regional disparities ranging from 54.0% to 81.8% for breast cancer screening, from 69.9% to 89.7% for cervical cancer screening, and from 39.8% to 74.4% for colorectal cancer screening. The multivariable regression model showed that a higher SVI was significantly associated with lower odds of cancer screening, with the lowest odds in the highest SVI quintile. When comparing the highest quintile of SVI (SVI-Q5) with the lowest quintile of SVI (SVI-Q1), the unadjusted odds ratio was 0.86 (95% posterior credible interval [CrI], 0.84-0.87) for breast cancer screening, 0.80 (95% CrI, 0.79-0.81) for cervical cancer screening, and 0.72 (95% CrI, 0.71-0.73) for colorectal cancer screening. When fully adjusted, the odds ratio was 0.92 (95% CrI, 0.90-0.93) for breast cancer screening, 0.87 (95% CrI, 0.86-0.88) for cervical cancer screening, and 0.86 (95% CrI, 0.85-0.88) for colorectal cancer screening, showing slightly attenuated associations.
Conclusions and relevance: In this cross-sectional study, regional disparities were found in cancer screening rates at a county level. Quantifying how SVI associates with each cancer screening rate could provide insight into the design and focus of future interventions targeting cancer prevention disparities.
Conflict of interest statement
Figures


