. 2022 Nov 1;132(21):e161188.
doi: 10.1172/JCI161188.

Tick feeding modulates the human skin immune landscape to facilitate tick-borne pathogen transmission

Affiliations

Tick feeding modulates the human skin immune landscape to facilitate tick-borne pathogen transmission

Johanna Strobl et al. J Clin Invest. .

Abstract

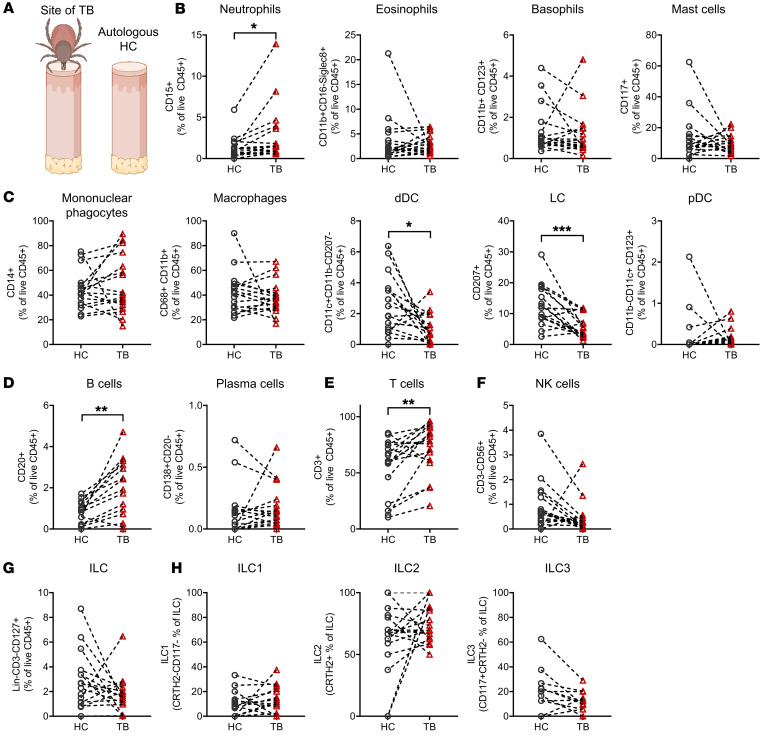
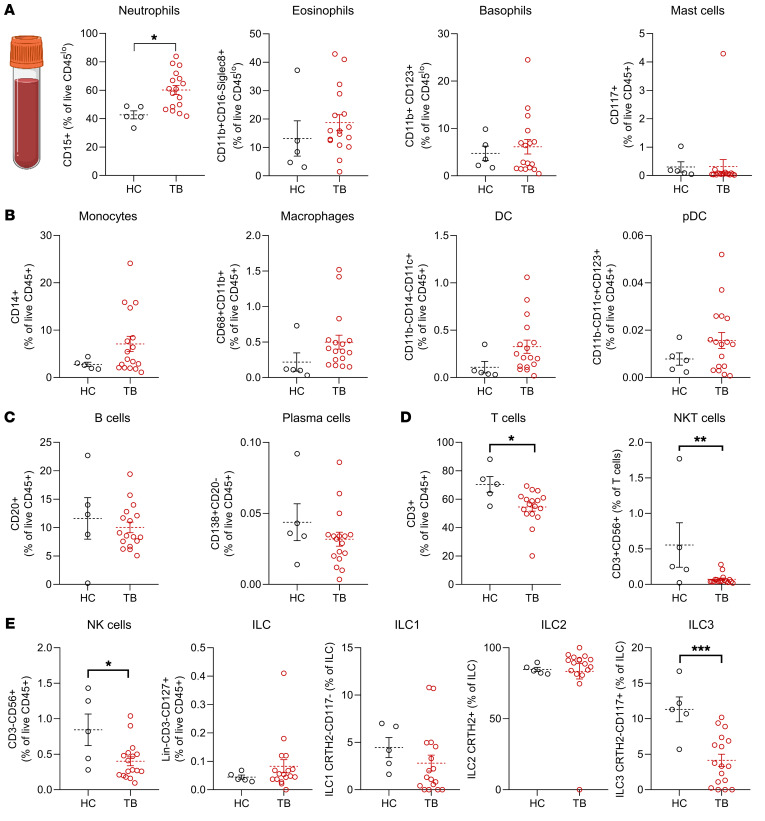
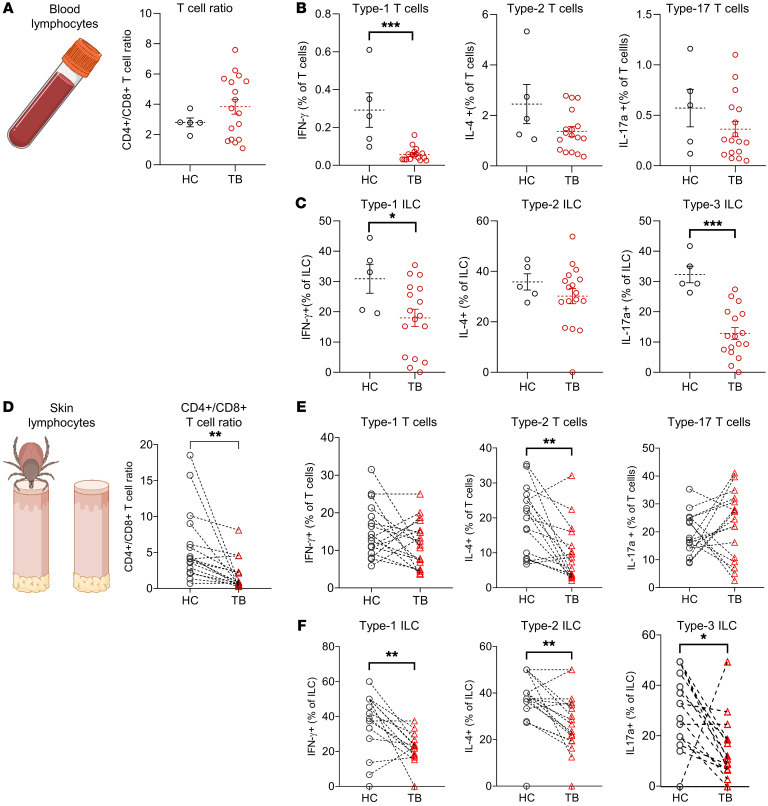
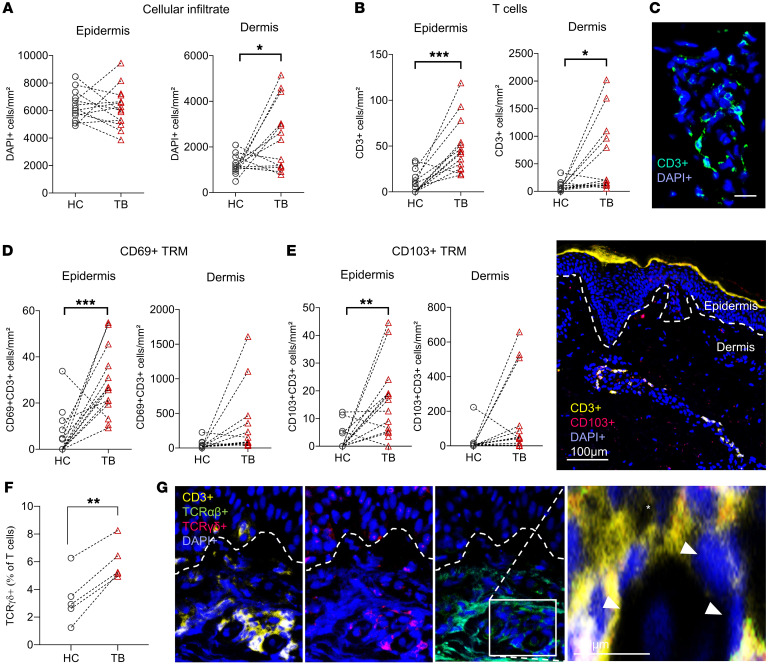
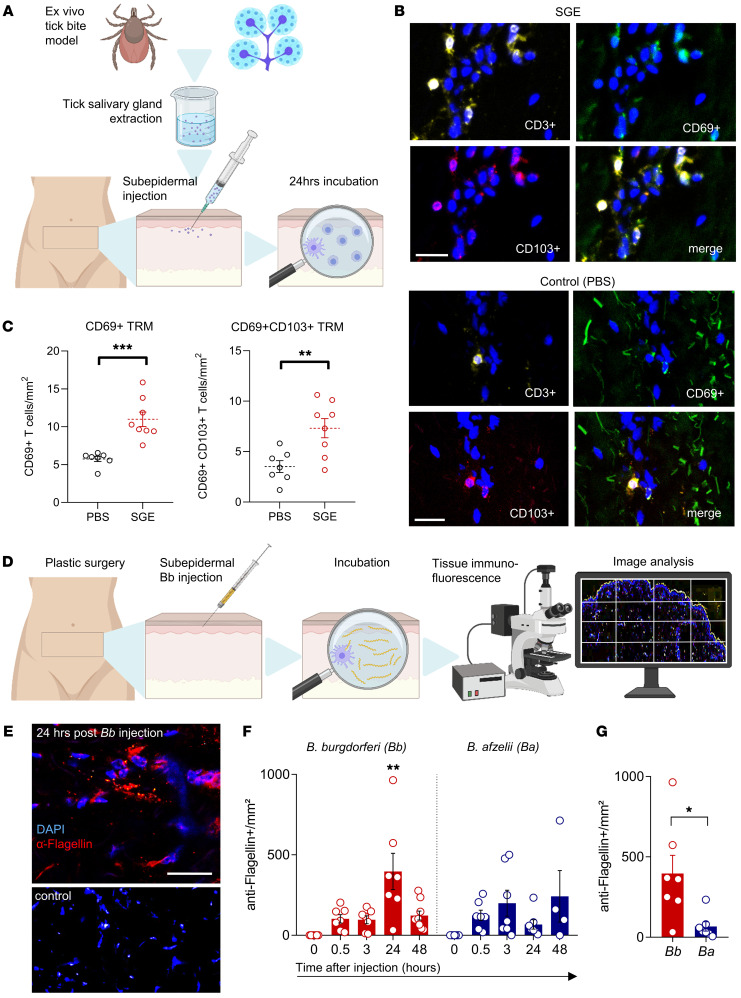
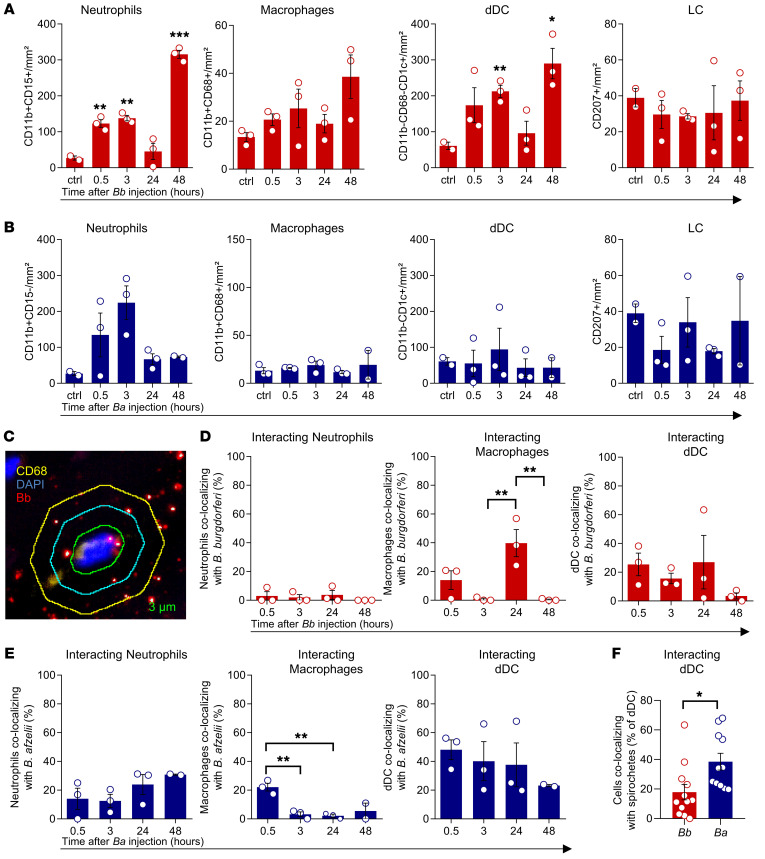
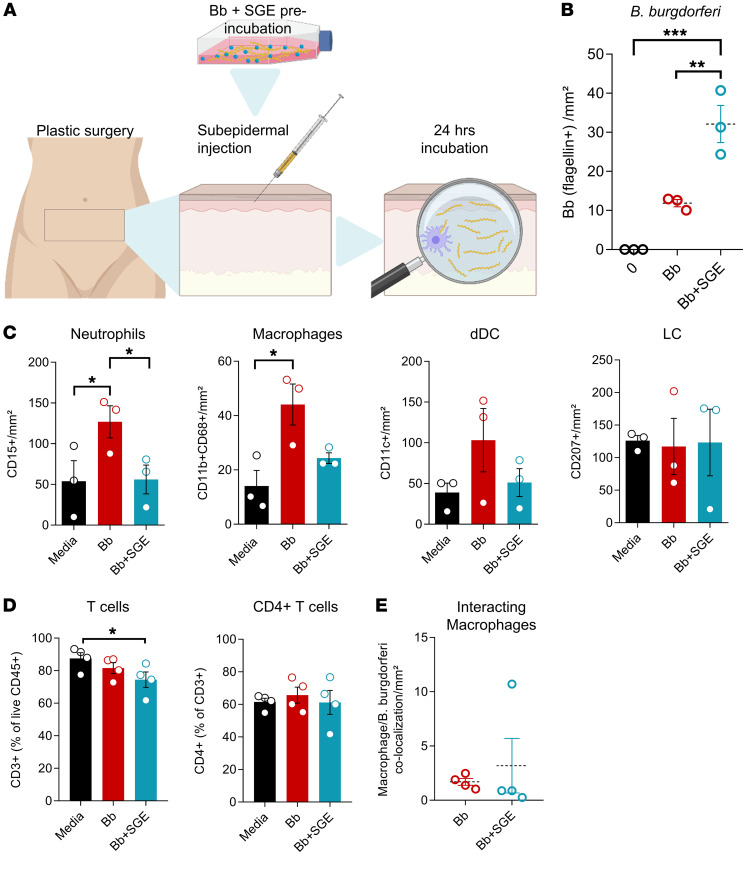
During cutaneous tick attachment, the feeding cavity becomes a site of transmission for tick salivary compounds and tick-borne pathogens. However, the immunological consequences of tick feeding for human skin remain unclear. Here, we assessed human skin and blood samples upon tick bite and developed a human skin explant model mimicking Ixodes ricinus bites and tick-borne pathogen infection. Following tick attachment, we observed rapidly occurring patterns of immunomodulation, including increases in neutrophils and cutaneous B and T cells. T cells upregulated tissue residency markers, while lymphocytic cytokine production was impaired. In early stages of Borrelia burgdorferi model infections, we detected strain-specific immune responses and close spatial relationships between macrophages and spirochetes. Preincubation of spirochetes with tick salivary gland extracts hampered accumulation of immune cells and increased spirochete loads. Collectively, we showed that tick feeding exerts profound changes on the skin immune network that interfere with the primary response against tick-borne pathogens.

Keywords: Adaptive immunity; Immunology; Skin.


Conflict of interest statement

Conflict of interest: JS serves as adjudication committee member for a Pfizer Lyme disease vaccination study. MM is an unpaid member of the Executive Committee of ESGBOR, the ESCMID Study Group for Lyme Borreliosis, and discloses serving as consultant for Pfizer unrelated to this study.

Figures

Figure 1
Figure 1. Skin biopsies of tick feeding sites show changes in the immune cell composition in human skin.
(A) Illustration of sampling sites. (BH) Percentages of neutrophils, eosinophils, basophils, mast cells (B), mononuclear phagocytes, macrophages, dDCs, LCs, pDCs (C), B cells, plasma cells (D), T cells (E), NK cells (F), and ILCs (G) among live cells and ILC subsets (H) in TB and autologous HC. Data shown as percentage of live CD45+ cells (BG) and percentage of CRTH2CD117 (ILC1), CRTH2+CD117 (ILC2), and CRTH2CD117+ (ILC3) (H) among ILCs in TB and HC. In AH, 1 dot represents one patient, and dotted lines connect interindividual samples (n = 16). Statistical analysis was performed by paired Student’s t test. *P < 0.05, **P < 0.01, ***P < 0.001.
Figure 2
Figure 2. Peripheral blood lymphocyte populations in individuals after tick bite differ from those of healthy individuals.
(AE) Percentages of neutrophils, monocytes, eosinophils, basophils, mast cells (A), DCs, monocytes, macrophages, pDCs (B), B cells, plasma cells (C), T cells (D), and CD56+CD3 NK cells and CD127+LineageCD3 ILCs (E) among live CD45+ cells in blood of individuals affected by TB and HC. Data shown as mean percentage of live CD45+ cells, except percentages of CRTH2CD117 (ILC1), CRTH2+CD117 (ILC2), and CRTH2CD117+ (ILC3) (E) among ILCs in blood from TB and HC. In AE, 1 dot represents 1 patient (TB, n = 16; HC, n = 5). Error bars indicate SEM. Statistical analysis was performed by unpaired Student’s t test. *P < 0.05, **P < 0.01, ***P < 0.001.
Figure 3
Figure 3. Intracellular cytokine staining reveals impaired T cell and ILC responses in skin and blood after tick bite.
(A) Ratio of CD4+/CD8+ T cells among T cells isolated from blood of TB (n = 16) and HC (n = 5). (B and C) Frequencies of cells expressing IL-4, IL-17a, and IFN-γ among T cells (B) and ILCs (C) in blood from TB (n = 16) and HC (n = 5) upon stimulation with PMA and ionomycin. (D) Ratio of CD4+/CD8+ T cells among skin T cells isolated from the site of TB and autologous HC skin (n = 16). (E and F) Frequencies of cells expressing IL-4, IL-17a, and IFN-γ among T cells (E) and ILCs (F) in TB skin and autologous HC (n = 16) upon stimulation with PMA and ionomycin. One symbol represents one patient, and dotted lines connect intraindividual samples. Data are presented as mean ± SEM. Statistical analysis was performed with unpaired (AC) or paired (DF) Student’s t test. *P < 0.05, **P < 0.01, ***P < 0.001.
Figure 4
Figure 4. Skin sections of clinical and experimental tick bites harbor increased numbers of tissue-resident memory T cells.
(AC) Lymphocytic infiltrate in TB (n = 11) and intraindividual HC samples (n = 11) as determined by immunolabeling of DAPI+ cells (A) and CD3 (B). Data shown as cell number per mm2 in dermis and epidermis. (C) Representative image of a CD3+ and DAPI-counterstained TB skin sample. Scale bar: 20 μm. (D and E) TRMs in TB (n = 11) and intraindividual HC samples (n = 11), CD69+ T cells (D), and CD103+ T cells (E). Data shown as cell number per mm2 in dermis and epidermis. (E) Right panel: Representative image of dermal and epidermal TRMs in TB skin. Scale bar: 100 μm. (F) Quantification of TCRγδ+ T cells in HC and TB skin (n = 4). Data shown as percentage of T cells (CD3+). (G) Representative image of DAPI, CD3, TCRαβ, and TCRγδ immunofluorescence staining (×20 magnification, left panels) in TB and HC skin and magnification (right panel). Arrows indicate TCRγδ+ T cells and asterisk shows TCRαβ positivity. Scale bar: 20 μm. In AF, statistical analysis was performed using paired Student’s t test. **P < 0.01, ***P < 0.001.
Figure 5
Figure 5. Early steps of tick-borne pathogen transmission are mimicked in an ex vivo human skin tick bite model.
(A) Illustration of the ex vivo TB model in human skin. (B) Representative images of CD3-, CD69-, and CD103-immunolabeled and DAPI-counterstained skin injected with either SGE or PBS control. Scale bar: 20 μm. (C) CD69+ and CD69+CD103+ tissue-resident T cells per mm2 as determined by immunolabeling in skin injected with SGE (n = 8) or PBS (n = 7). (D) Illustration of the ex vivo Bb (Borrelia burgdorferi B31 strain) infection model. (E) Representative image of Bbsl-specific anti-flagellin and DAPI counterstaining in skin 24 hours after injection of Bb or culture media control. Scale bar: 50 μm. (F) Number of Bbsl-specific flagellin+ spirochetes per mm2 in skin cryosections before and after injection of Bb (n = 7) spirochetes or Borrelia afzelii, PKO strain (Ba, n = 7). Number of injected spirochetes: 1 × 10⁵/sample. Data shown as mean spirochete number/mm² at 0, 0.5, 3, 24, and 48 hours after injection. (G) Infection load (spirochetes per mm2) after Bb versus Ba injection. In C, F, and G, data are presented as mean ± SEM. Each dot represents the mean of 2 technical replicates. Statistical analysis was performed by unpaired Student’s t test (C and G) or 1-way ANOVA (F). *P < 0.05; **P < 0.01; ***P < 0.001.
Figure 6
Figure 6. Early Bb model infection is accompanied by a strain-dependent influx of neutrophils and dDCs.
(A and B) Percentage of neutrophils (CD11b+CD15+, n = 3), macrophages (CD15CD11b+CD68+), dDCs (CD15CD11bCD11c+), and LCs (CD207+) in explanted abdominal skin after injection of Bbsl culture media (ctrl, n = 2) or Bbsl culture media containing Bb (A, n = 3) or Ba spirochetes (B, n = 3). Data shown as mean cell number/mm² 0.5, 3, 24, and 48 hours after injection and ctrl. Each dot represents the mean of 2 technical replicates. (C) Graphical representation of software-based analysis of cell-cell contact after immunostaining. Spirochetes (red/yellow dots) were analyzed for presence within green ring within 3 μm, indicating direct cell contact. (D and E) Percentages of neutrophils, macrophages, and dDCs colocalizing with spirochetes in skin explants injected with Bb (D, n = 3) or Ba (E, n = 3). Each dot represents the mean of 2 technical replicates. (F) Percentage of dDCs colocalizing with spirochetes after injection of Bb versus Ba. In AF, data are presented as mean ± SEM. Statistical analysis was performed by 1-way ANOVA (AE) or unpaired Student’s t test (F). *P < 0.05; **P < 0.01; ***P < 0.001.
Figure 7
Figure 7. Preincubation of spirochetes with tick SGE dampens leukocyte response in the ex vivo skin model.
(A) Illustration of the experimental model. (B) Number of spirochetes per mm2 in skin explants 24 hours after injection with media (0), Bb, or Bb preincubated with SGE (Bb + SGE). (C and D) Neutrophils, macrophages, dDCs, and LCs (C) and T cells and CD4+ T cells (D) per mm2 in skin explants injected with Bb (n = 3), Bb + SGE (n = 3), or cell culture media (n = 3) as determined by immunolabeling. (E) Percentage of macrophages colocalizing with spirochetes in skin explants 24 hours after injection with Bb or Bb + SGE. In BE, data shown as individual data points, borders indicate mean, error bars indicate SEM. Statistical analysis was performed by 1-way ANOVA (BD) or paired Student’s t test (E). *P < 0.05; **P < 0.01; ***P < 0.001.

Similar articles

Cited by

References

    1. Grochowska A, et al. Comparison of tick-borne pathogen prevalence in Ixodes ricinus ticks collected in urban areas of Europe. Sci Rep. 2020;10(1):6975. doi: 10.1038/s41598-020-63883-y. - DOI - PMC - PubMed
    1. Boulanger N, et al. Ticks and tick-borne diseases. Med Mal Infect. 2019;49(2):87–97. doi: 10.1016/j.medmal.2019.01.007. - DOI - PubMed
    1. European Centre for Disease Prevention and Control and European Food Safety Authority. Tick maps. https://www.ecdc.europa.eu/en/disease-vectors/surveillance-and-disease-d... Updated 13 April 12, 2022. Accessed August 25, 2022.
    1. Riccardi N, et al. Tick-borne encephalitis in Europe: a brief update on epidemiology, diagnosis, prevention, and treatment. Eur J Intern Med. 2019;62:1–6. doi: 10.1016/j.ejim.2019.01.004. - DOI - PubMed
    1. Rubel F, Brugger K. Tick-borne encephalitis incidence forecasts for Austria, Germany, and Switzerland. Ticks Tick Borne Dis. 2020;11(5):101437. doi: 10.1016/j.ttbdis.2020.101437. - DOI - PubMed

Publication types