. 2022 Sep 27;15(753):eabk1147.
doi: 10.1126/scisignal.abk1147. Epub 2022 Sep 27.

Mutations in protein kinase Cγ promote spinocerebellar ataxia type 14 by impairing kinase autoinhibition

Affiliations

Mutations in protein kinase Cγ promote spinocerebellar ataxia type 14 by impairing kinase autoinhibition

Caila A Pilo et al. Sci Signal. .

Abstract

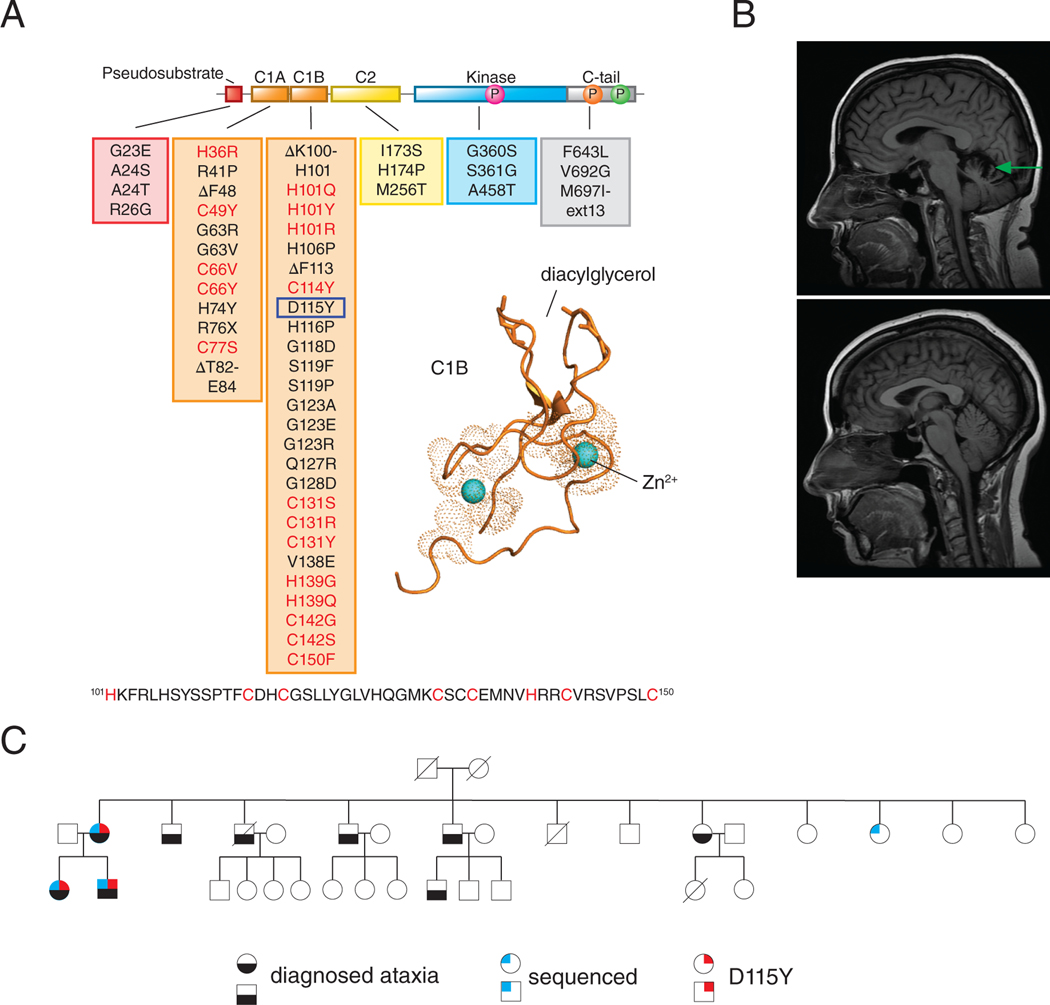
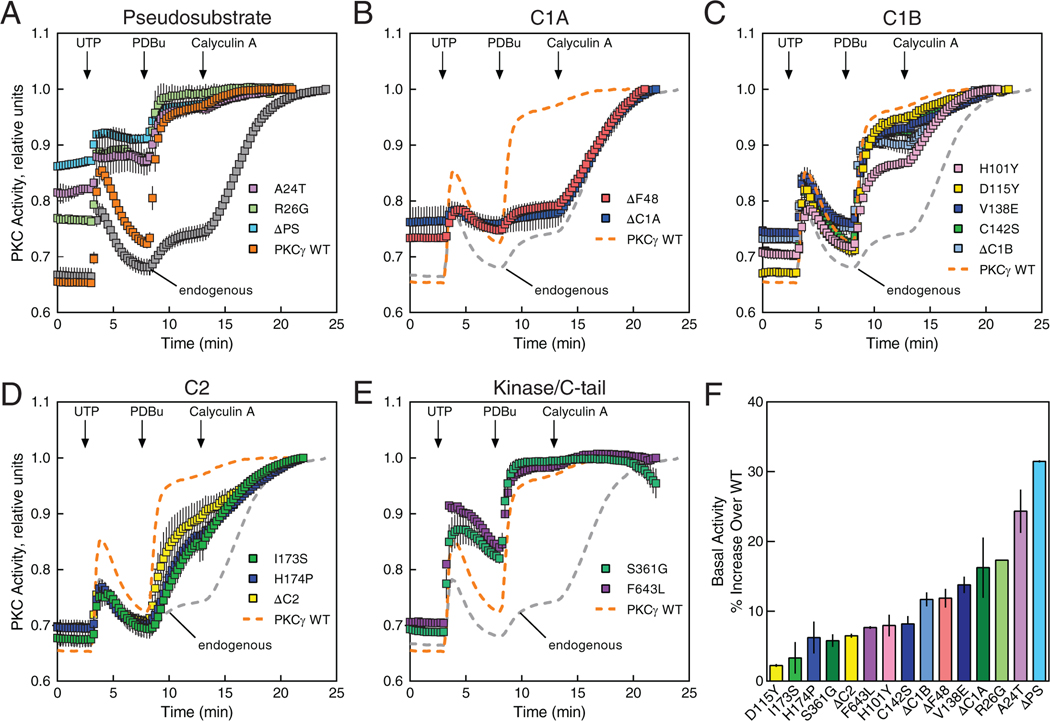
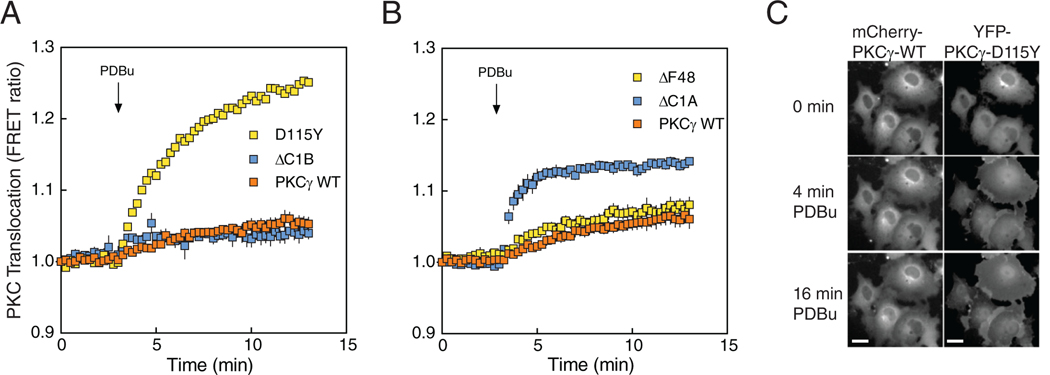
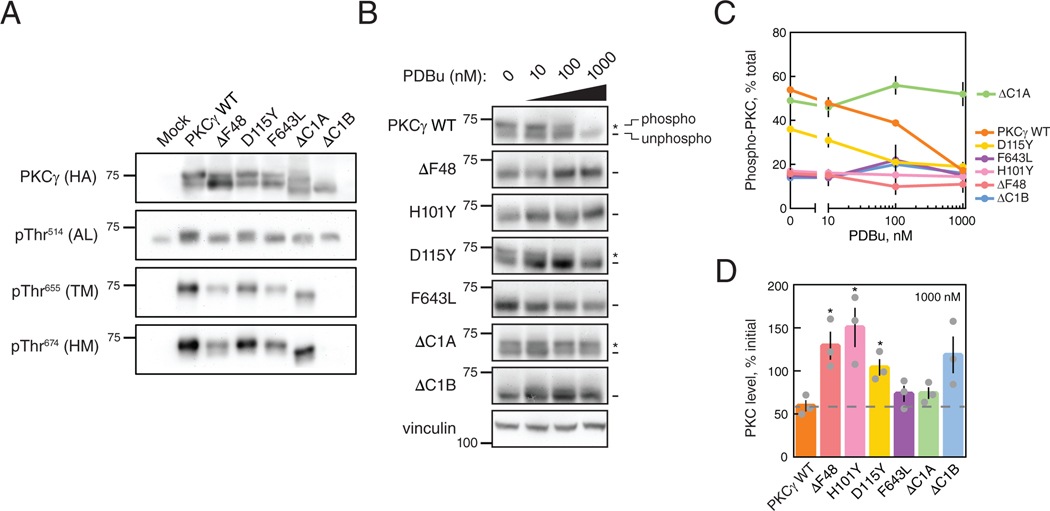
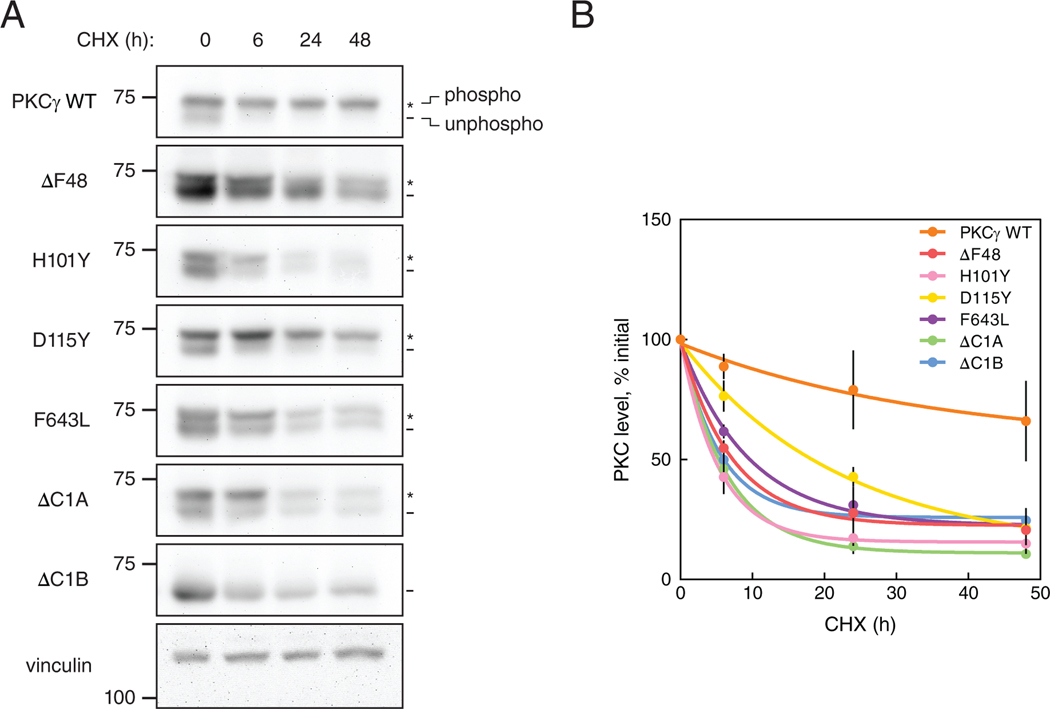
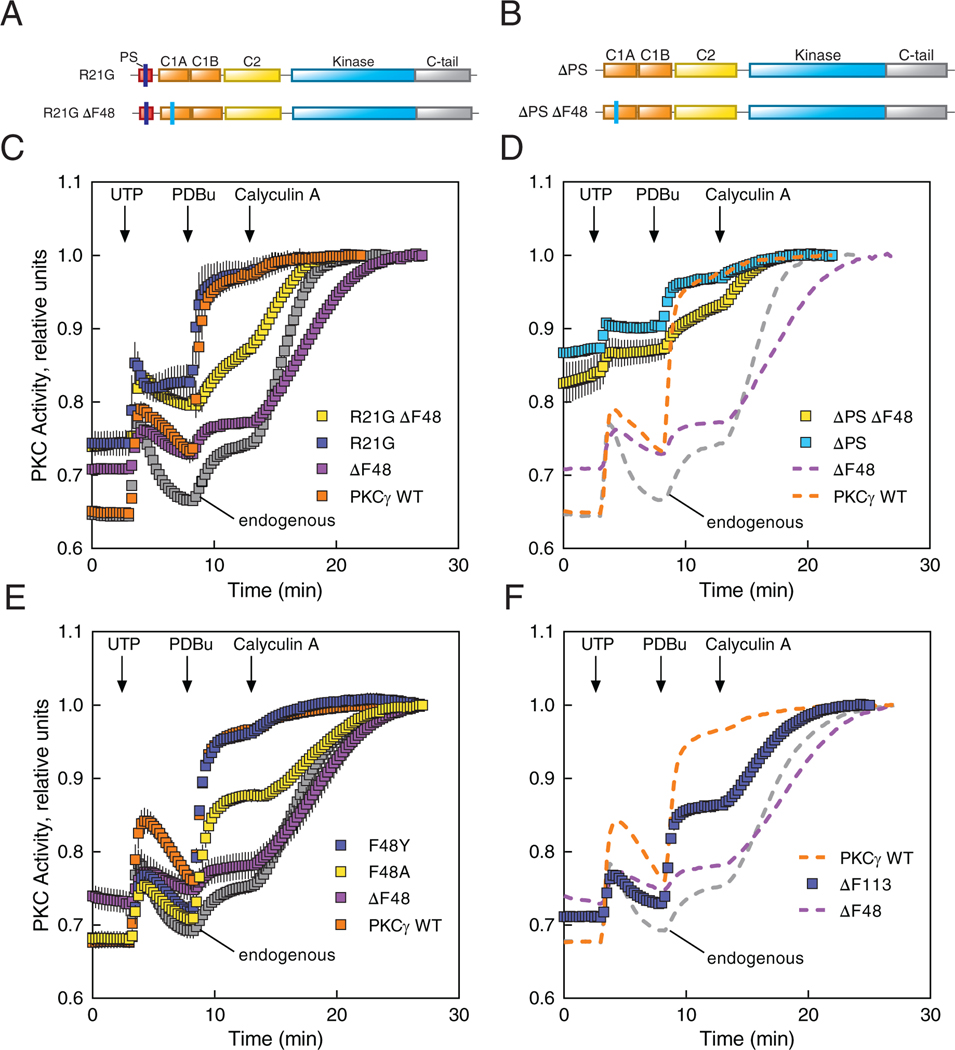
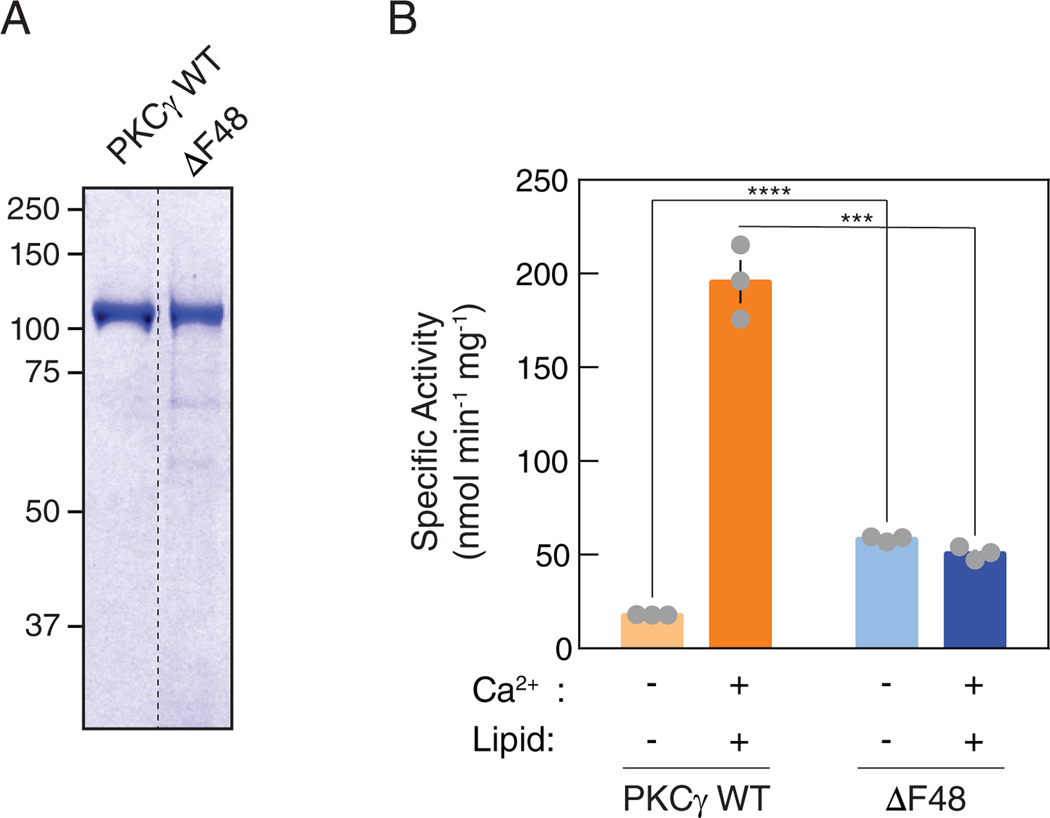
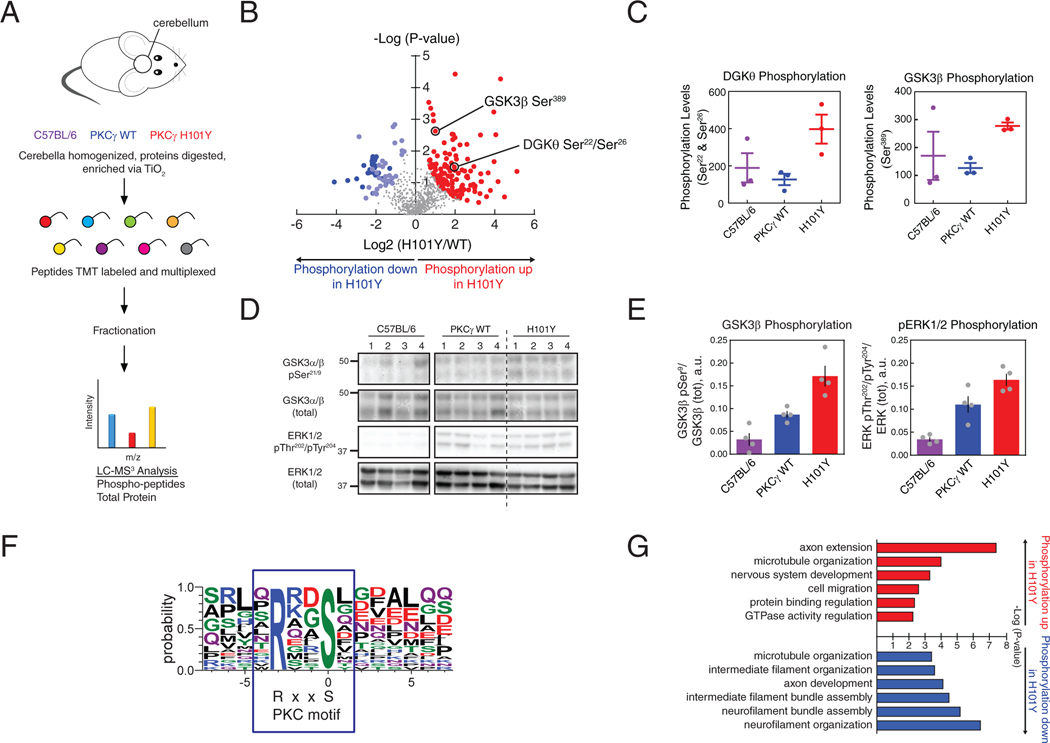
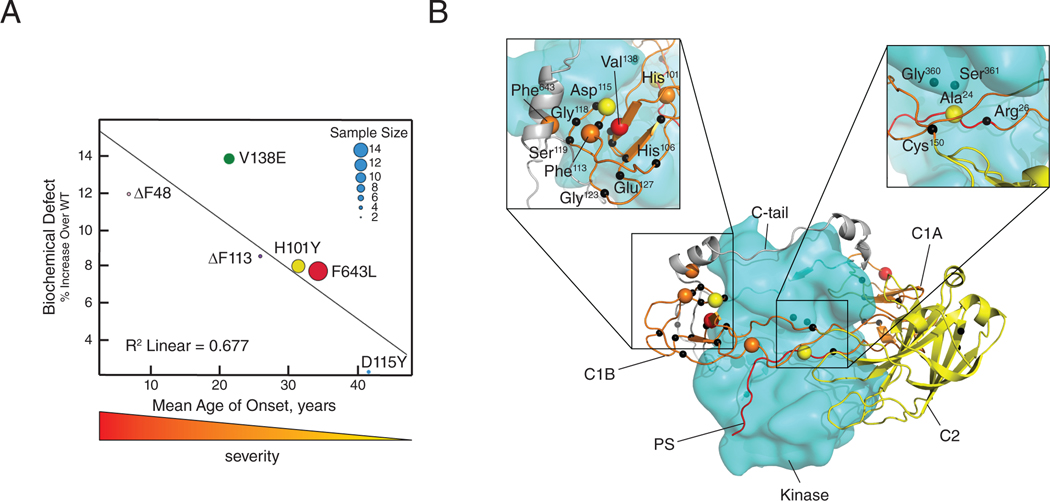
Spinocerebellar ataxia type 14 (SCA14) is a neurodegenerative disease caused by germline variants in the diacylglycerol (DAG)/Ca2+-regulated protein kinase Cγ (PKCγ), leading to Purkinje cell degeneration and progressive cerebellar dysfunction. Most of the identified mutations cluster in the DAG-sensing C1 domains. Here, we found with a FRET-based activity reporter that SCA14-associated PKCγ mutations, including a previously undescribed variant, D115Y, enhanced the basal activity of the kinase by compromising its autoinhibition. Unlike other mutations in PKC that impair its autoinhibition but lead to its degradation, the C1 domain mutations protected PKCγ from such down-regulation. This enhanced basal signaling rewired the brain phosphoproteome, as revealed by phosphoproteomic analysis of cerebella from mice expressing a human SCA14-associated H101Y mutant PKCγ transgene. Mutations that induced a high basal activity in vitro were associated with earlier average age of onset in patients. Furthermore, the extent of disrupted autoinhibition, but not agonist-stimulated activity, correlated with disease severity. Molecular modeling indicated that almost all SCA14 variants not within the C1 domain were located at interfaces with the C1B domain, suggesting that mutations in and proximal to the C1B domain are a susceptibility for SCA14 because they uniquely enhance PKCγ basal activity while protecting the enzyme from down-regulation. These results provide insight into how PKCγ activation is modulated and how deregulation of the cerebellar phosphoproteome by SCA14-associated mutations affects disease progression.


Conflict of interest statement

Competing interests: The authors declare that they have no competing interests.

Figures

Figure 1.
Figure 1.. PKCγ in Spinocerebellar Ataxia Type 14.
(A) Primary structure of PKCγ with all known SCA14 variants indicated in boxes beneath each domain (–27). Newly identified patient variant D115Y is indicated by the blue box. Previously published crystal structure (61) of PKCβII C1B domain is shown with Zn2+ (cyan spheres) and diacylglycerol binding sites labeled (PDB: 3PFQ). Conserved His and Cys residues of Zn2+ finger motif are shown in red in PKCγ primary sequence. (B) MRI of patient at age 46 with D115Y variant (top) compared to age-matched healthy control (bottom); green arrow indicates cerebellar atrophy. (C) Pedigree of family with PKCγ D115Y variant; black shape-fill indicates family members diagnosed with ataxia, blue shape-fill indicate family members that have been sequenced, red shape-fill indicates family members with D115Y variant.
Figure 2.
Figure 2.. SCA14 mutants exhibit impaired autoinhibition compared to WT PKCγ.
(A to E) COS7 cells were transfected with CKAR2 alone (endogenous; gray) or co-transfected with CKAR2 and the indicated mCherry-tagged PKCγ construct: WT PKCγ (orange), a PKCγ lacking a pseudosubstrate (ΔPS), or the indicated pseudosubstrate SCA14 mutants in (A); the ΔC1A or ΔF48 (C1A domain) in (B); the ΔC1B or C1B SCA14 mutants in (C); the ΔC2 or C2 SCA14 mutants in (D); or the kinase-domain and C-tail SCA14 mutants in (E). PKC activity was monitored by measuring FRET/CFP ratio changes after sequential addition of 100 μM UTP, 200 nM PDBu, and 50 nM Calyculin A at the indicated times. Data were normalized to the endpoint (1.0) and show mean ± S.E.M. from at least two independent experiments, N ≥ 17 (A), ≥ 16 (B), ≥ 19 (C), ≥ 11 (D), and ≥ 33 (E) cells per condition. In (B) through (E), the PKCγ WT and endogenous data (dashed lines) are reproduced from (A) for comparison. (F) Quantification of percent increase in basal activity in (A to E) over WT PKCγ.
Figure 3.
Figure 3.. SCA14 mutations affect translocation of PKCγ.
(A) COS7 cells were co-transfected with MyrPalm-CFP and YFP-tagged WT PKCγ (orange), PKCγ D115Y (yellow), or PKCγ ΔC1B (blue). Rate of translocation to plasma membrane was monitored by measuring FRET/CFP ratio changes after addition of 200 nM PDBu. Data were normalized to the starting point (1.0) and are representative of two independent experiments, N ≥ 22 cells per condition. (B) COS7 cells were co-transfected with MyrPalm-CFP and YFP-tagged ΔF48 or ΔC1A. Data are mean ± S.E.M. from at least three independent experiments, N ≥ 23 cells per condition. (C) COS7 cells were co-transfected with mCherry-tagged WT PKCγ and YFP-tagged PKCγ D115Y. Localization of mCherry-PKCγ (WT; left) and YFP-PKCγ-D115Y (right) in the same cells under basal conditions and after addition of 200 nM PDBu was observed by fluorescence microscopy. Images are representative of three independent experiments. Scale bar = 20 μm.
Figure 4.
Figure 4.. SCA14 mutants are resistant to phorbol ester-mediated downregulation.
(A) Western blot of Triton-soluble lysates from COS7 transfected with HA-tagged WT PKCγ, PKCγ lacking a C1A domain (ΔC1A), PKCγ lacking a C1B domain (ΔC1B), the indicated SCA14 mutants, or with empty vector (Mock). Membranes were probed with anti-HA (PKCγ) or phospho- specific antibodies. N = three independent experiments. (B) Western blot of whole-cell lysates from COS7 cells transfected with HA-tagged WT PKCγ, PKCγ lacking a C1B domain (ΔC1B), PKCγ lacking a C1A domain (ΔC1A), or the indicated SCA14 mutants. COS7 cells were treated with the indicated concentrations of PDBu for 24 hours prior to lysis. Endogenous expression of vinculin was also probed as a loading control. N = three independent experiments. *, phosphorylated species; -, unphosphorylated species. (C) Quantification of percent phosphorylation of total PKC as a function of PDBu concentration. Data are mean + S.E.M. (D) Quantification of total levels of PKC with 1000 nM PDBu shown as a percentage of initial levels of PKC (0 nM) and represents mean ± S.E.M. WT levels after 24 hours with 1000 nM PDBu indicated (grey dashed line). *P < 0.05 by Welch’s t-test.
Figure 5.
Figure 5.. SCA14 mutants are more rapidly turned over in the presence of cycloheximide.
(A and B) Western blot analysis of lysates from COS7 cells transfected with HA-tagged WT PKCγ, PKCγ lacking the C1B domain (ΔC1B), PKCγ lacking the C1A domain (ΔC1A), or the indicated SCA14 mutants. COS7 cells were treated with CHX (355 μM) for 0, 6, 24, or 48 hours prior to lysis. Membranes were probed for HA (PKCγ) as well as endogenous expression of vinculin as a loading control. *, phosphorylated species; -, unphosphorylated species. Blot is representative (A) with quantification of total levels of PKCγ at each time point from three independent experiments shown in (B) as a percentage of initial level of PKC (0 hours) and represents mean ± S.E.M. Points were curve fit by non-linear regression.
Figure 6.
Figure 6.. SCA14 mutant ΔF48 displays an abrogated response to agonists.
(A and B) Domain structures of PKCγ constructs containing the mutated pseudosubstrate (R21G) alone or combined with Phe48-deleted (R21G ΔF48) (A), and the pseudosubstrate-deleted (ΔPS) alone or combined with Phe48-deleted (ΔPS ΔF48) (B). (C and D) COS7 cells were transfected with CKAR2 alone (endogenous; gray) or co-transfected with CKAR2 and the indicated mCherry-tagged PKCγ constructs: WT (orange), ΔF48 (purple), or the mutants shown in (A) and (B), respectively. PKC activity was monitored by measuring FRET/CFP ratio changes after addition of 100 μM UTP, 200 nM PDBu, and 50 nM calyculin A. Data were normalized to the endpoint (1.0) and represent mean ± S.E.M. from at least two independent experiments, N ≥ 20 cells per condition. In (D), the PKCγ WT, ΔF48, and endogenous data (dashed lines) are reproduced from (C) for direct comparison purposes. (E and F) COS7 cells were transfected with CKAR2 alone (endogenous) or co-transfected with CKAR2 and the indicated mCherry-tagged PKCγ constructs (E) or the SCA14 mutant ΔF113 (F). PKC activity was monitored, analyzed, and shown as described in (C and D), from at least three independent experiments of N ≥ 49 (E) or 31 (F) cells per condition. In (F), the PKCγ WT, ΔF48, and endogenous data (dashed lines) are reproduced from (E) for direct comparison purposes.
Figure 7.
Figure 7.. Purified ΔF48 exhibits increased activity compared to WT PKCγ under non- activating conditions.
(A) Coomassie Blue-stained SDS-PAGE gel of purified GST-PKCγ WT or ΔF48. (B) In vitro kinase assays of purified GST-PKCγ WT or ΔF48 (6.1 nM per reaction). PKC activity was measured under non-activating conditions (EGTA, absence of Ca2+ or lipids) or activating conditions (presence of Ca2+ and lipids). Data are graphed in nanomoles phosphate per minute per milligram GST-PKC. Data are mean ± S.E.M. from three independent experiments, N = 9 reactions per condition. ***P<0.001, ****P<0.0001 by Holm-Sidak multiple comparison t-tests.
Figure 8.
Figure 8.. Phosphoproteomics analysis from cerebella of mice expressing human WT or H101Y PKCγ transgene.
(A) Experimental design for processing of mouse tissue and proteins. Cerebella from B6 background (purple), PKCγ WT transgenic (blue), and PKCγ H101Y transgenic (red) mice at 6 months of age were subjected to phosphoprotemics analysis. 6893 total proteins were quantified in the standard proteomics and 914 quantifiable phosphopeptides were detected in the phosphoproteomics. After correction for protein expression, 195 phosphopeptides on 166 unique proteins were identified in H101Y-expressing mice. N = 3 mice of C57BL/6, PKCγ WT, PKCγ H101Y. (B) Volcano plot of phosphopeptide replicates of cerebella from WT and H101Y transgenic mice. Graph represents the log-transformed p-values (Student’s t-test) linked to individual phosphopeptides versus the log-transformed fold change in phosphopeptide abundance between WT and H101Y cerebella. Color represents phosphopeptides with significant changes in P-value and fold change; red, increased phosphorylation in H101Y mice; blue, lower phosphorylation in H101Y mice (dark blue indicates significantly decreased neurofilament phosphopeptides, light blue indicates all other significantly decreased phosphopeptides). (C) Graphs representing quantification of either a DGKθ phosphopeptide (left) or a GSK3β phosphopeptide (right) from the volcano plot in (B) in cerebella from C57BL/6 mice (purple), WT mice (blue), and H101Y mice (red). (D and E) Western blotting analysis of Triton-soluble cerebellar tissue lysates from C57BL/6, PKCγ WT, or H101Y mice. Membranes were probed with antibodies against GSK3α/β pSer21/9, GSK3α/β (total), ERK1/2 pThr202/pTyr204, or ERK1/2 (total). Quantification of blots from N = 4 mice per genotype, for GSK3β phosphorylation (pSer9; left) and ERK1/2 phosphorylation (pThr202/pTyr204; right), are shown in (E). Data are mean + S.E.M. (F) Motif analysis of RxxpS PKC consensus substrate sequence in significantly increased phosphopeptides. RxxpS was detected in 24 of 77 sequences of length 15 after removing background. Fold increase of RxxpS phosphopeptide abundance in H101Y:WT cerebellum = 5.3. (G) Gene ontology analysis of significantly increased (red) or decreased (blue) phosphopeptides representing significantly changed biological processes.
Figure 9.
Figure 9.. Degree of ataxia mutant biochemical defect correlates with SCA14 severity.
(A) Graph of the indicated SCA14 mutant basal activities from Fig. 2, B, C, and E, and Fig. 6F plotted against average age of disease onset in patients (, –58). Sample size, between 2 and 14 patients, is indicated by dot size. (B) PKCγ model based on the previously published model of PKCβII (18). Indicated SCA14 mutations are represented as black spheres; the five mutations presenting in (A) are color coded by disease severity.

References

    1. Callender JA, Newton AC, Conventional protein kinase C in the brain: 40 years later. Neuronal Signaling. 1, 20160005 (2017). - PMC - PubMed
    1. Nishizuka Y, Protein kinase C and lipid signaling for sustained cellular responses. The FASEB Journal. 9, 484–496 (1995). - PubMed
    1. Antal CE, Hudson AM, Kang E, Zanca C, Wirth C, Stephenson NL, Trotter EW, Gallegos LL, Miller CJ, Furnari FB, Hunter T, Brognard J, Newton AC, Cancer-associated protein kinase C mutations reveal kinase’s role as tumor suppressor. Cell. 160, 489–502 (2015). - PMC - PubMed
    1. Newton AC, Brognard J, Reversing the Paradigm: Protein Kinase C as a Tumor Suppressor. Trends in Pharmacological Sciences. 38 (2017), pp. 438–447. - PMC - PubMed
    1. Callender JA, Yang Y, Lordén G, Stephenson NL, Jones AC, Brognard J, Newton AC, Protein kinase Cα gain-of-function variant in Alzheimer’s disease displays enhanced catalysis by a mechanism that evades down-regulation. Proceedings of the National Academy of Sciences of the United States of America. 115, E5497–E5505 (2018). - PMC - PubMed

Publication types

Supplementary concepts