

Functional connectivity to the premotor cortex maps onto longitudinal brain neurodegeneration in progressive apraxia of speech
- PMID: 36166918
- PMCID: PMC9613616
- DOI: 10.1016/j.neurobiolaging.2022.08.013
Functional connectivity to the premotor cortex maps onto longitudinal brain neurodegeneration in progressive apraxia of speech
Abstract
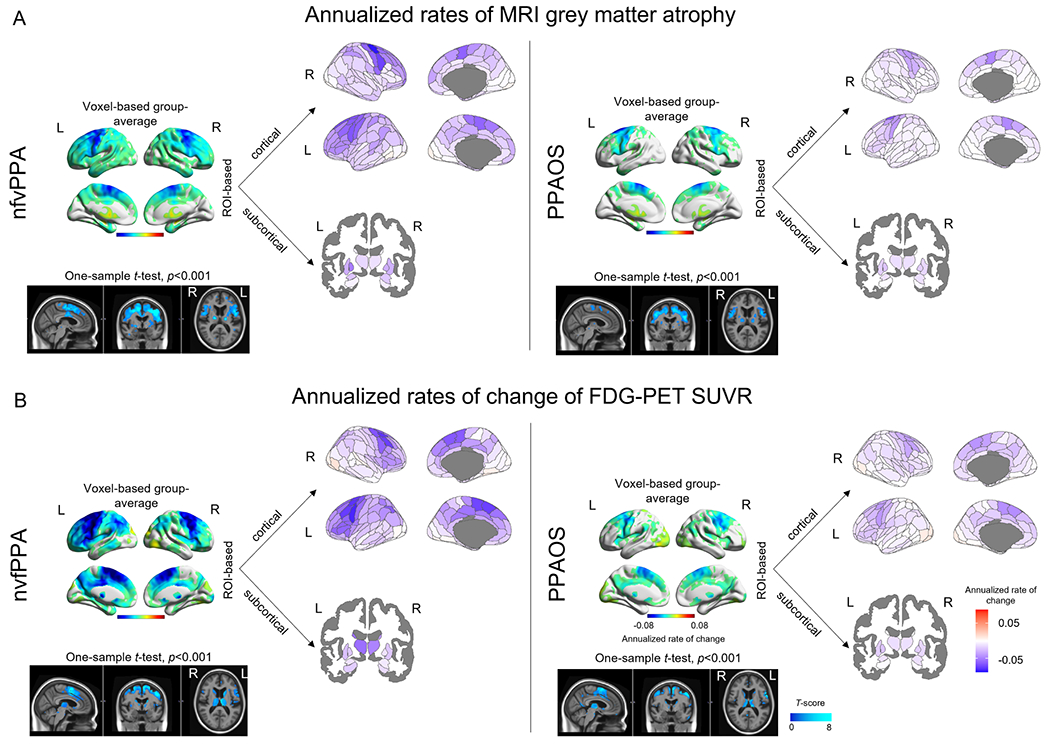
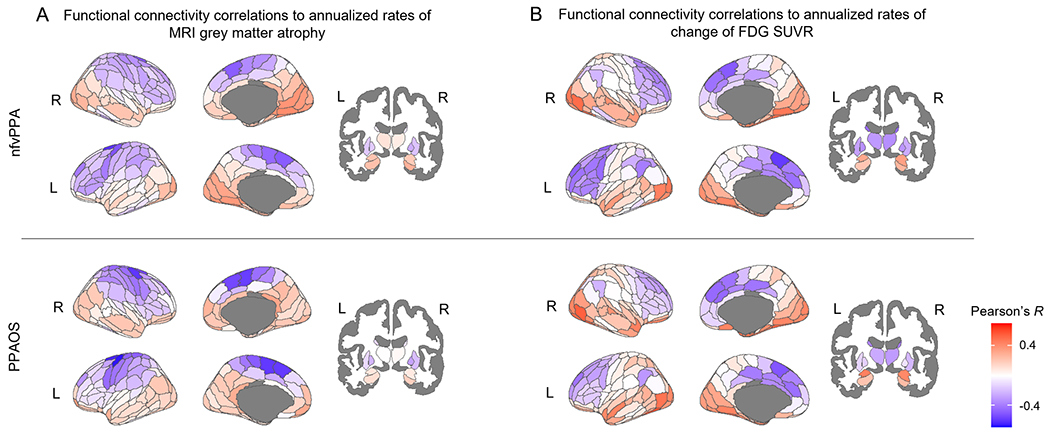
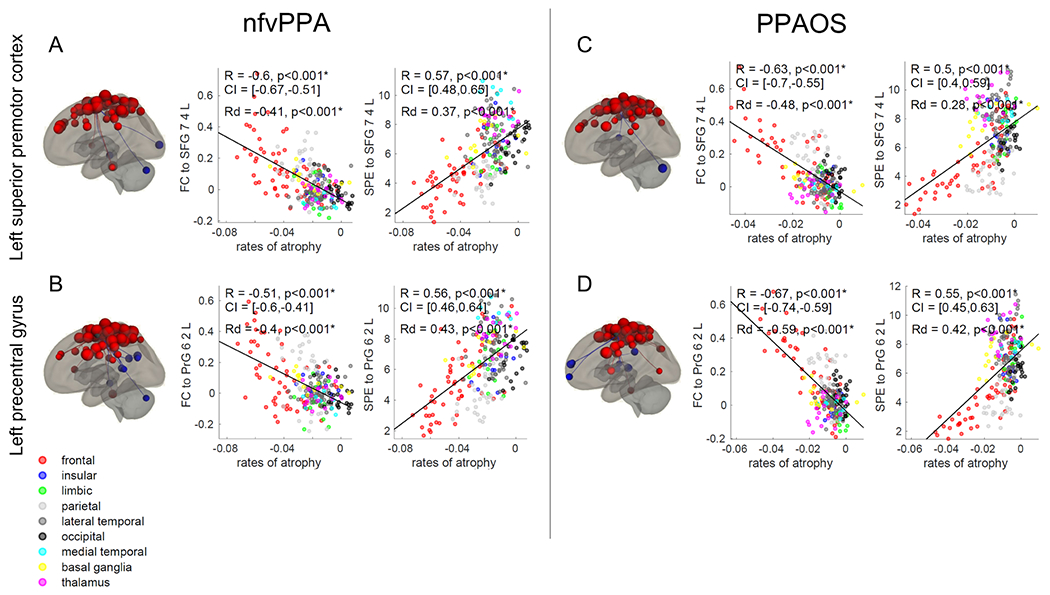
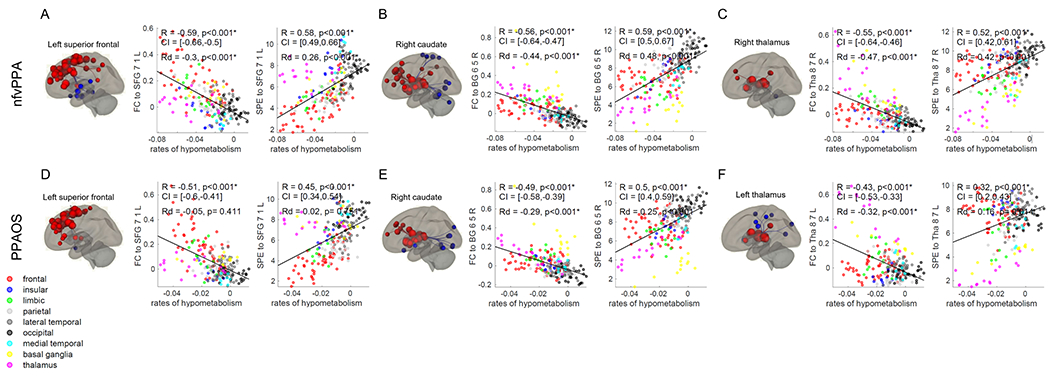
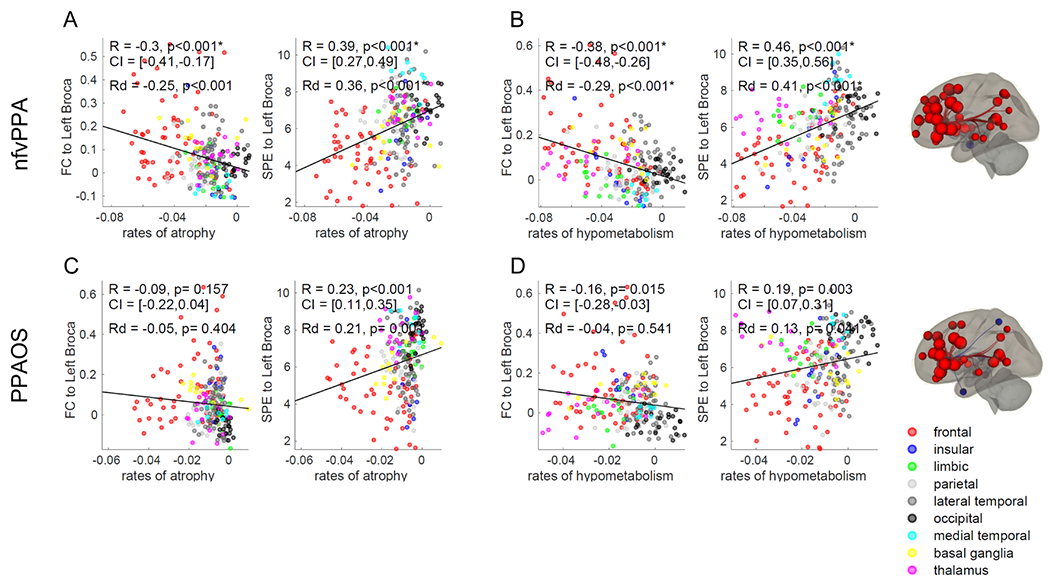
Primary progressive apraxia of speech (PPAOS) is a neurodegenerative motor speech disorder affecting the ability to produce speech. If agrammatic aphasia is present, it can be referred to as the non-fluent/agrammatic variant of primary progressive aphasia (nfvPPA). We investigated whether resting-state functional MRI (rs-fMRI) connectivity from disease "epicenters" correlated with longitudinal gray matter atrophy and hypometabolism in nfvPPA and PPAOS. Eighteen nfvPPA and 23 PPAOS patients underwent clinical assessment, structural MRI, rs-fMRI, and [18F] fluorodeoxyglucose (FDG)-PET at baseline and ∼2 years follow-up. Rates of neurodegeneration in nfvPPA and PPAOS correlated with functional connectivity to the premotor, motor, and frontal cortex. Connectivity to the caudate and thalamus was more strongly associated with rates of hypometabolism than atrophy. Connectivity to the left Broca's area was more strongly associated with rates of atrophy and hypometabolism in nfvPPA. Finally, functional connectivity to a network of regions, and not to a single epicenter, correlated with rates of neurodegeneration in PPAOS and nfvPPA, suggesting similar biological mechanisms driving disease progression, with regional differences related to language.
Keywords: Aphasia; Apraxia of speech; Functional connectivity; Longitudinal neurodegeneration; Multimodal imaging.
Copyright © 2022. Published by Elsevier Inc.
Conflict of interest statement
Declaration of competing interest M.L.S. has owned stocks, within the past 12 months, in Align Technology, Inc., Inovio Pharmaceuticals Inc., LHC Group, Inc., Mesa Laboratories, Inc., and Natus Medical Inc., unrelated to the current study. V.J.L. consults for Bayer Schering Pharma, Piramal Life Sciences, Life Molecular Imaging, Eisai Inc., AVID Radiopharmaceuticals, and Merck Research and receives research support from GE Healthcare, Siemens Molecular Imaging, AVID Radiopharmaceuticals. C.R.J. serves on a scientific advisory board for Eli Lilly & Company, as a speaker for Eisai and on an independent data safety monitoring board for Roche but he receives no personal compensation from any commercial entity. All other authors report no competing interests for this study.
Figures
Similar articles
-
Disrupted functional connectivity in primary progressive apraxia of speech.Neuroimage Clin. 2018 Mar 3;18:617-629. doi: 10.1016/j.nicl.2018.02.036. eCollection 2018. Neuroimage Clin. 2018. PMID: 29845010 Free PMC article.
-
Longitudinal structural and molecular neuroimaging in agrammatic primary progressive aphasia.Brain. 2018 Jan 1;141(1):302-317. doi: 10.1093/brain/awx293. Brain. 2018. PMID: 29228180 Free PMC article.
-
Progression to corticobasal syndrome: a longitudinal study of patients with nonfluent primary progressive aphasia and primary progressive apraxia of speech.J Neurol. 2024 Jul;271(7):4168-4179. doi: 10.1007/s00415-024-12344-x. Epub 2024 Apr 7. J Neurol. 2024. PMID: 38583104 Free PMC article.
-
Primary progressive aphasia and apraxia of speech.Semin Neurol. 2013 Sep;33(4):342-7. doi: 10.1055/s-0033-1359317. Epub 2013 Nov 14. Semin Neurol. 2013. PMID: 24234355 Free PMC article. Review.
-
My experience of living with nonfluent/agrammatic variant primary progressive aphasia: Challenges, compensatory strategies and adaptations.Int J Lang Commun Disord. 2023 Mar;58(2):542-554. doi: 10.1111/1460-6984.12798. Epub 2022 Oct 14. Int J Lang Commun Disord. 2023. PMID: 36239167 Review.
Cited by
-
Functional connectivity abnormalities in clinical variants of progressive supranuclear palsy.Neuroimage Clin. 2025;45:103727. doi: 10.1016/j.nicl.2024.103727. Epub 2024 Dec 17. Neuroimage Clin. 2025. PMID: 39719808 Free PMC article.
-
Longitudinal characterization of patients with progressive apraxia of speech without clearly predominant phonetic or prosodic speech features.Brain Lang. 2023 Oct;245:105314. doi: 10.1016/j.bandl.2023.105314. Epub 2023 Aug 20. Brain Lang. 2023. PMID: 37607419 Free PMC article.
-
Connectome-based modelling of neurodegenerative diseases: towards precision medicine and mechanistic insight.Nat Rev Neurosci. 2023 Oct;24(10):620-639. doi: 10.1038/s41583-023-00731-8. Epub 2023 Aug 24. Nat Rev Neurosci. 2023. PMID: 37620599 Review.
-
Diffusion tensor imaging-based multi-fiber tracking reconstructions can regionally differentiate phonetic versus prosodic subtypes of progressive apraxia of speech.Cortex. 2024 Feb;171:272-286. doi: 10.1016/j.cortex.2023.08.019. Epub 2023 Nov 8. Cortex. 2024. PMID: 38061209 Free PMC article.
-
Combined assessment of progressive apraxia of speech brain microstructure by diffusion tensor imaging tractography and multishell neurite orientation dispersion and density imaging.Brain Behav. 2024 Jan;14(1):e3346. doi: 10.1002/brb3.3346. Brain Behav. 2024. PMID: 38376044 Free PMC article.
References
-
- Armstrong MJ, Litvan I, Lang AE, Bak TH, Bhatia KP, Borroni B, Boxer AL, Dickson DW, Grossman M, Hallett M, Josephs KA, Kertesz A, Lee SE, Miller BL, Reich SG, Riley DE, Tolosa E, Troster AI, Vidailhet M, and Weiner WJ. 2013. ‘Criteria for the diagnosis of corticobasal degeneration’, Neurology, 80: 496–503. - PMC - PubMed
Publication types
MeSH terms
Substances
Grants and funding
LinkOut - more resources
Full Text Sources
