. 2022 Sep;10(9):e005187.
doi: 10.1136/jitc-2022-005187.

GD2-targeting CAR-T cells enhanced by transgenic IL-15 expression are an effective and clinically feasible therapy for glioblastoma

Affiliations

GD2-targeting CAR-T cells enhanced by transgenic IL-15 expression are an effective and clinically feasible therapy for glioblastoma

Tessa Gargett et al. J Immunother Cancer. 2022 Sep.

Abstract

Background: Aggressive primary brain tumors such as glioblastoma are uniquely challenging to treat. The intracranial location poses barriers to therapy, and the potential for severe toxicity. Effective treatments for primary brain tumors are limited, and 5-year survival rates remain poor. Immune checkpoint inhibitor therapy has transformed treatment of some other cancers but has yet to significantly benefit patients with glioblastoma. Early phase trials of chimeric antigen receptor (CAR) T-cell therapy in patients with glioblastoma have demonstrated that this approach is safe and feasible, but with limited evidence of its effectiveness. The choices of appropriate target antigens for CAR-T-cell therapy also remain limited.

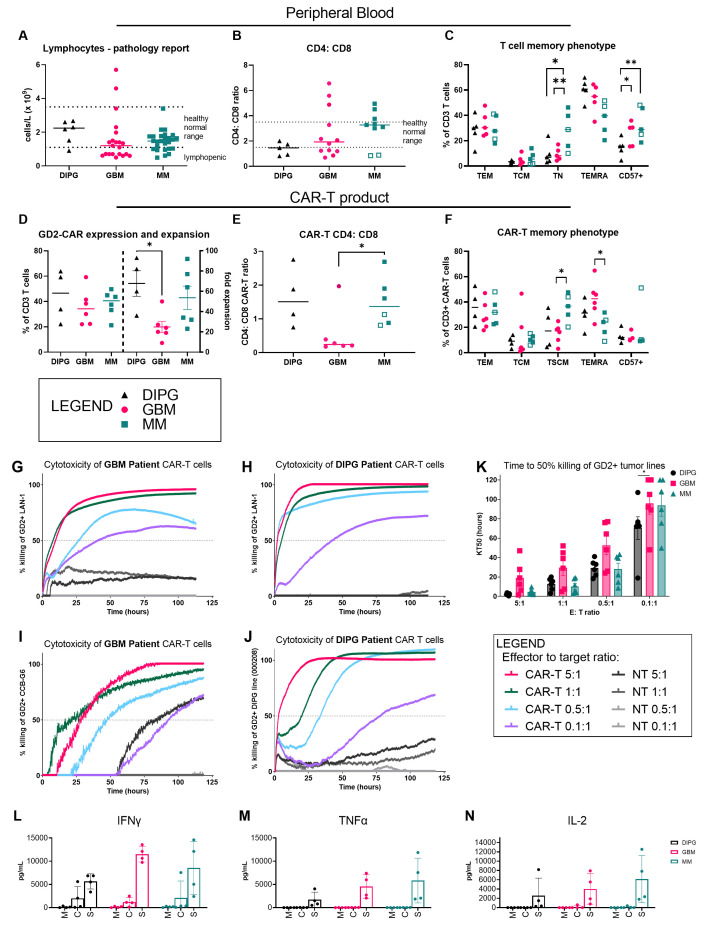
Methods: We profiled an extensive biobank of patients' biopsy tissues and patient-derived early passage glioma neural stem cell lines for GD2 expression using immunomicroscopy and flow cytometry. We then employed an approved clinical manufacturing process to make CAR- T cells from patients with peripheral blood of glioblastoma and diffuse midline glioma and characterized their phenotype and function in vitro. Finally, we tested intravenously administered CAR-T cells in an aggressive intracranial xenograft model of glioblastoma and used multicolor flow cytometry, multicolor whole-tissue immunofluorescence and next-generation RNA sequencing to uncover markers associated with effective tumor control.

Results: Here we show that the tumor-associated antigen GD2 is highly and consistently expressed in primary glioblastoma tissue removed at surgery. Moreover, despite patients with glioblastoma having perturbations in their immune system, highly functional GD2-specific CAR-T cells can be produced from their peripheral T cells using an approved clinical manufacturing process. Finally, after intravenous administration, GD2-CAR-T cells effectively infiltrated the brain and controlled tumor growth in an aggressive orthotopic xenograft model of glioblastoma. Tumor control was further improved using CAR-T cells manufactured with a clinical retroviral vector encoding an interleukin-15 transgene alongside the GD2-specific CAR. These CAR-T cells achieved a striking 50% complete response rate by bioluminescence imaging in established intracranial tumors.

Conclusions: Targeting GD2 using a clinically deployed CAR-T-cell therapy has a sound scientific and clinical rationale as a treatment for glioblastoma and other aggressive primary brain tumors.

Keywords: brain neoplasms; immunotherapy, adoptive; receptors, chimeric antigen.


Conflict of interest statement

Competing interests: None declared.

Figures

Figure 1
Figure 1
High-level GD2 expression in glioblastoma (GBM) tumor tissues and glioma neural stem (GNS) cell lines, but not in normal brain. (A) Sections of surgical specimens from GBM (n=16) or surrounding non-involved brain (n=4) were stained by immunofluorescence using an anti-GD2 primary antibody (clone 14g2a) and IgG2a isotype control antibody (top row insets). Representative staining for regions of high (top) and low (middle) GD2 expression, and matched adjacent normal brain tissue (bottom). (B) Summary of GD2 staining intensity measured by ImageJ. Dotted lines at y-axis mark average staining intensity for (1) adjacent normal brain tissue (n=4) removed by neurosurgeon to access the tumor, and (2) the isotype control. (C) Summary of GD2 expression on GNS cell lines, which were generated from patients with GBM and DIPG’s tumors and maintained in culture for <25 passages. (D) Representative histograms showing the three distinct GD2 expression patterns observed. Cells were analyzed by flow cytometry for GD2 expression using anti-GD2 primary mAb (clone 14g2a; black histograms) or isotype-matched control antibodies (red histograms). (E) The CCB-G5C GNS cell line was implanted in the brains of NOD-SCID-gamma-null (NSG) mice via stereotactic intracranial injection. Representative image of H&E staining (left) and GD2 immunofluorescence (right) of coronal section of mouse brain at time of humane killing because of neurological signs n=10, for full analysis of groups see figures 4–5. Asterisk marks side of tumor inoculation. CCB, Centre for Cancer Biology; DIPG, diffuse intrinsic pontine glioma.
Figure 2
Figure 2
GD2-specific CAR-T cells can be manufactured from peripheral blood of patients with glioblastoma (GBM) and diffuse intrinsic pontine glioma (DIPG) and have a distinct phenotype. Immune phenotype of patient with GBM, DIPG, and metastatic melanoma (MM)-derived CAR-T cells as determined by multicolor flow cytometry. (A) Peripheral blood lymphocyte counts obtained at time of blood collection for CAR-T-cell manufacture. (B) Ratio of peripheral blood lymphocyte CD4+ and CD8+ T cells for each tumor type. Pathology service-defined healthy normal range is marked where available. (C) Proportions of various memory subsets within the peripheral T-cell population: effector memory (CD45RA CCR7 CD62L); central memory (CD45RA CCR7+ CD62L+); naïve (CD45RA+ CCR7+ CD62L+); TEMRA (CD45RA+ CCR7 CD62L+/–). (D) Relative expression and expansion of GD2-CAR-T cells in vitro for each tumor type. (E) Ratio of CD4+ and CD8+ CAR-T cells. (F) Proportions of memory subsets within CAR-T cells, defined as for (C). Cytotoxicity against GD2-expressing tumor cell lines of neuroblastoma (LAN-1), GBM (CCB-G6) and DIPG (000208) as determined by a real-time cell adhesion-based assay. CAR-T cells derived from (G) patients with GBM (BT29) and (H) DIPG (DIPG1) were assayed against the LAN-1 neuroblastoma target cell line used for batch release testing in our clinical trials. CAR-T cells derived from (I) patients with GBM (BT29) and (J) patients with DIPG (DIPG1) were assayed against the matched glioma neural stem cell line (CCB-G6) and the unmatched DIPG cell line (000208), respectively. Representative data from one patient are shown; n=4 patient samples. (K) Summary data of all patient product cytotoxicity assays showing the time in hours to reach 50% killing of targets (KT50). Production of (L) IFN-gamma (M) TNF-alpha (N) IL-2 from CAR-T cell products from patients with DIPG, GBM or MM were cultured with media only (M), media plus IL-7 and IL-15 homeostatic proliferative cytokines (C), or media and plate-bound 1A7 antibody for CAR stimulation for 72 hours (S). Other cytokines, and cytokines from peripheral T cells directly isolated from patients are shown in online supplemental figure 5.; n=3 patient samples, two-way analysis of variance and Tukey’s multiple comparison post-tests. CAR, chimeric antigen receptor; CCB, Centre for Cancer Biology; IFN, interferon; IL, interleukin; TNF, tumor necrosis factor.
Figure 3
Figure 3
Third-generation GD2-CAR T cells control orthotopic GBM xenografts but do not adversely affect the normal mouse brain. Mice received 2×10⁵ Centre for Cancer Biology-G5c cells by stereotactic intracranial injection on Day 1. On Day 17, mice were given single intravenous injections of saline (untreated), 1.5×10⁶ non-transduced control T cells from a healthy donor (NT-T), 1.5×10⁶ healthy donor-derived GD2-CAR-T cells (HV CAR-T), or 1.5×10⁶ patient with GBM-derived GD2-CAR-T cells (GBM CAR-T, from donor BT11 or donor BT48, unmatched to the xenograft). n=8–10/group. (A) Representative bioluminescence imaging (BLI) for NSG mice with intracranial GBM xenografts. (B) BLI data for all mice. (C) Kaplan-Meir survival curves and statistics for mice. Statistics shown are from individual Gehan-Breslow-Wilcoxon tests comparing each curve to the untreated curve. (D) Clinical signs resulting in humane killing according to predefined criteria (see Methods). Mice humanely killed for neurological signs also routinely displayed weight loss, reluctance to move and ruffled coats, however these alone did not reach a severity score requiring euthanasia. (E) Independent histopathology scoring of brain sections from humanely killed mice of the (i) remaining normal brain tissue and (ii) GBM tumor. Abnormal features were graded as: 0=none; 1=minimal; 2=moderate; 3=severe. Cellularity was graded as: 1=low; 2=moderate; 3=dense. Mitotic features were reported as number per field of view. CAR, chimeric antigen receptor; GBM, glioblastoma.
Figure 4
Figure 4
T-cell infiltration as shown in whole brain sections and dissociated tissue samples. At the time of humane killing, mouse brains were bisected, and half was reserved for immunofluorescence (IF) staining of whole tissue, and half was dissociated for flow cytometric analysis alongside spleen and bone marrow. (A) Whole brain sections (mid-coronal plane where possible) were assessed by H&E staining (far left column), and IF using anti-GD2-AF488 (clone 14g2a) and anti-human CD3 AF647 (columns 2 and 3) or anti-human CD3-AF647 and anti-mouse CD31-AF488 (columns 4 and 5) antibodies. White boxes on the whole brain sections indicate regions of interest shown at higher magnification (40×) to the right. White arrows indicate large vessels, identified by the presence of a black lumen and distinct from microvessels. Representative images from (i) an untreated mouse, and three GBM CAR-T treated mice (ii–iv) have been chosen to show the range of staining for each molecule. n=6/group. (B) ImageJ analysis of the staining intensity for GD2, CD3 and CD31 (i–iii), and enumeration of the number of large CD31+ vessels (iv). Statistical analysis by two-way analysis of variance (ANOVA) and Tukey’s multiple comparison post-tests. The individual mice represented in the IF microscopy images are shown with open symbols. (C) Linear regression analysis of staining intensity (i–iii) or large vessel number (iv) versus survival time of mice. statistical analysis with two-way ANOVA and Tukey’s multiple comparison post-tests. See online supplemental figure 5 for flow cytometric analysis of CAR+T cells, with absolute counts, representative dot plots and statistical analysis of the correlation between absolute cell numbers and survival. CAR, chimeric antigen receptor; GBM, glioblastoma.
Figure 5
Figure 5
Incorporating an IL-15 transgene confers superior orthotopic tumor control by second-generation GD2-CAR-T cells compared with third-generation GD2-CAR-T cells. Mice received 2×10⁵ Centre for Cancer Biology-G5c cells by stereotactic injection on Day 1. On Day 28, mice were given single intravenous injections of saline (untreated) 1.5×10⁶ non-transduced control T cells (NT-T) from healthy donor, 3×10⁶ healthy donor-derived third-generation GD2-CAR T cells (CAR-T) or 3×10⁶ IL-15-containing GD2-specific CAR-T cells (IL-15-CAR-T). n=5–6/group (A) BLI data for all mice. (B) Kaplan-Meir survival curves and statistics for mice. Statistics shown are from individual Gehan-Breslow-Wilcoxon tests comparing each curve to the untreated curve. (C) Clinical signs resulting in humane killing according to predefined criteria (see Methods). (D) Next-generation sequencing of whole brain dissociated tissues from two untreated, two NT-T treated, two CAR-T treated and two IL-15-CAR-T treated mice. Heatmap of selected markers show average normalized messenger RNA counts (Reads per KB per million). (E) Whole brain sections (mid-coronal plane where possible) were assessed by H&E staining (far left column), and immunofluorescence (IF) using anti-GD2-AF647 (clone 14g2a) and anti-human CD3 AF488 (columns 2 and 3) or anti-human CD3 AF488 and anti-mouse CD31-AF647 (columns 4 and 5) antibodies. White boxes on the whole brain sections indicate regions of interest shown at higher magnification to the right. White arrows indicate large vessels, identified by the presence of a black lumen and distinct from microvessels. Representative images from an (i) untreated mouse, (ii) CAR-T treated mouse, and (iii) an IL-15-containing CAR-T-treated mouse have been chosen to show the range of expression for each molecule. n=4/group, statistical analysis by two-way analysis of variance (ANOVA) and Tukey’s multiple comparison post-tests. (F) ImageJ analysis of the staining intensity for each antibody (i–iii), and enumeration of the number of large CD31+ vessels (iv). The individual mice represented in the IF microscopy images are shown with open symbols. (G) Linear regression analysis of IF staining and survival, statistical analysis with two-way ANOVA and Tukey’s multiple comparison post-tests. CAR, chimeric antigen receptor; IL, interleukin.
Figure 6
Figure 6
Staining for human GFAP reveals the extent of tumor control versus tumor escape. (A) Whole brain sections were stained with rabbit anti-human GFAP. Contiguous sections stained with GD2 and CD3 are presented alongside to enable direct comparison. Representative images from (i) untreated mouse, (ii) GD2-CAR-T treated mouse, and (iii) GD2-CAR-IL-15 treated mouse. n=6–8/group. See also online supplemental table 2 for a full data summary. (B) ImageJ analysis of the staining intensity for human GFAP antibody, statistical analysis with two-way analysis of variance and Tukey’s multiple comparison post-tests The individual mice represented in the IF microscopy images are shown with open symbols. Linear regression analysis of GFAP IF staining and (C) GD2 staining intensity (D) bioluminescence (BLI—total flux) at endpoint (E) survival (days). BLI, bioluminescence imaging; CAR, chimeric antigen receptor; IL, interleukin; IF, immunofluorescence; NT-T, non-transduced T cells.

References

    1. Poon MTC, Sudlow CLM, Figueroa JD, et al. . Longer-term (≥ 2 years) survival in patients with glioblastoma in population-based studies pre- and post-2005: a systematic review and meta-analysis. Sci Rep 2020;10:11622. 10.1038/s41598-020-68011-4 - DOI - PMC - PubMed
    1. Vitanza NA, Monje M. Diffuse intrinsic pontine glioma: from diagnosis to next-generation clinical trials. Curr Treat Options Neurol 2019;21:37. 10.1007/s11940-019-0577-y - DOI - PMC - PubMed
    1. Muftuoglu Y, Liau LM. Results from the CheckMate 143 clinical trial: stalemate or new game strategy for glioblastoma immunotherapy? JAMA Oncol 2020;6:987–9. 10.1001/jamaoncol.2020.0857 - DOI - PubMed
    1. Porter DL, Hwang W-T, Frey NV, et al. . Chimeric antigen receptor T cells persist and induce sustained remissions in relapsed refractory chronic lymphocytic leukemia. Sci Transl Med 2015;7:ra139. 10.1126/scitranslmed.aac5415 - DOI - PMC - PubMed
    1. Maude SL, Laetsch TW, Buechner J, et al. . Tisagenlecleucel in children and young adults with B-cell lymphoblastic leukemia. N Engl J Med Overseas Ed 2018;378:439–48. 10.1056/NEJMoa1709866 - DOI - PMC - PubMed

Publication types