. 2022 Sep 27;19(1):235.
doi: 10.1186/s12974-022-02595-8.

Ultrastructural characterization of dark microglia during aging in a mouse model of Alzheimer's disease pathology and in human post-mortem brain samples

Affiliations

Ultrastructural characterization of dark microglia during aging in a mouse model of Alzheimer's disease pathology and in human post-mortem brain samples

Marie-Kim St-Pierre et al. J Neuroinflammation. .

Abstract

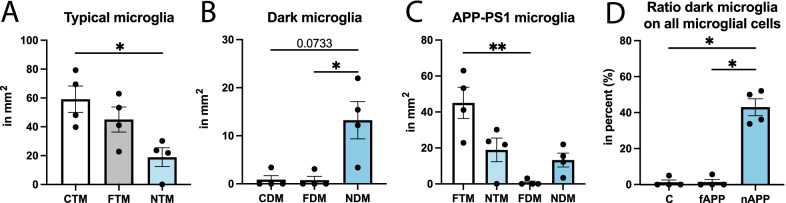
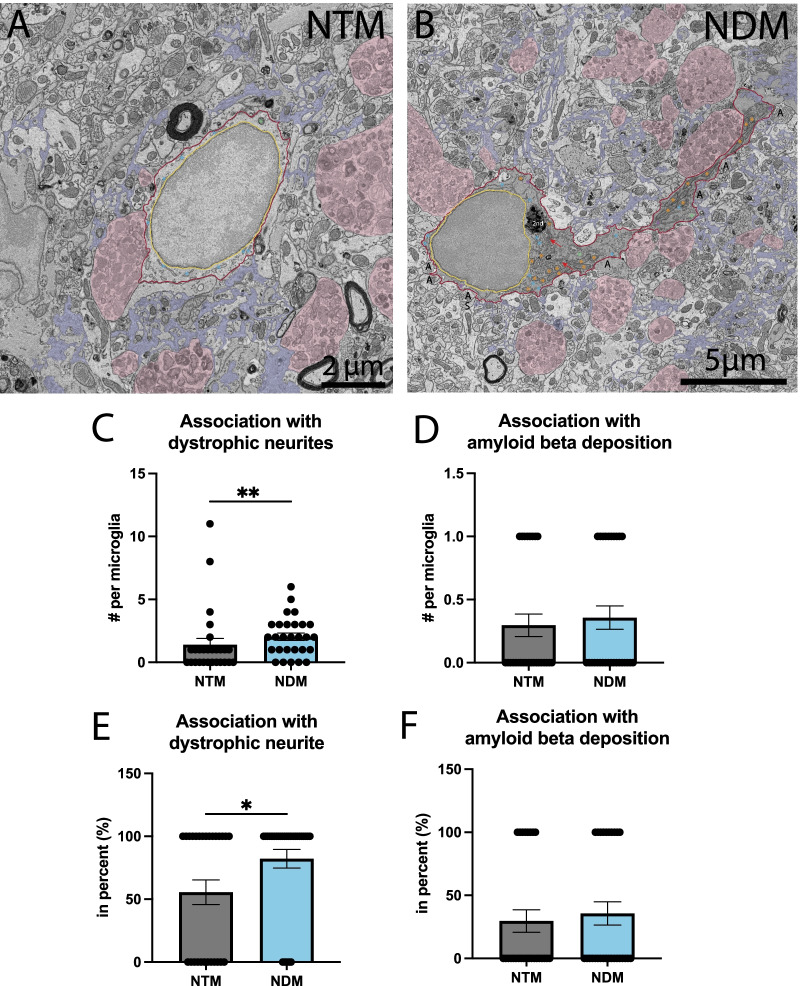
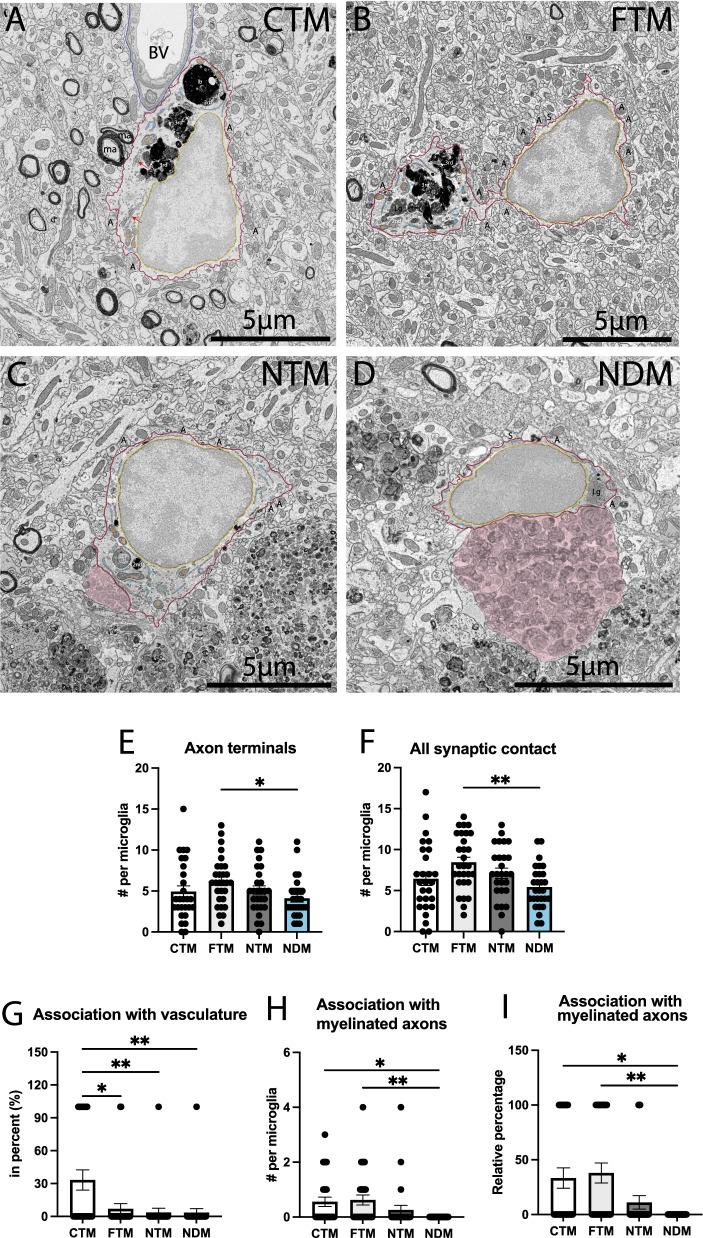
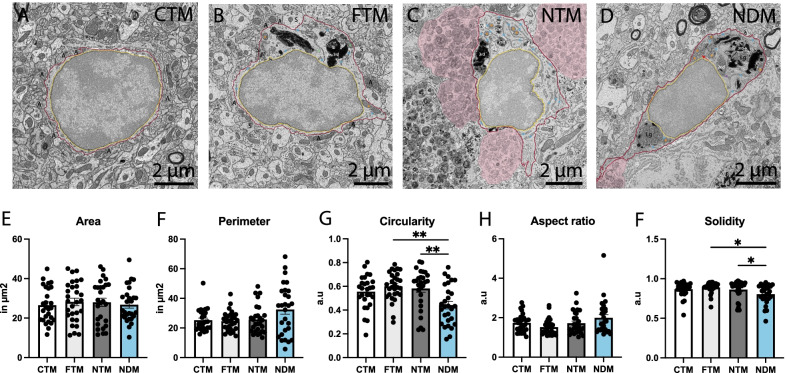
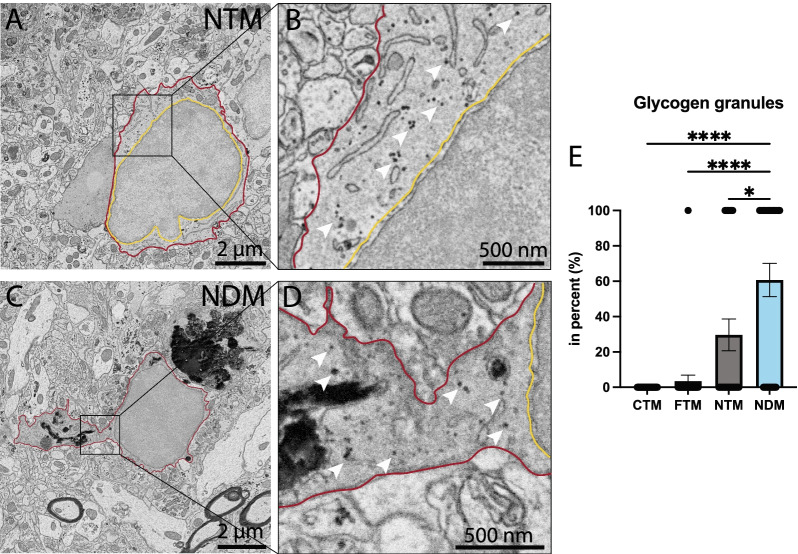
A diverse heterogeneity of microglial cells was previously described in Alzheimer's disease (AD) pathology, including dark microglia, a state characterized by ultrastructural markers of cellular stress. To provide novel insights into the roles of dark microglia during aging in the context of AD pathology, we performed a quantitative density and ultrastructural analysis of these cells using high-throughput scanning electron microscopy in the ventral hippocampus CA1 stratum lacunosum-moleculare of 20-month-old APP-PS1 vs C57BL/6J male mice. The density of dark microglia was significantly higher in APP-PS1 vs C57BL/6J mice, with these cells accounting for nearly half of all microglia observed near amyloid-beta (Aβ) plaques. This dark microglial state interacted more with dystrophic neurites compared to other APP-PS1 microglia and possessed glycogen granules, associated with a metabolic shift toward glycolysis, which provides the first ultrastructural evidence of their presence in microglia. Dark microglia were further observed in aging human post-mortem brain samples showing similar ultrastructural features as in mouse. Overall, our results provide a quantitative ultrastructural characterization of a microglial state associated with cellular stress (i.e., dark microglia) that is primarily restricted near Aβ plaques and dystrophic neurites. The presence of this microglial state in the aging human post-mortem brain is further revealed.

Keywords: Alzheimer’s disease; Amyloid-beta; Dark microglia; Dystrophic neurites; Human post-mortem brain samples; Microglia; Ultrastructure.


Conflict of interest statement

The authors declare that they have no competing interests.

Figures

Fig. 1
Fig. 1
Distribution and density of dark vs typical microglia. Density analysis based on ultrastructural characteristics of dark (DM) and typical microglia (TM) in the ventral hippocampus CA1 stratum lacunosum-moleculare of 20-month-old and age-matched C57BL/6J male mice. The density of TM (A) and DM (B) is shown. The density of microglia based on their proximity to plaques (far or near) as well as their state (TM or DM) is provided (C). The percentage of DM over all the microglia far from plaques or near plaques is represented in D. Data shown are expressed as means ± S.E.M. *p < 0.05, **p < 0.01, using a Kruskal–Wallis test with a post hoc Dunn’s multiple comparisons test. n = 4 animals
Fig. 2
Fig. 2
Dark vs typical microglia’s interactions with dystrophic neurites and Aβ plaques. Representative 5 nm resolution scanning electron microscopy images captured in the ventral hippocampus CA1 stratum lacunosum-moleculare of 20-month-old APP-PS1 male mice. A Typical microglia (TM) observed near extracellular fibrillar Aβ (pseudocolored in purple) and dystrophic neurites (pseudocolored in pink). B Dark microglia (DM) interacting with several dystrophic neurites along with fibrillar Aβ. CF Quantitative graphs representing the numbers of contacts with dystrophic neurites (C) and Aβ plaques (D) as well as the proportion of microglial cells contacting dystrophic neurites (E) or Aβ plaques (F). Data are shown as individual dots of either 0 or 100 values and are expressed as means ± S.E.M. * p < 0.05, ** p < 0.01, using a non-parametric Mann–Whitney test. Statistical tests were performed on n = 9–12 microglia per animal with N = 3 mice/group, for a total of 111 microglial cell bodies analyzed. Purple pseudo-coloring = fibrillar Aβ, pink pseudo-coloring = dystrophic neurites, red outline = plasma membrane, yellow outline = nuclear membrane, orange asterisk = mitochondria, green asterisk = altered mitochondria, blue asterisk = endoplasmic reticulum, purple asterisk = dilated endoplasmic reticulum, red arrow = Golgi apparatus, 2nd = secondary lysosome, A = axon terminal
Fig. 3
Fig. 3
Dark vs typical microglia’s interactions with parenchymal elements. Representative 5 nm resolution scanning electron microscopy images taken in the ventral hippocampus CA1 stratum lacunosum-moleculare of 20-month-old APP-PS1 and C57BL/6J male mice. A Typical microglia (TM) in C57BL/6J mice contacting a blood vessel (labeled BV) and myelinated axons (labeled ma) as well as axon terminals (labeled A), B TM far from a plaque interacting with axon terminals and dendritic spines (labeled S), C TM near a plaque interacting with a few axon terminals, D dark microglia (DM) near a plaque is contacting axon terminals. Graphs representing the number of axon terminals (E), all synaptic interactions (F), percentage of cells associating with the vasculature (G), myelinated axons (F), as well as the percentage of cells touching a myelinated axon (J). Data shown are expressed as means ± S.E.M. * p < 0.05, ** p < 0.01, using a Kruskal–Wallis test with a Dunn’s multiple comparisons post hoc test. Statistical tests were performed on n = 9–12 microglia per animal with N = 3 mice/group, for a total of 111 microglial cell bodies analyzed. Red outline = plasma membrane, yellow outline = nuclear membrane, blue outline = basement membrane, ma = myelinated axons, A = axon terminals, S = dendritic spines, orange asterisk = mitochondria, green asterisk = altered mitochondria, blue asterisk = endoplasmic reticulum, red arrow = Golgi apparatus, lb = lipid body, 3rd = tertiary lysosome, 2nd = secondary lysosome, Lg = lipofuscin granules, pink pseudo-coloring = dystrophic neurites
Fig. 4
Fig. 4
Shape descriptors of dark vs typical microglia. Representative 5 nm resolution scanning electron microscopy images captured in the ventral hippocampus CA1 stratum lacunosum-moleculare of 20-month-old APP-PS1 and C57BL/6J male mice. A typical microglia (TM) in C57BL/6J mice, B TM far from Aβ plaque, (C) TM near Aβ plaques and dystrophic neurites, (D) dark microglia (DM) near Aβ plaques and dystrophic neurites in APP-PS1 mice. EI Graphs representing the shape descriptors of microglia: (E) area, (F) perimeter, (G) circularity, (H) aspect ratio and (I) solidity. Data shown are expressed as means ± S.E.M. *p < 0.05, **p < 0.01, using a Kruskal–Wallis test with a Dunn’s multiple comparisons post hoc test. Statistical tests were performed on n = 9–12 microglia per animal with N = 3 mice/group, for a total of 111 microglial cell bodies analyzed. Red outline = plasma membrane, yellow outline = nuclear membrane. A = axon terminals, S = dendritic spines, orange asterisk = mitochondria, green asterisk = altered mitochondria, blue asterisk = endoplasmic reticulum, red arrow = Golgi apparatus, lb = lipid body, 3rd = tertiary lysosome, 2nd = secondary lysosome, Lg = lipofuscin granules, pink pseudo-coloring = dystrophic neurites
Fig. 5
Fig. 5
Ultrastructural signs of cellular stress in dark vs typical microglia. Representative 5 nm resolution scanning electron microscopy images taken in the ventral hippocampus CA1 stratum lacunosum-moleculare of 20-month-old APP-PS1 and C57BL/6J male mice. A Typical microglia (TM) in C57BL/6J mice without visible ultrastructural signs of cellular stress, B TM far from a plaque with altered mitochondria (green asterisk) (C) TM near a plaque with healthy endoplasmic reticulum cisternae (blue asterisk), (D) dark microglia (DM) near a plaque with altered mitochondria (green asterisk), healthy and dilated endoplasmic reticulum cisternae (blue and purple asterisks respectively) in APP-PS1 mice. Graphs representing the number and proportion of microglial cells with dilated endoplasmic reticulum and/or Golgi apparatus cisternae (E, H), altered mitochondria (F, I) and elongated mitochondria (G, J) are presented. Data shown are expressed as means ± S.E.M. * p < 0.05, ** p < 0.01, **** p < 0.001 using a Kruskal–Wallis test with a Dunn’s multiple comparisons post hoc test. Statistical tests were performed on n = 9–12 microglia per animal with N = 3 mice/group, for a total of 111 microglial cell bodies analyzed. Red outline = plasma membrane, yellow outline = nuclear membrane, ma = myelinated axons, A = axon terminals, S = dendritic spines, orange asterisk = mitochondria, green asterisk = altered mitochondria, blue asterisk = endoplasmic reticulum, purple asterisk = dilated endoplasmic reticulum
Fig. 6
Fig. 6
Glycogen granules in the cytoplasm of dark vs typical microglia. Representative 5 nm resolution scanning electron microscopy images captured in the ventral hippocampus CA1 stratum lacunosum-moleculare of 20-month-old APP-PS1 male mice. A Typical microglia (TM) near extracellular fibrillar Aβ (NTM) and (C) dark microglia (DM) near Aβ (NDM), both presenting glycogen granules in their cytoplasm (white arrow). BD represent the insets of A and C, respectively. E Graph representing the proportion of microglia positive for glycogen granules. Data shown are expressed as means ± S.E.M. *p < 0.05, ****p < 0.001 using a Kruskal–Wallis test with a post hoc Dunn’s multiple comparisons test. Statistical tests were performed on n = 9–12 microglia per animal with N = 3 mice/group, for a total of 111 microglial cell bodies analyzed. Red outline = plasma membrane, yellow outline = nuclear membrane, while arrow = glycogen granules
Fig. 7
Fig. 7
Dark vs typical microglia in aging human post-mortem brain samples. Representative 5 nm resolution scanning electron microscopy images in human post-mortem hippocampal head (post-mortem delay of 18 h) of (A) a 45-year old man and (B) a 81-year old woman. A Typical microglia (TM) positive for the myeloid cell marker Iba1 with healthy and altered mitochondria located next to a dark microglia (DM). The insets provide a zoom in view of the (B) TM and (C) DM. D TM with lipofuscin (labeled Lg) and mitochondria (orange asterisk) next to a DM displaying altered mitochondria (green asterisk), empty phagosomes (pseudocolored in cyan) and phagosomes with cellular contents (pseudocolored in pink). The insets provide a higher magnification of the (E) TM and (F) DM. Red outline = plasma membrane, yellow outline = nuclear membrane, ma = myelinated axons, A = axon terminals, orange asterisk = mitochondria, green asterisk = altered mitochondria, lb = lipid body, 3rd = tertiary lysosome, Lg = lipofuscin granules, pink pseudo-coloring = partially digested phagosome, cyan pseudo-coloring = fully digested phagosome

References

    1. Spires-Jones TL, Hyman BT. The intersection of amyloid beta and tau at synapses in Alzheimer’s disease. Neuron. 2014;82(4):756–771. doi: 10.1016/j.neuron.2014.05.004. - DOI - PMC - PubMed
    1. Terry RD, Masliah E, Salmon DP, Butters N, DeTeresa R, Hill R, et al. Physical basis of cognitive alterations in Alzheimer’s disease: synapse loss is the major correlate of cognitive impairment. Ann Neurol. 1991;30(4):572–580. doi: 10.1002/ana.410300410. - DOI - PubMed
    1. Fjell AM, McEvoy L, Holland D, Dale AM, Walhovd KB. Alzheimer’s Disease Neuroimaging Initiative What is normal in normal aging? Effects of aging, amyloid and Alzheimer’s disease on the cerebral cortex and the hippocampus. Prog Neurobiol. 2014;117:20–40. doi: 10.1016/j.pneurobio.2014.02.004. - DOI - PMC - PubMed
    1. Pini L, Pievani M, Bocchetta M, Altomare D, Bosco P, Cavedo E, et al. Brain atrophy in Alzheimer’s disease and aging. Ageing Res Rev. 2016;30:25–48. doi: 10.1016/j.arr.2016.01.002. - DOI - PubMed
    1. Masurkar AV. Towards a circuit-level understanding of hippocampal CA1 dysfunction in Alzheimer’s disease across anatomical axes. J Alzheimers Dis Parkinsonism. 2018;8(1):412. doi: 10.4172/2161-0460.1000412. - DOI - PMC - PubMed