. 2022 Sep 27;23(1):204.
doi: 10.1186/s13059-022-02765-0.

False gene and chromosome losses in genome assemblies caused by GC content variation and repeats

Affiliations

False gene and chromosome losses in genome assemblies caused by GC content variation and repeats

Juwan Kim et al. Genome Biol. .

Abstract

Background: Many short-read genome assemblies have been found to be incomplete and contain mis-assemblies. The Vertebrate Genomes Project has been producing new reference genome assemblies with an emphasis on being as complete and error-free as possible, which requires utilizing long reads, long-range scaffolding data, new assembly algorithms, and manual curation. A more thorough evaluation of the recent references relative to prior assemblies can provide a detailed overview of the types and magnitude of improvements.

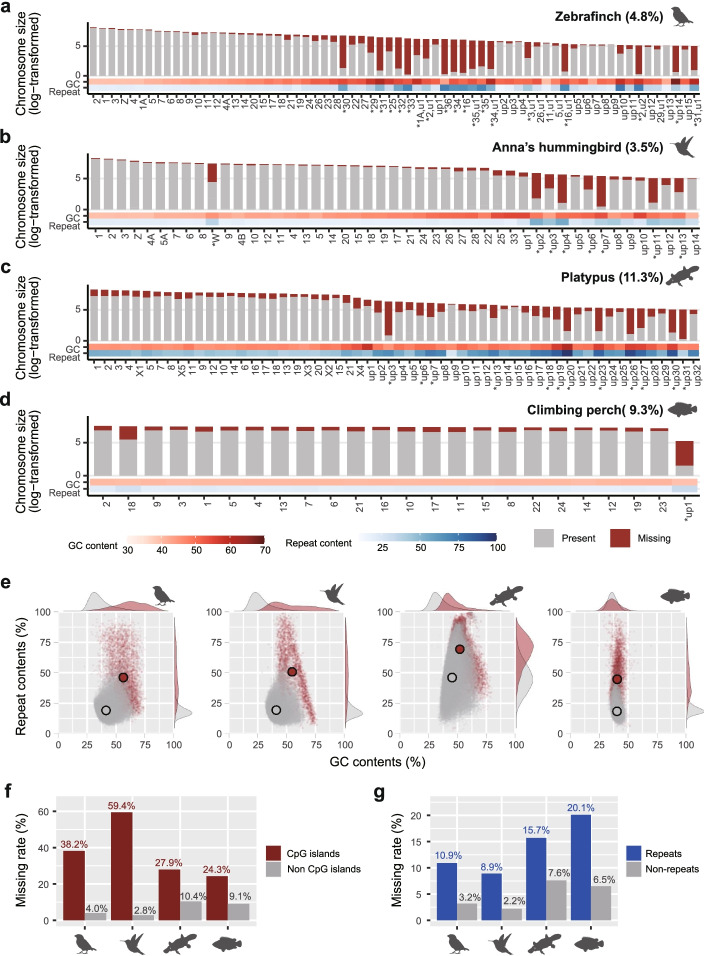
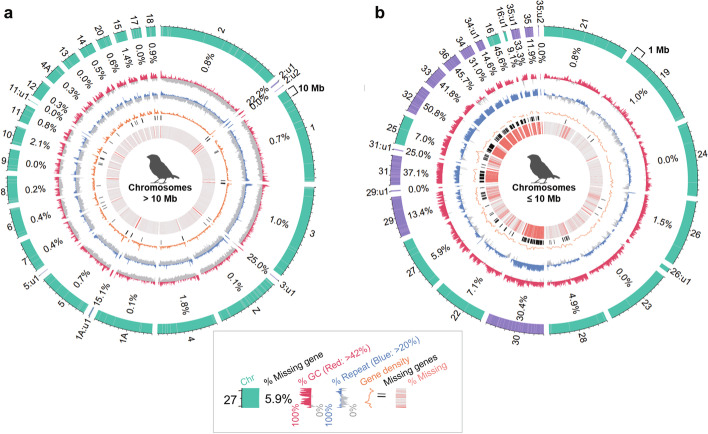
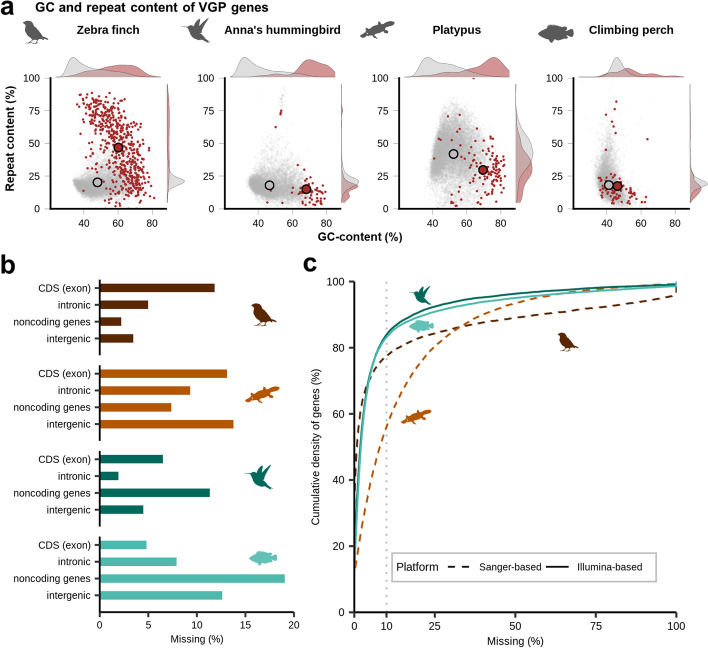
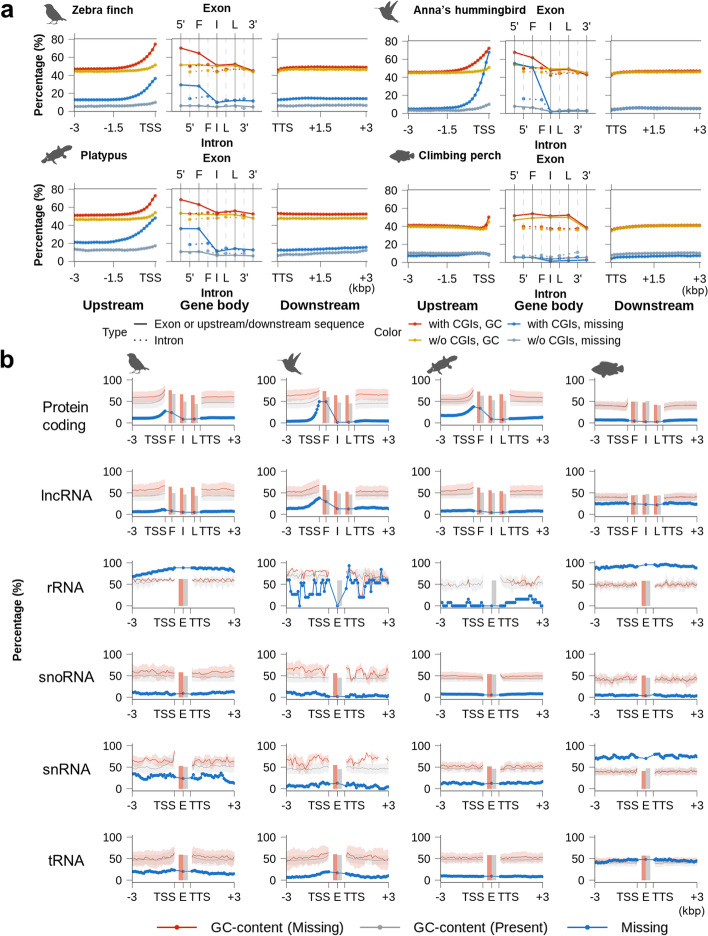
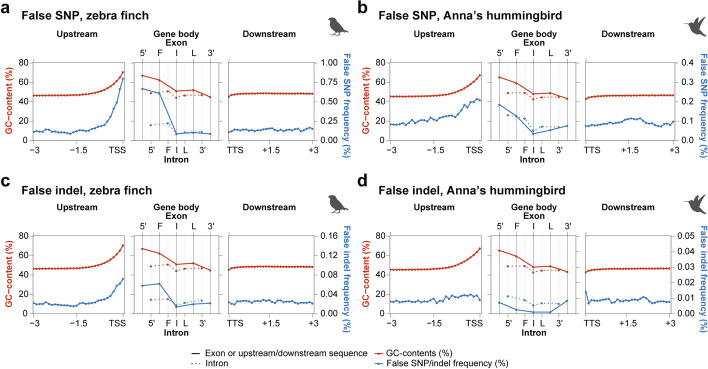
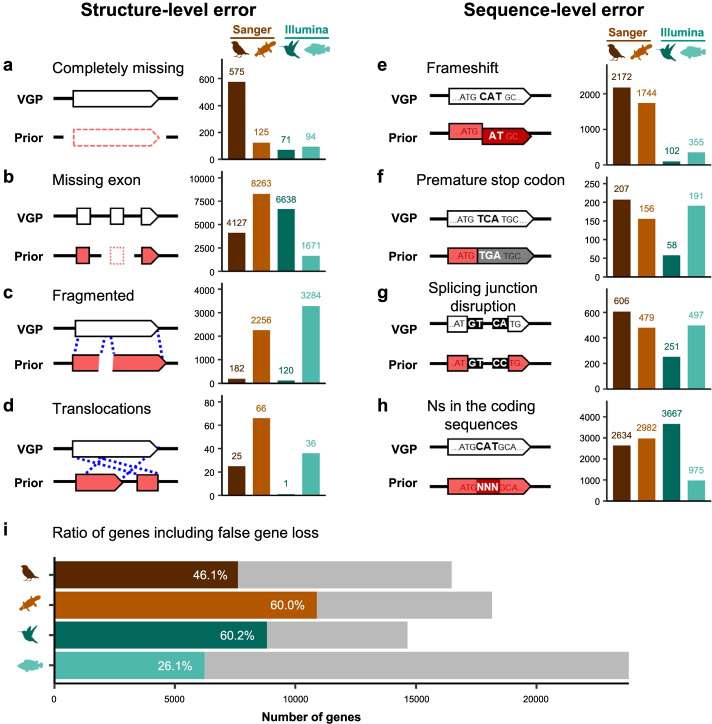
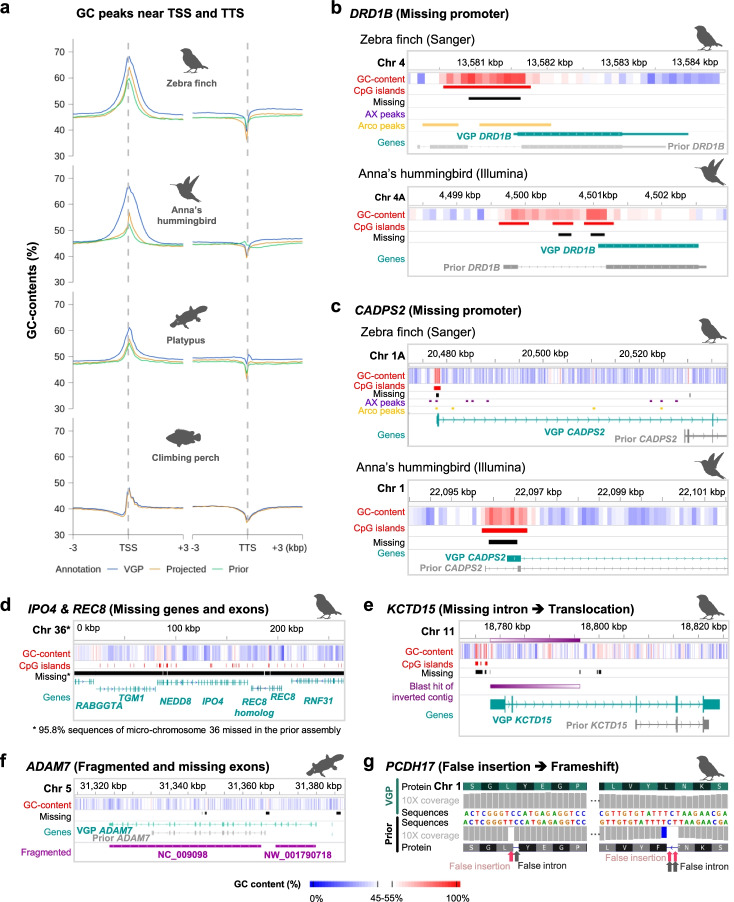
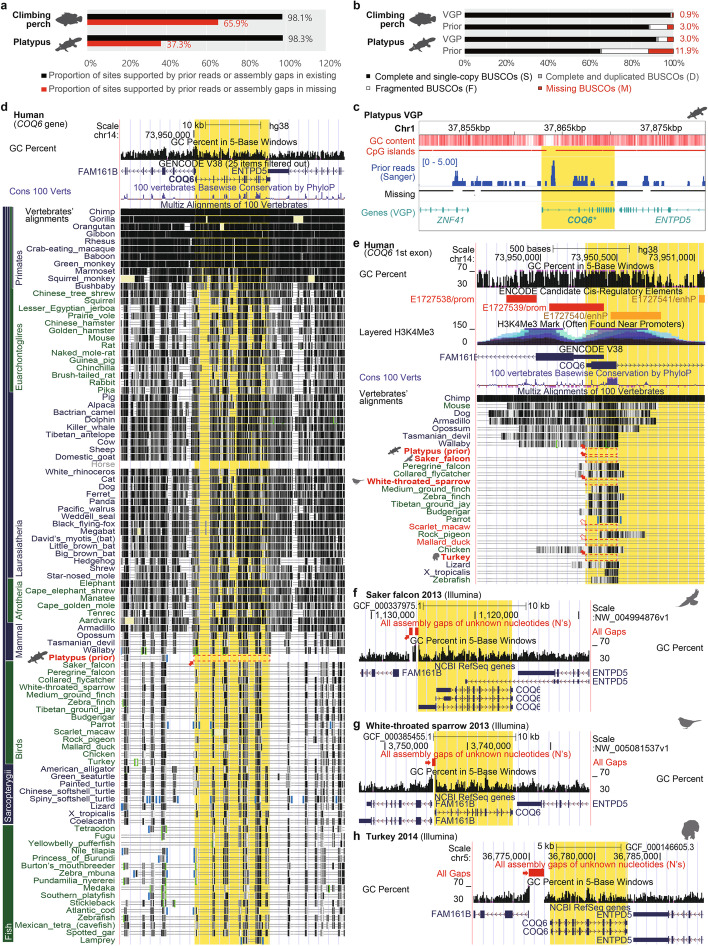
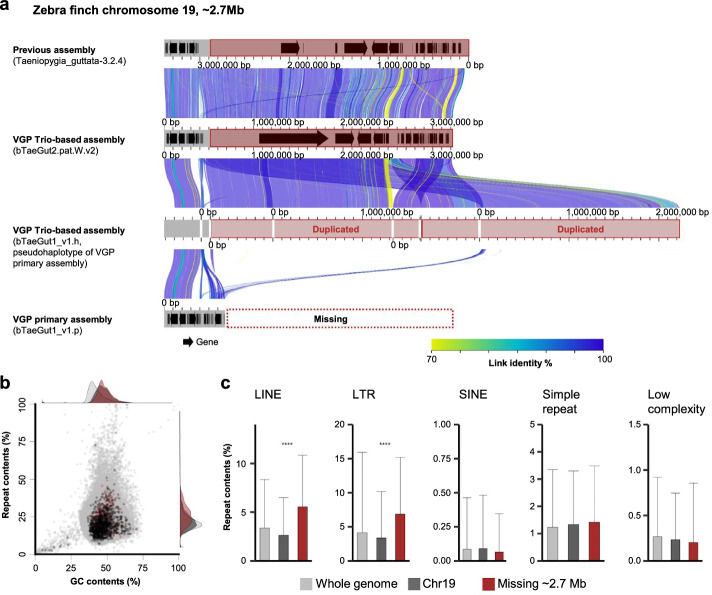
Results: Here we evaluate new vertebrate genome references relative to the previous assemblies for the same species and, in two cases, the same individuals, including a mammal (platypus), two birds (zebra finch, Anna's hummingbird), and a fish (climbing perch). We find that up to 11% of genomic sequence is entirely missing in the previous assemblies. In the Vertebrate Genomes Project zebra finch assembly, we identify eight new GC- and repeat-rich micro-chromosomes with high gene density. The impact of missing sequences is biased towards GC-rich 5'-proximal promoters and 5' exon regions of protein-coding genes and long non-coding RNAs. Between 26 and 60% of genes include structural or sequence errors that could lead to misunderstanding of their function when using the previous genome assemblies.

Conclusions: Our findings reveal novel regulatory landscapes and protein coding sequences that have been greatly underestimated in previous assemblies and are now present in the Vertebrate Genomes Project reference genomes.

Keywords: Annotation; GC content; Gene structure; Genomic dark matter; Genomics.


Conflict of interest statement

SC is currently a CEO of eGnome Inc. and GZ is currently an advisor of BGI Group: Shenzhen, Guangdong, CN. All other authors declare that they have no competing interests.

Figures

Fig. 1
Fig. 1
Proportion, GC content, and repeat content of missing regions in prior assemblies found in VGP assemblies. a–d Logarithm of identified chromosome or scaffold size for those greater than 100 kbp in each of the VGP assemblies. Gray and red bars highlight the proportion of sequence present or missing in the prior assemblies, respectively. Below each chromosome/scaffold is a heatmap of the GC and repeat contents of the missing sequence. up, unplaced scaffolds; u, unlocalized within the chromosome named. * indicates the scaffolds with over 30% of missing sequences in the prior assembly. e Distributions of % GC content and % repeat content in 10 kbp consecutive blocks of missing or present sequences. Large dots indicate the average of GC and repeat content, which were significantly higher in the missing regions (red) than in the previously present (gray) regions except GC content of climbing perch (p < 0.0001, Wilcoxon rank-sum test). f, g Missing rates in prior assemblies for CpG islands, repeats, and control non-CpG and non-repeated regions
Fig. 2
Fig. 2
Chromosome profiles of previously missing protein-coding genes recovered in the VGP zebra finch assembly. a Circos plot of chromosomes greater than 10 Mb in size. b Circos plot of chromosomes less than 10 Mb in size. In the zebra finch, previously 20 or 40 Mb were used to classify micro- and macro-chromosomes [23], but we used 10 Mb for effective visualization. The two plots are not to scale. Shown from the outer to inner circle are the following: Chromosome number name (u: unlocalized) with previously present labelled in green, newly assembled and assigned labelled in purple, and assembly gaps labelled in gray lines in the outermost circle; % ratio of missing genes in the previous assembly; GC content, over the average of 42% in red and under in gray; Repeat content, over the average of 20% in blue and under in gray; Gene density in non-overlapping 200 kbp windows, orange line; Loci of totally missing genes in the prior assembly, black bars; Alignment with the previous assembly, with red bars as unaligned regions. Circos plots were generated with R package OmicCircos [24]. Chromosome-level scaffolds were sorted in descending order by size. Each scaffold was binned in consecutive 10 kbp blocks. Missing ratio of protein-coding genes was calculated by dividing the number of completely missing genes with the number of all genes on each scaffold. Gene density was calculated with BEDtools [25] makewindows and intersect
Fig. 3
Fig. 3
Amount and characteristics of missing genes and exons. a GC and repeat content of completely missing genes in previous assemblies (red) but present in the VGP assemblies compared to those of genes present (gray) within both previous VGP assemblies. b Percent missing of exonic, intronic, non-coding genic, and intergenic sequences in the prior assemblies. c Cumulative density plot of protein-coding genes as a function of percent missing sequence. Illumina-based assemblies (Anna’s hummingbird and climbing perch) have more complete genes compared to Sanger-based assemblies (zebra finch and platypus). Gray dashed line indicates where 10% of a gene is missing
Fig. 4
Fig. 4
Distribution of previously missing sequences and GC content within or near genes in VGP assemblies. a Average missing ratio and GC content of VGP RefSeq annotated multi-exon protein-coding genes separated by the presence or absence of upstream CpG islands (CGIs). Left and right panels indicate the upstream and downstream 3 kbp sequences of a gene in 100-bp consecutive blocks. Middle panels indicate the gene body regions with exons (top) and introns (bottom) positions. b GC profile of previously missing and present regions in various types of genes. Solid line with transparent background indicates average and S.D. of GC content calculated from 100-bp consecutive blocks extracted from the upstream and downstream 3 kbp regions of genes. Blocks were classified as missing if their missing ratio was over 90%. Missing was calculated by the percentage of missing blocks among all blocks. Bar indicates the average GC content of exons (F: first exon, I: internal exon, L: last exon, E: exon without consideration of its order)
Fig. 5
Fig. 5
Biased distribution of sequencing errors near GC-rich 5′-proximal regions of protein-coding genes. a–d Average GC content (red) and frequency of false SNPs or false indels (blue) found in the exons and introns of protein-coding genes (5′: 5′UTR, F: First coding, I: Internal coding, L: last coding, 3′: 3′UTR exon or intron). Left and right panels indicate the upstream and downstream 3 kbp sequences of genes in 100-bp consecutive blocks
Fig. 6
Fig. 6
Types and amount of false gene losses in the previous assemblies relative to the VGP assemblies. a–h Example model (left) and the number of genes affected in each species (right) by each type of false gene loss. i Relative proportion (colored) of genes with false gene losses in the previous assemblies, calculated from the total number of annotated genes in the VGP assemblies (gray)
Fig. 7
Fig. 7
Effect of false gene losses in the previous assemblies on annotations. a GC content peaks near TSSs and TTSs from VGP or prior annotations (blue: VGP annotation, yellow: VGP annotation projected on the prior assembly by CAT, green: prior annotation). b, c DRD1B and CADPS2 were missing 5′ UTRs, CpG islands of promoter regions, and some coding sequence in the prior assemblies, resulting in the false understanding of the genes’ structures and false annotations. In the zebra finch, the missing regions of both genes are inferred regulatory regions based on open chromatin ATAC peaks unique to Area X (AX) and arcopallium (Arco) compared to striatum brain regions, respectively. d IPO4, REC8, and immediate syntenic genes were present in the VGP zebra finch assembly while they were missing in the prior assembly. e KCTD15 was erroneously assembled with the inverted contig including its first and second exons in the prior assembly. f ADAM7 was fragmented on different two scaffolds and its N-terminal 6 exons were missed in the prior annotation. g PCDH17 included frameshift inducing indels in the coding region in the prior assembly, which resulted in false prediction of 1 and 2 bp length introns to compensate for the frameshift error
Fig. 8
Fig. 8
COQ6 is an example gene that is falsely missing due to sequence and assembly errors in a highly divergent GC-rich ortholog. a Proportions of sites supported by prior reads or assembly gaps in missing or existing regions in prior assemblies. Red and black colors indicate missing and existing regions, respectively. b BUSCO comparisons between prior and VGP genome assemblies of platypus and climbing perch originating from different assemblies but also different platypus individuals. Red color indicates the percentages of missing BUSCO genes in each genome. c Genomic features and prior read depths on the COQ6 gene and its neighbor genes. Prior reads were generated with the Sanger platform. Prior missing BUSCO gene, COQ6, marked as bold and asterisk with yellow highlight. d COQ6 was highly conserved in vertebrates except in the previous assembly of platypus. e Missing first exon and promoter of COQ6 in the prior assembly of platypus and several genome assemblies of birds. The GC-rich regions nearby the first exon were regarded as promoters, based on histone modification (H3K27Ac). Filled red arrows and red boxes indicate species with missing errors on the regions validated with data in the UCSC genome browser. Unfilled red arrows and red dashed boxes indicate species with candidates of missing and scaffolding errors. f–h Missing errors supported by assembly gaps on the 5′ GC-rich region of COQ6 in Illumina-based genome assemblies of saker falcon, white-throated sparrow, and turkey, respectively. Filled red arrows and red boxes indicate gaps near 5′ GC-rich regions
Fig. 9
Fig. 9
Genomic regions that failed to be assembled in chromosome-level scaffolds of the VGP zebra finch primary assembly (bTaeGut1_v1.p). a Alignment between the previous, VGP Trio-based, VGP alternate and VGP primary assemblies for a 2.7 Mb end of chromosome 19. Gray, chromosome-level scaffolds. Black arrows, annotated genes. Links between gray bars indicate the alignment between each scaffold. b, GC- and repeat content of the 2.7 Mb region missing in the VGP primary assembly. Gray, dark gray, and red indicate GC and repeat content calculated from 10-kbp consecutive blocks extracted from the whole genome of a VGP trio-based assembly, chromosome 19, and the 2.7 Mb end of chromosome 19, respectively. c Repeat profile of the 2.7-Mb region missing in the VGP primary assembly. Repeat content was calculated from 10-kbp consecutive blocks extracted from the whole genome (gray), chromosome 19 (dark gray), or 2.7 Mb end of chromosome 19 (red) of the VGP Trio-based assembly. Bars and error bars indicate the mean and S.D. of repeat content of the blocks (****: p < 0.0001, ***: p < 0.001, **: p < 0.01, *: p < 0.05. p-values were calculated by ANOVA)

References

    1. De Lorenzi L, Parma P. Identification of some errors in the genome assembly of Bovidae by FISH. Cytogenetic and Genome Research. 2020;160:85–93. - PubMed
    1. Korlach J, Gedman G, Kingan SB, Chin C-S, Howard JT, Audet J-N, Cantin L, Jarvis ED. De novo PacBio long-read and phased avian genome assemblies correct and add to reference genes generated with intermediate and short reads. Gigascience. 2017;6:gix085. - PMC - PubMed
    1. Peona V, Weissensteiner MH, Suh A. How complete are “complete” genome assemblies?—An avian perspective. Wiley Online Library; 2018. - PubMed
    1. Zhang G, Li C, Li Q, Li B, Larkin DM, Lee C, Storz JF, Antunes A, Greenwold MJ, Meredith RW. Comparative genomics reveals insights into avian genome evolution and adaptation. Science. 2014;346:1311–1320. - PMC - PubMed
    1. Lindblad-Toh K, Garber M, Zuk O, Lin MF, Parker BJ, Washietl S, Kheradpour P, Ernst J, Jordan G, Mauceli E. A high-resolution map of human evolutionary constraint using 29 mammals. Nature. 2011;478:476–482. - PMC - PubMed

Publication types

LinkOut - more resources