. 2022 Sep 27;8(1):96.
doi: 10.1038/s41421-022-00440-z.

Metabolic control of histone acetylation for precise and timely regulation of minor ZGA in early mammalian embryos

Affiliations

Metabolic control of histone acetylation for precise and timely regulation of minor ZGA in early mammalian embryos

Jingyu Li et al. Cell Discov. .

Abstract

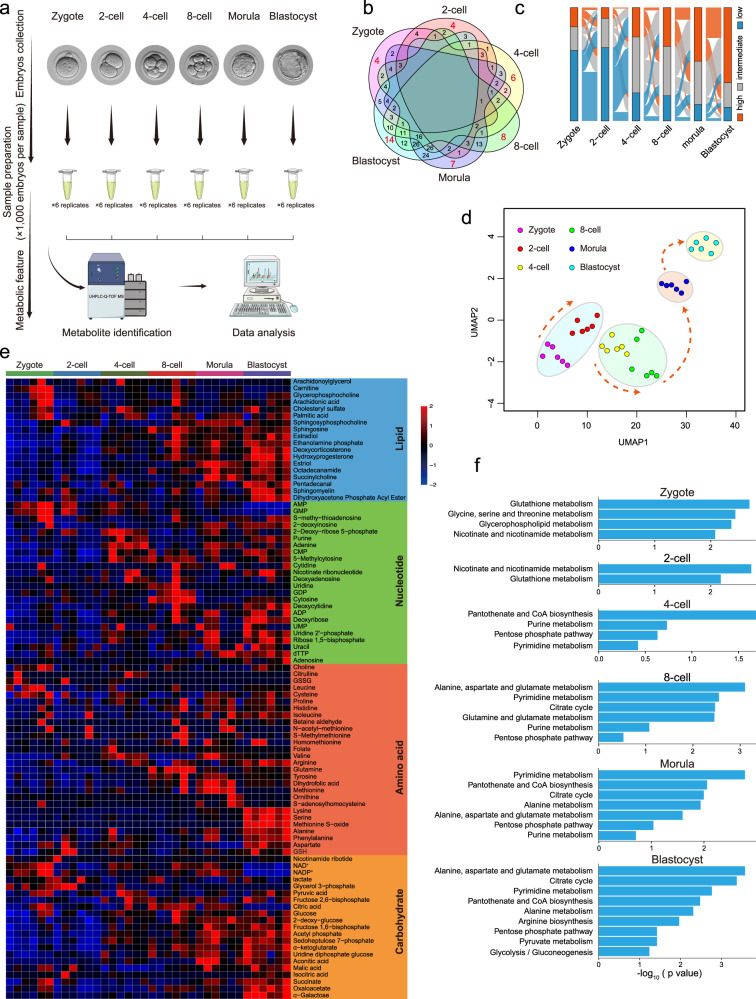
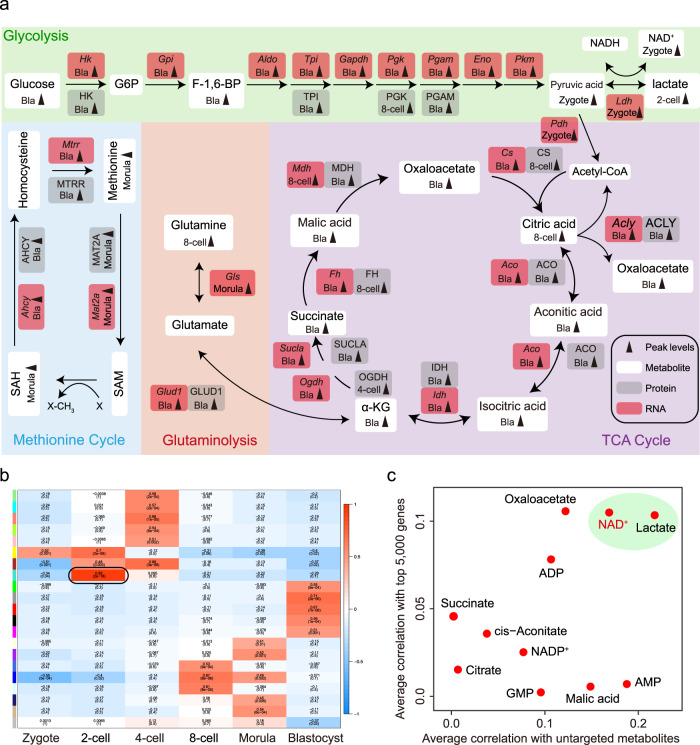
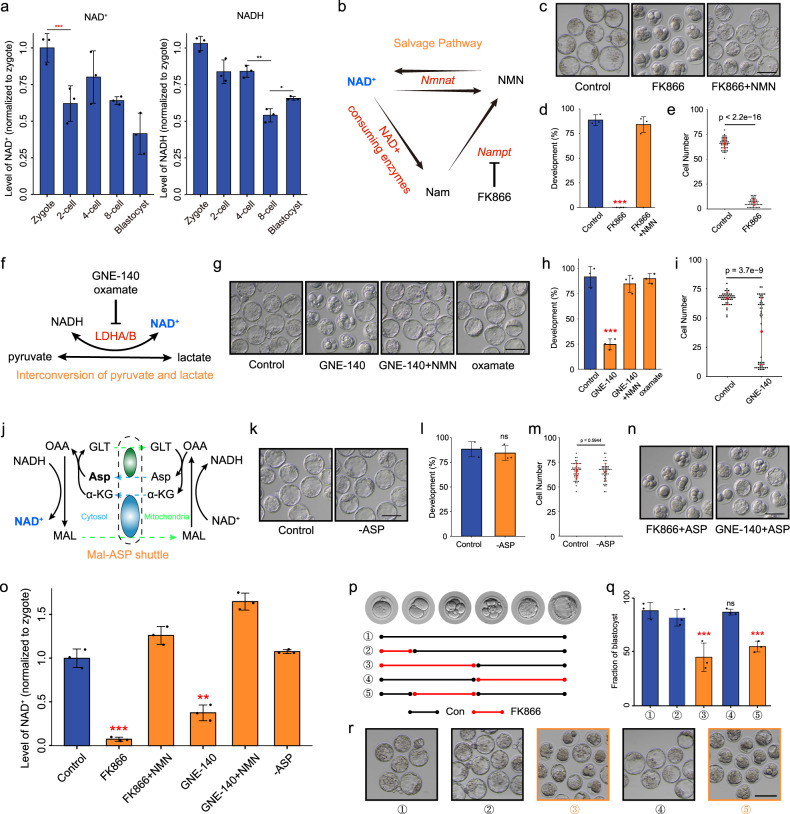
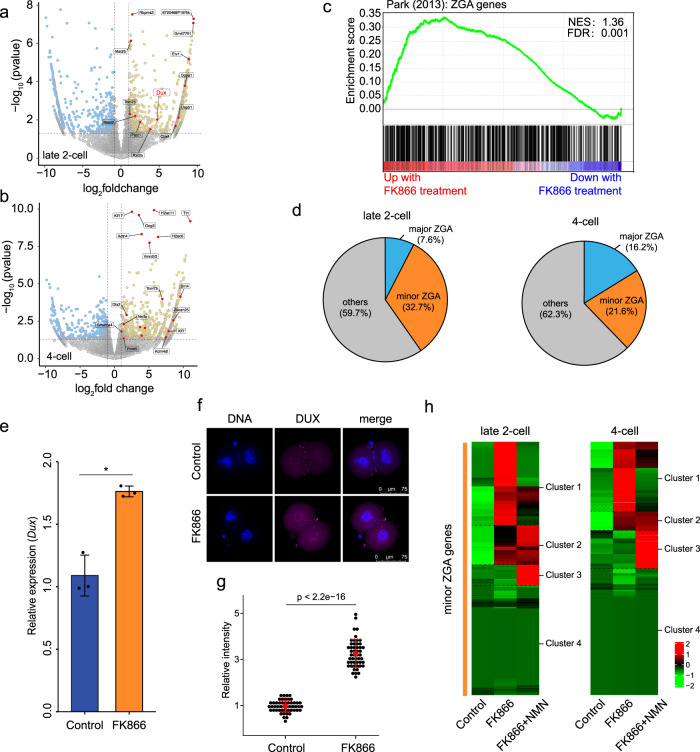
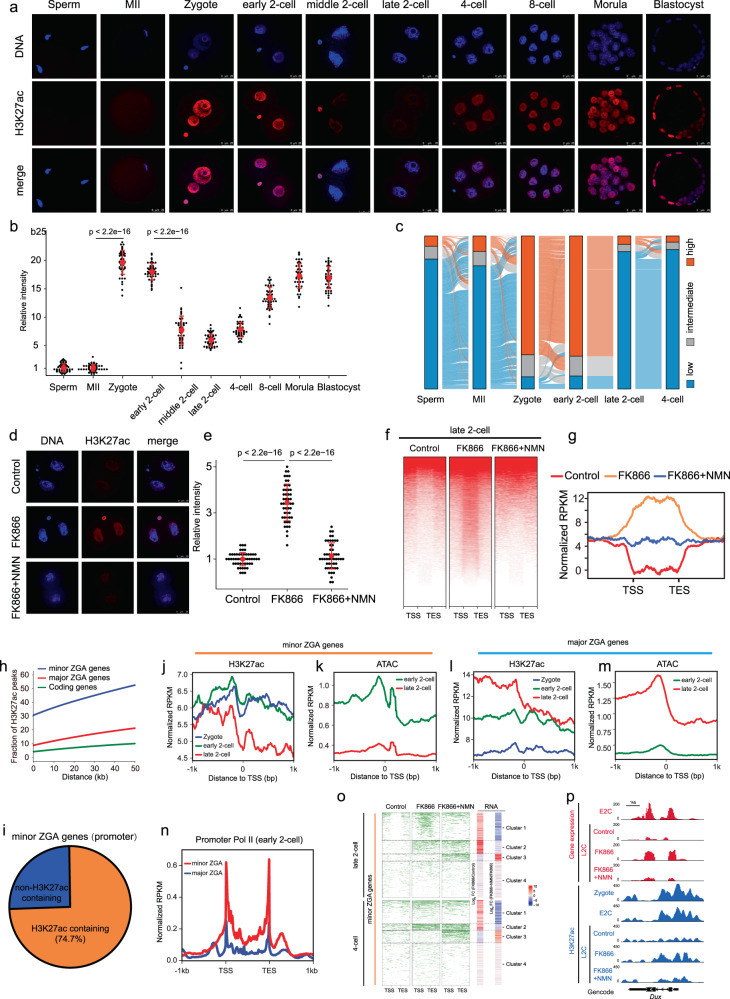
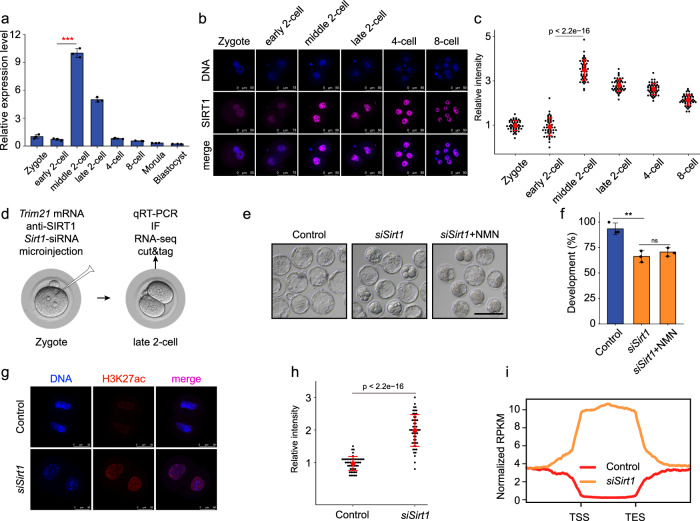
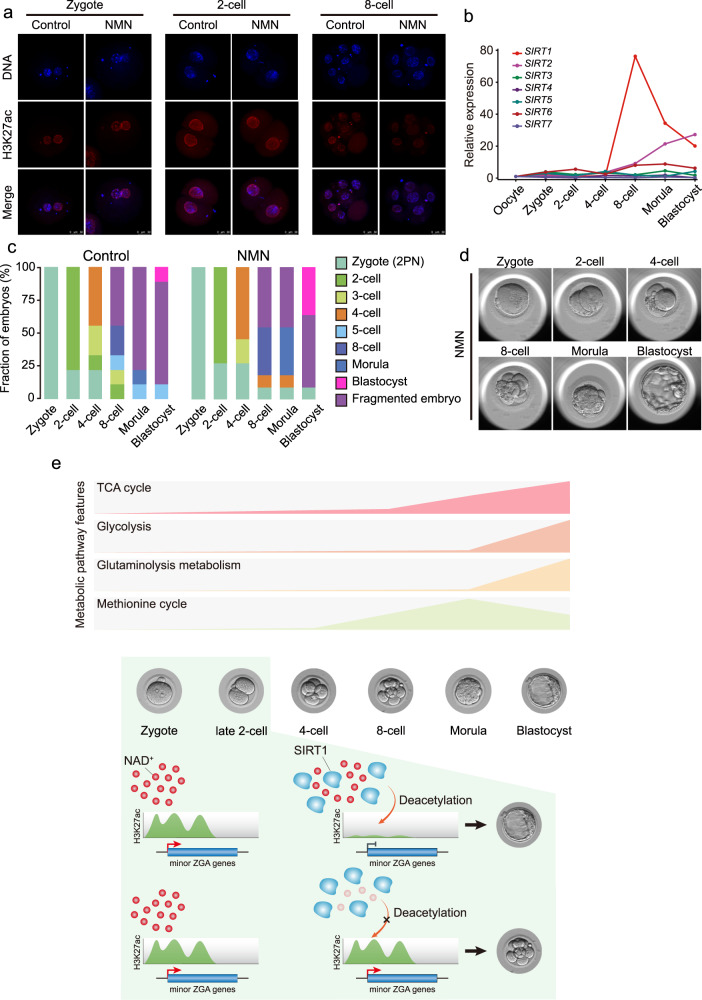
Metabolism feeds into the regulation of epigenetics via metabolic enzymes and metabolites. However, metabolic features, and their impact on epigenetic remodeling during mammalian pre-implantation development, remain poorly understood. In this study, we established the metabolic landscape of mouse pre-implantation embryos from zygote to blastocyst, and quantified some absolute carbohydrate metabolites. We integrated these data with transcriptomic and proteomic data, and discovered the metabolic characteristics of the development process, including the activation of methionine cycle from 8-cell embryo to blastocyst, high glutaminolysis metabolism at blastocyst stage, enhanced TCA cycle activity from the 8-cell embryo stage, and active glycolysis in the blastocyst. We further demonstrated that oxidized nicotinamide adenine dinucleotide (NAD+) synthesis is indispensable for mouse pre-implantation development. Mechanistically, in part, NAD+ is required for the exit of minor zygotic gene activation (ZGA) by cooperating with SIRT1 to remove zygotic H3K27ac. In human, NAD+ supplement can promote the removal of zygotic H3K27ac and benefit pre-implantation development. Our findings demonstrate that precise and timely regulation of minor ZGA is controlled by metabolic dynamics, and enhance our understanding of the metabolism of mammalian early embryos.


Conflict of interest statement

The authors declare no competing interests.

Figures

Fig. 1
Fig. 1. Metabolomic profiling of mouse pre-implantation embryo development.
a Schematic overview of mouse embryo preparation and metabolome profiling during mouse pre-implantation embryo development. b Venn diagram showing the overlap among metabolites across all stages. The number of significantly abundant metabolites is shown in red. c Alluvial plots of the global dynamics of high, intermediate, and low metabolites based on their levels during early embryo development. d UMAP analysis. Metabolites marked with the same color represent six replicates of the same stage. e Heatmap of metabolite dynamics during mouse embryo development, classified according to metabolic pathways. f KEGG analysis of abundant metabolites in each stage.
Fig. 2
Fig. 2. Activities of metabolic pathways during mouse pre-implantation embryo development.
a Schematic diagram of carbohydrate metabolism, integrated with transcriptomic and proteomic data. Gray arrows indicate peak level at indicated stage. White boxes represent metabolites, and gray and red boxes represent protein and mRNA of indicated metabolic enzymes, respectively. b Stage-specific co-expression genes and metabolite modules and their correlation to development stage. Each row corresponds to a co-expression module. Numbers in each square represent correlation coefficients between the module and development stage, with p-values in brackets. Red and blue squares indicate positive and negative correlations, respectively; white indicates no correlation. c Correlation of metabolites and genes at the 2-cell embryo stage. The X-axis shows the correlations of a specific metabolite with the top 5000 genes. The Y-axis shows the correlations of a specific metabolite with other metabolites.
Fig. 3
Fig. 3. NAD+ depletion impairs early mouse embryo development.
a NAD+ and NADH levels during early mouse embryo development. b Overview of the NAM salvage pathway. c Representative images and d developmental rates of control, FK866-treated, and FK866 + NMN-supplemented embryo groups. Data are from three independent experiments. ***P < 0.001 (Student’s t-test). Scale bars, 50 μm. e Quantification of cells in control and FK866-treated embryo groups. Dots represent cell numbers of single embryos. f Overview of the interconversion pathway of pyruvic acid and lactate. g Representative images and h developmental rates of control, GNE-140-treated, GNE-140+NMN-supplemented, and oxamate-treated embryos. Data are from three independent experiments. ***P < 0.001 (Student’s t-test). Scale bars, 50 μm. i Quantification of cells in control and GNE-140-treated embryos. Dots represent cell numbers of single embryos. j Overview of the Mal-Asp shuttle. GLT glutamate, MAL malate, OAA oxaloacetate. k Representative images and l developmental rates of control and Asp-deletion embryos. Data are from three independent experiments. ***P < 0.001 (Student’s t-test). Scale bars, 50 μm. m Quantification of cells in control and Asp-deletion embryos. Dots represent cell numbers of single embryos. n Development of FK866- and GNE-140-treated embryos supplemented with Asp. o NAD+ level in control, FK866-treated, FK866 + NMN, GNE-140-treated, GNE-140 + NMN, and Asp-deletion late 2-cell embryos. p–r Timeline of FK866 treatment. Embryos were cultured in control or FK866-addition medium. The stages of FK866 treatment are indicated in (p). Developmental rates q and representative images r of each group are shown. Data are from three independent experiments. **P < 0.01, ***P < 0.001 (Student’s t-test). Scale bars, 50 μm.
Fig. 4
Fig. 4. NAD+ depletion disturbs minor ZGA in early mouse embryos.
RNA-seq analysis of control and FK866-treated a late 2-cell and b 4-cell mouse embryos. Volcano plots show gene expression changes. Yellow and blue dots indicate upregulated (fold change > 1) and downregulated (fold change < −1) genes with P < 0.05. c Gene set enrichment analysis (GSEA) of ZGA genes showed preferential upregulation in FK866-treated late 2-cell embryos. d Pie chart showing the fraction of minor and major ZGA genes upregulated in late 2-cell and 4-cell embryos. e Results of quantitative polymerase chain reaction (qPCR) showing Dux upregulation in FK866-treated late 2-cell embryos. Data are means ± SEM from three independent experiments. f Representative confocal images of control and FK866-treated embryos stained with Dux antibody. Scale bars, 75 µm. g Quantification of DUX fluorescence intensity in control and FK866-treated embryos. Each dot represents a single nucleus. h Heatmaps show that minor ZGA genes were upregulated between control and FK866-treated embryos, which was rescued by NMN supplementation. NMN recovered the overexpression of 62% and 72.2% minor ZGA genes at late 2-cell and 4-cell stages, respectively. Mean values of two biological replicates were scaled and are represented as Z scores.
Fig. 5
Fig. 5. NAD+-mediated erasure of zygotic H3K27ac avoids excessive minor ZGA.
a Immunostaining of H3K27ac during mouse pre-implantation embryo development. One representative image from three independent experiments is shown. Scale bar, 25 μm. b Quantification of H3K27ac fluorescence intensity in mouse embryos. Each dot represents a single nucleus. c Alluvial plots showing the global dynamics of zyH3K27ac during early embryo development. d Representative confocal images of control, FK866-treated, and FK866 + NMN-treated late 2-cell embryos stained with H3K27ac antibody. Scale bars, 25 µm. e Quantification of H3K27ac fluorescence intensity in late 2-cell embryos. Each dot represents a single nucleus. f Heatmap showing H3K27ac signals ranked by their relative changes after FK866 treatment. NMN rescued the changes induced by FK866 treatment in late 2-cell embryos. g Metaplot of H3K27ac peaks (Z-score normalized; n = 15,920) in control, FK866-treated, and FK866 + NMN-treated late 2-cell embryos. h Comparison of the distance between H3K27ac peaks and ZGA or coding genes in the genome. The Y-axis shows the proportion of H3K27ac peaks associated with genes. About 30%–50% of H3K27ac peaks are distributed from the peak to a distance of 50 kb to the TSSs of minor ZGA genes, and the proportions are higher than those of major ZGA genes and other coding genes. i Pie charts showing the percentages of minor ZGA genes whose promoters enriched the zyH3K27ac at the zygote stage. (j, l) Metaplot showing the H3K27ac enrichment (Z-score normalized) at the promoters of the minor ZGA genes (j) and major ZGA genes (l) at individual stages. (k, m) Metaplot showing the ATAC-seq enrichment (Z-score normalized) at the promoters of the minor ZGA genes (k) and major ZGA genes (m) at individual stages. n Metaplot showing the Pol II enrichment (Z-score normalized) at the promoters of minor and major ZGA genes at the early 2-cell stages. o Heatmap (left) showing H3K27ac signals ranked by their relative changes following FK866 or FK866 + NMN treatment. Heatmap (right) shows that minor ZGA genes were upregulated between control and FK866-treated embryos, and rescued by NMN supplementation. Mean values of two biological replicates were scaled and are represented as Z scores. p Genome browser view of RNA-seq and H3K27ac signals at the Dux locus in control, FK866-treated, and FK866 + NMN-treated late 2-cell embryos.
Fig. 6
Fig. 6. NAD+ could cooperate with Sirt1 to remove zyH3K27ac.
a The relative expression of Sirt1 was measured by quantitative reverse-transcribed PCR (qRT-PCR) analysis. Error bars indicate standard deviation (SD). b Immunostaining of SIRT1 during mouse pre-implantation embryo development. One representative image from three independent experiments is shown. Scale bar, 50 μm. c Quantification of SIRT1 fluorescence intensity in mouse embryos. Each dot represents a single nucleus. d Schematic presentation of the Sirt1 knockdown experimental protocol. (e, f) Representative images (e) and developmental rates (f) of control and Sirt1 knockdown embryos. NMN (10 µM) addition did not rescue blastocyst formation of Sirt1-knockdown embryos. Data are from three independent experiments. **P < 0.01 (Student’s t-test). Scale bars, 50 μm. g Representative confocal images of control and Sirt1-knockdown embryos stained with H3K27ac antibody. Scale bars, 75 µm. h Quantification of H3K27ac fluorescence intensity in control and Sirt1 knockdown embryos. Each dot represents a single nucleus. i Metaplot of H3K27ac signals (Z-score normalized) in control and Sirt1 knockdown late 2-cell embryos.
Fig. 7
Fig. 7. NAD+ supplement promotes the removal of zygotic H3K27ac and benefits preimplantation development of human embryos.
a Representative confocal images of control and NMN-treated human embryos stained with H3K27ac antibody. Scale bars, 50 µm. b Sirtuin family expression patterns according to RNA-seq data in human pre-implantation embryos. c Stacked bar plots showing fraction of human embryos at the different developmental stages after NMN addition (right side, n = 11), or control (left side, n = 9). d Representative images of the development of NMN-treated human embryos. e Metabolic characteristics during mouse pre-implantation development (upper) and a model of NAD+ involvement in the precise and timely regulation of minor ZGA (below).

References

    1. Clift D, Schuh M. Restarting life: fertilization and the transition from meiosis to mitosis. Nat. Rev. Mol. Cell Biol. 2013;14:549–562. doi: 10.1038/nrm3643. - DOI - PMC - PubMed
    1. Zernicka-Goetz M, Morris SA, Bruce AW. Making a firm decision: multifaceted regulation of cell fate in the early mouse embryo. Nat. Rev. Genet. 2009;10:467–477. doi: 10.1038/nrg2564. - DOI - PubMed
    1. Sozen B, Can A, Demir N. Cell fate regulation during preimplantation development: a view of adhesion-linked molecular interactions. Dev. Biol. 2014;395:73–83. doi: 10.1016/j.ydbio.2014.08.028. - DOI - PubMed
    1. Schulz KN, Harrison MM. Mechanisms regulating zygotic genome activation. Nat. Rev. Genet. 2019;20:221–234. doi: 10.1038/s41576-018-0087-x. - DOI - PMC - PubMed
    1. Jukam D, Shariati SAM, Skotheim JM. Zygotic genome activation in Vertebrates. Dev. Cell. 2017;42:316–332. doi: 10.1016/j.devcel.2017.07.026. - DOI - PMC - PubMed