. 2023 May;93(6):1591-1598.
doi: 10.1038/s41390-022-02316-0. Epub 2022 Sep 27.

Quantitative lung ultrasound detects dynamic changes in lung recruitment in the preterm lamb

Affiliations

Quantitative lung ultrasound detects dynamic changes in lung recruitment in the preterm lamb

Arun Sett et al. Pediatr Res. 2023 May.

Abstract

Background: Lung ultrasound (LUS) may not detect small, dynamic changes in lung volume. Mean greyscale measurement using computer-assisted image analysis (Q-LUSMGV) may improve the precision of these measurements.

Methods: Preterm lambs (n = 40) underwent LUS of the dependent or non-dependent lung during static pressure-volume curve mapping. Total and regional lung volumes were determined using the super-syringe technique and electrical impedance tomography. Q-LUSMGV and gold standard measurements of lung volume were compared in 520 images.

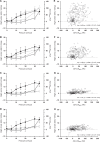
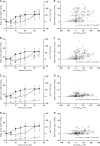
Results: Dependent Q-LUSMGV moderately correlated with total lung volume (rho = 0.60, 95% CI 0.51-0.67) and fairly with right whole (rho = 0.39, 0.27-0.49), central (rho = 0.38, 0.27-0.48), ventral (rho = 0.41, 0.31-0.51) and dorsal regional lung volumes (rho = 0.32, 0.21-0.43). Non-dependent Q-LUSMGV moderately correlated with total lung volume (rho = 0.57, 0.48-0.65) and fairly with right whole (rho = 0.43, 0.32-0.52), central (rho = 0.46, 0.35-0.55), ventral (rho = 0.36, 0.25-0.47) and dorsal lung volumes (rho = 0.36, 0.25-0.47). All correlation coefficients were statistically significant. Distinct inflation and deflation limbs, and sonographic pulmonary hysteresis occurred in 95% of lambs. The greatest changes in Q-LUSMGV occurred at the opening and closing pressures.

Conclusion: Q-LUSMGV detected changes in total and regional lung volume and offers objective quantification of LUS images, and may improve bedside discrimination of real-time changes in lung volume.

Impact: Lung ultrasound (LUS) offers continuous, radiation-free imaging that may play a role in assessing lung recruitment but may not detect small changes in lung volume. Mean greyscale image analysis using computer-assisted quantitative LUS (Q-LUSMGV) moderately correlated with changes in total and regional lung volume. Q-LUSMGV identified opening and closing pressure and pulmonary hysteresis in 95% of lambs. Computer-assisted image analysis may enhance LUS estimation of lung recruitment at the bedside. Future research should focus on improving precision prior to clinical translation.


Conflict of interest statement

The authors declare no competing interests.

Figures

Fig. 1
Fig. 1. ROI (red tracing) for measurement of Q-LUSMGV.
The ROI was delineated by (1) superior margin defined by the pleural surface; (2) lateral margin defined by the rib shadows; and (3) inferior margin defined by a depth of 50 pixels corresponding to one millimetre in depth. Q-LUSMGV; quantitative lung ultrasound mean grey value.
Fig. 2
Fig. 2. Dependent lung imaging.
A Static PV curve derived from the super-syringe method (squares, grey dashed line) and ∆Q-LUSMGV (circles, solid black line). All data are represented as median (IQR). ∆Q-LUSMGV is normalised to baseline. Open shapes represent the inflation limb and closed shapes the deflation limb. B Correlation between ∆Q-LUSMGV and total lung volume. AU arbitrary units, CI confidence interval, cm H2O centimetres of water, ml/kg, rho Spearman’s correlation coefficient, Q-LUSMGV quantitative lung ultrasound mean grey value. Left axis: lung volume (ml/kg). Right axis: ∆Q-LUSMGV.
Fig. 3
Fig. 3. Non-dependent lung imaging.
A Static PV curve derived from the super-syringe method (squares, grey dashed line) and ∆Q-LUSMGV (circles, solid black line). All data are represented as median (IQR). ∆Q-LUSMGV normalised to baseline. Open shapes represent the inflation limb and closed shapes the deflation limb.  B Correlation between ∆Q-LUSMGV and total lung volume. AU arbitrary units, CI confidence interval, cm H2O centimetres of water, ml/kg, rho Spearman’s correlation co-efficient, Q-LUSMGV quantitative lung ultrasound mean grey value. Left axis: lung volume (ml/kg). Right axis: ∆Q-LUSMGV.
Fig. 4
Fig. 4. Dependent lung.
AD Static regional PV curves from EIT (squares, grey dashed line) of the whole right lung (A), ventral (B), central (C) and dorsal (D) regions and Q-LUSMGV from dependent lung imaging (circles, black solid line). All data median (IQR). ∆Q-LUSMGV normalised to baseline. Open shapes represent the inflation limb and closed shapes the deflation limb. EH Correlation between ∆Q-LUSMGV and regional lung volume for the corresponding lung regions in panels AD. AU arbitrary units, CI confidence interval, cm H2O centimetres of water, EELV end-expiratory lung volume, rho Spearman’s correlation co-efficient, Q-LUSMGV quantitative lung ultrasound mean grey value. Left axis: lung volume (ml/kg). Right axis: ∆Q-LUSMGV.
Fig. 5
Fig. 5. Non-dependent lung.
AD Static regional PV curves from EIT (squares, grey dashed line) of the whole right lung (A), ventral (B), central (C) and dorsal (D) regions and ∆Q-LUSMGV from non-dependent lung imaging (circles, black solid line). All data median (IQR). ∆Q-LUSMGV normalised to baseline. Open shapes represent the inflation limb and closed shapes the deflation limb. EH Correlation between ∆Q-LUSMGV and regional lung volume for the corresponding lung regions in panels AD. AU arbitrary units, CI confidence interval, cm H2O centimetres of water, EELV end-expiratory lung volume, rho Spearman’s correlation co-efficient, Q-LUSMGV quantitative lung ultrasound mean grey value. Left axis: lung volume (ml/kg). Right axis: ∆Q-LUSMGV.

References

    1. De Luca, D. et al. Personalized medicine for the management of RDS in preterm neonates. Neonatology118, 127–138 (2021). - PubMed
    1. Thome U, Töpfer A, Schaller P, Pohlandt F. Comparison of lung volume measurements by antero-posterior chest X-ray and the Sf6 washout technique in mechanically ventilated infants. Pediatr. Pulmonol. 1998;26:265–272. doi: 10.1002/(SICI)1099-0496(199810)26:4<265::AID-PPUL6>3.0.CO;2-G. - DOI - PubMed
    1. Frerichs I, et al. Chest electrical impedance tomography examination, data analysis, terminology, clinical use and recommendations: consensus statement of the Translational EIT Development Study Group. Thorax. 2017;72:83–93. doi: 10.1136/thoraxjnl-2016-208357. - DOI - PMC - PubMed
    1. Lichtenstein DA, Mauriat P. Lung ultrasound in the critically ill neonate. Curr. Pediatr. Rev. 2012;8:217–223. doi: 10.2174/157339612802139389. - DOI - PMC - PubMed
    1. Brat R, et al. Lung ultrasonography score to evaluate oxygenation and surfactant need in neonates treated with continuous positive airway pressure. JAMA Pediatr. 2015;169:e151797. doi: 10.1001/jamapediatrics.2015.1797. - DOI - PubMed

Publication types