. 2022 Sep 27;8(1):112.
doi: 10.1038/s41523-022-00480-4.

Multianalyte liquid biopsy to aid the diagnostic workup of breast cancer

Affiliations

Multianalyte liquid biopsy to aid the diagnostic workup of breast cancer

Sonia Maryam Setayesh et al. NPJ Breast Cancer. .

Abstract

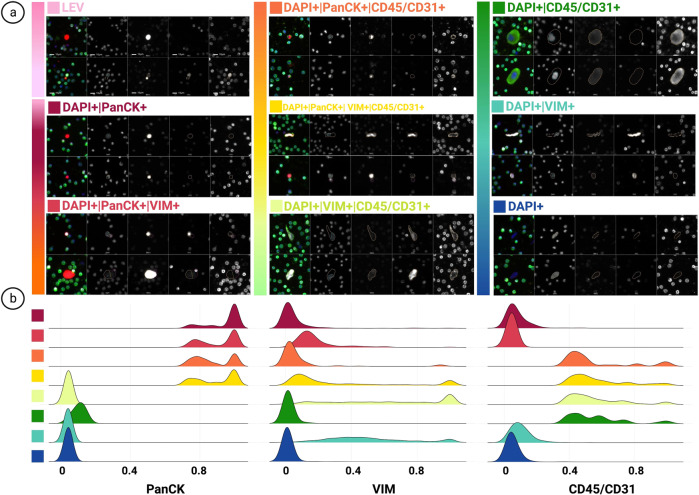
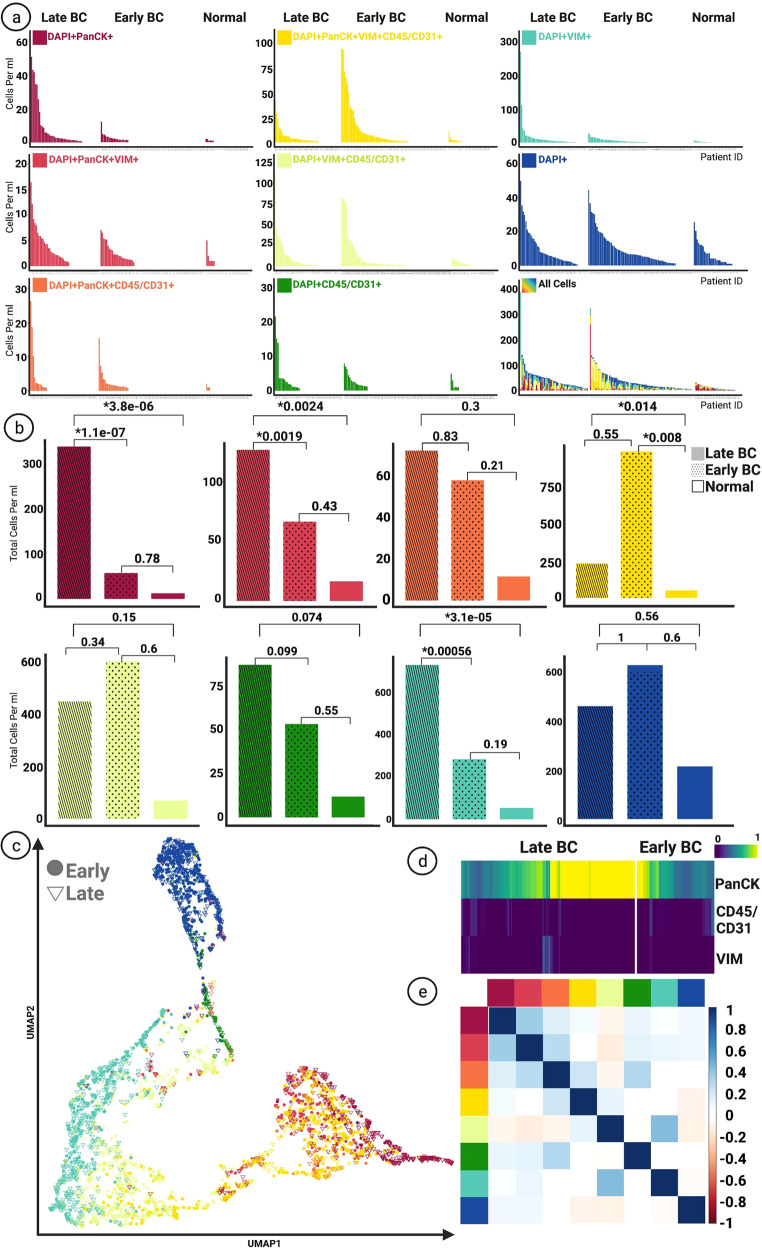
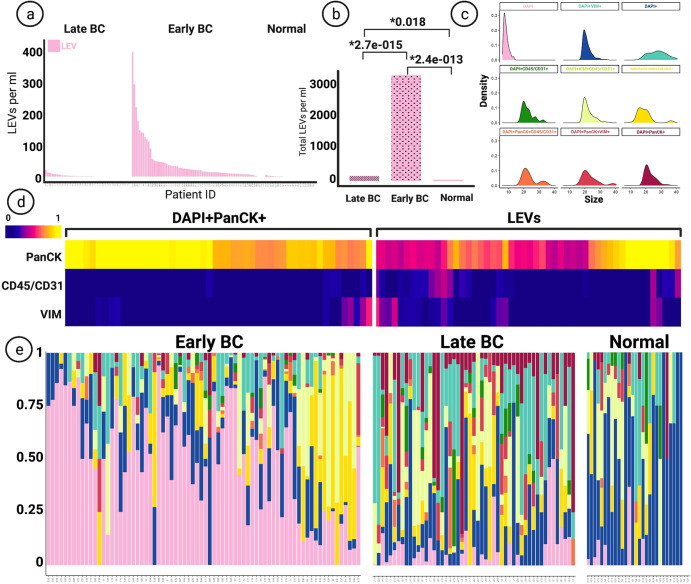
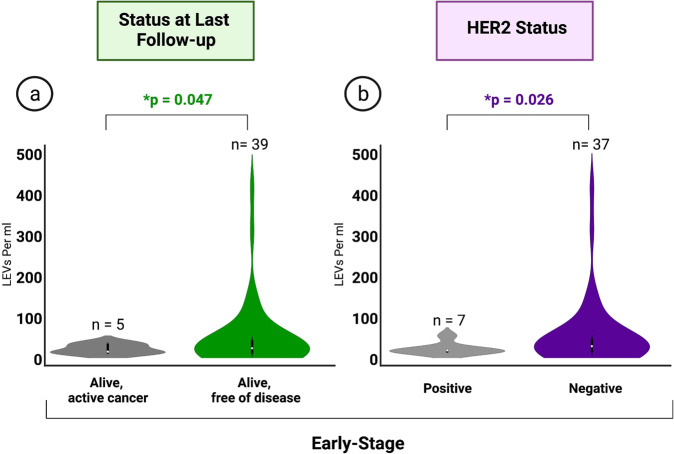
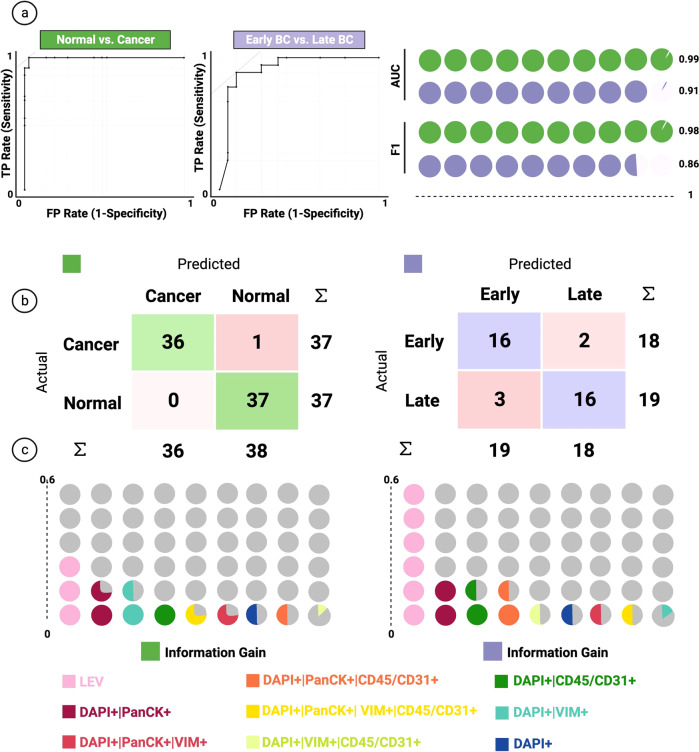
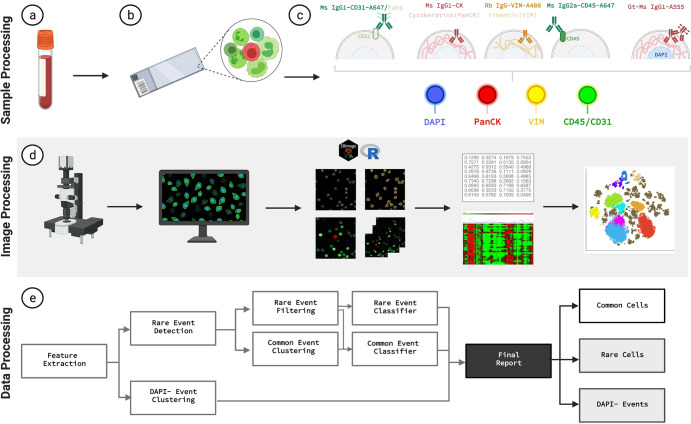
Breast cancer (BC) affects 1 in every 8 women in the United States and is currently the most prevalent cancer worldwide. Precise staging at diagnosis and prognosis are essential components for the clinical management of BC patients. In this study, we set out to evaluate the feasibility of the high-definition single cell (HDSCA) liquid biopsy (LBx) platform to stratify late-stage BC, early-stage BC, and normal donors using peripheral blood samples. Utilizing 5 biomarkers, we identified rare circulating events with epithelial, mesenchymal, endothelial and hematological origin. We detected a higher level of CTCs in late-stage patients, compared to the early-stage and normal donors. Additionally, we observed more tumor-associated large extracellular vesicles (LEVs) in the early-stage, compared to late-stage and the normal donor groups. Overall, we were able to detect reproducible patterns in the enumeration of rare cells and LEVs of cancer vs. normal donors and early-stage vs. late-stage BC with high accuracy, allowing for robust stratification. Our findings illustrate the feasibility of the LBx assay to provide robust detection of rare circulating events in peripheral blood draws and to stratify late-stage BC, early-stage BC, and normal donor samples.


Conflict of interest statement

The authors declare no competing non-financial interest but the following Financial Competing Interests for Carmen Ruiz Velasco: Inventor receiving royalties on patent licensed to Epic Sciences, Inc.; Anand Kolatkar: receiving stock and royalties, Epic Sciences, Inc., Nicholas Matsumoto: Inventor receiving royalties on patent licensed to Epic Sciences, Inc.; Rafael Nevarez: Inventor receiving royalties on patent licensed to Epic Sciences, Inc.; James B. Hicks: is an unpaid consultant/member on the Clinical Advisory Board, Epic Sciences, Inc.; Peter Kuhn: founder and Chief Scientific Advisor, and received stock and receiving dividends, Epic Sciences, Inc. The rest of the Authors declare no Financial Competing Interests.

Figures

Fig. 1
Fig. 1. HDSCA3.0 Rare Event Gallery.
a Images represent two candidate rare events, categorized by marker expression. b Signal distribution of immunofluorescent markers for channel-classified cells. Designated colors represent each channel-classified group, assigned in a. (LEVs not included due to variation in segmentation). Scale bar represent 10 μm.
Fig. 2
Fig. 2. Enumeration of Circulating Rare Cells.
a Frequency of enumerated rare cells between late-stage, early-stage, and the normal group based on channel classification. b Comparison of the distribution of rare cells between groups, Kruskal-Wallis H test (one-way ANOVA) performed on all samples. Graphs display total cells per ml. All p values below *0.05 considered statistically significant. c UMAP rendering of rare cells based on morphometric features. Each designated color represents a classification group marked in a. d Heatmap illustrating signal intensity of biomarkers on DAPI + | PanCK+ cells detected in late-stage and early-stage BC groups. e Correlation plot (Pearson correlation) between rare cell categories and LEVs for all samples. Each designated color represents a classification group marked in the figure on panel a.
Fig. 3
Fig. 3. Comparison of Tumor-Associated LEVs.
a Frequency of enumerated LEVs between late-stage, early-stage, and the normal group based on channel classification. b Comparison of the distribution of LEVs between groups, Kruskal-Wallis H test (one-way ANOVA) performed. All p values below *0.05 considered statistically significant. c Size comparison of LEVs and rare cell events. All sizes represent diameters in micron. Sizes calculated by feature conversion from 100x images. d Heatmap displaying signal intensity of biomarkers on LEVs and DAPI + PanCK+ cells. e Scaled frequency plots of rare cells and LEVs in patients, designated colors represent classification groups marked in the figure on panel c.
Fig. 4
Fig. 4. Clinical Data.
a Comparison of summed LEV levels between differing statuses at last follow-up in early-stage BC. Kruskal-Wallis H test (one-way ANOVA) performed. All p values below *0.05 considered statistically significant. b Comparison of summed LEV levels between early-stage patients with clinically identified HER2 + and HER2- tumors. Kruskal-Wallis H test (one-way ANOVA) performed. All p values below *0.05 considered statistically significant. Data illustrated in truncated violin plots.
Fig. 5
Fig. 5. Classification Model.
a On the left, ROC analysis of the random forest model for each target variable class. Curves represent merged prediction from folds. On the right, AUC and F1 score of the corresponding models. b Confusion matrix of the random forest model on the test set. c Ranking of the features for classification based on information gain. Each color represents a channel-classified event group detailed marked in the figure.
Fig. 6
Fig. 6. HDSCA3.0 Workflow Overview.
a–c Blood specimens are collected, processed, and plated onto slides, and undergo immunofluorescent staining. d Slides are scanned, acquired images are segmented, cellular features are extracted using R and EBImage software, dimensionality reduction analysis is applied to the cells. e Data processing pipeline allows for rare cell detection, filtering, and classification, and DAPI- event separation for curation of final report. Created with BioRender.com.

References

    1. Siegel RL, Miller KD, Fuchs HE, Jemal A. Cancer statistics, 2021. CA Cancer J. Clin. 2021;71:7–33. - PubMed
    1. American Cancer Society, Cancer Facts & Figures 2021, Atlanta: American Cancer Society, (2021).
    1. American Cancer Society. Breast Cancer Facts & Figures 2019-2020, Atlanta: American Cancer Society, Inc., (2019).
    1. Amin MB et al. Cancer Staging Manual, AJCC (American Joint Committee on Cancer), 8th edition, 3rd printing, (2018).
    1. Mariotto AB, Etzioni R, Hurlbert M, Penberthy L, Mayer M. Estimation of the Number of Women Living with Metastatic Breast Cancer in the United States. Cancer Epidemiol. Biomark. Prev. 2017;26:809–815. - PMC - PubMed