. 2022 Sep 27;13(1):5671.
doi: 10.1038/s41467-022-33226-8.

Rejuvenation of the aged brain immune cell landscape in mice through p16-positive senescent cell clearance

Affiliations

Rejuvenation of the aged brain immune cell landscape in mice through p16-positive senescent cell clearance

Xu Zhang et al. Nat Commun. .

Abstract

Cellular senescence is a plausible mediator of inflammation-related tissue dysfunction. In the aged brain, senescent cell identities and the mechanisms by which they exert adverse influence are unclear. Here we used high-dimensional molecular profiling, coupled with mechanistic experiments, to study the properties of senescent cells in the aged mouse brain. We show that senescence and inflammatory expression profiles increase with age and are brain region- and sex-specific. p16-positive myeloid cells exhibiting senescent and disease-associated activation signatures, including upregulation of chemoattractant factors, accumulate in the aged mouse brain. Senescent brain myeloid cells promote peripheral immune cell chemotaxis in vitro. Activated resident and infiltrating immune cells increase in the aged brain and are partially restored to youthful levels through p16-positive senescent cell clearance in female p16-InkAttac mice, which is associated with preservation of cognitive function. Our study reveals dynamic remodeling of the brain immune cell landscape in aging and suggests senescent cell targeting as a strategy to counter inflammatory changes and cognitive decline.


Conflict of interest statement

X.Z., T.A.W., E.J.A., J.L.K., T.T., Y.Z., N.K.L., M.J.S., and Mayo Clinic have intellectual property related to this research. This research was reviewed by the Mayo Clinic Conflict of Interest Review Board and was conducted in compliance with Mayo Clinic Conflict of Interest policies. All other authors declare no competing interests.

Figures
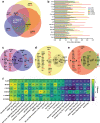
Fig. 1
Fig. 1. Gene expression signatures of senescence and inflammation are differentially regulated in the aged mouse brain across sexes and brain regions.
a NanoString nCounter transcriptional profiling was used to assess age-, sex, and brain region-dependent differences in gene expression for inflammation- and senescence-related genes (n = 5 for young female and male groups, n = 6 for old female and male groups, with the same brains studied per hippocampus [HIP], subventricular zone-enriched striatum [SVZ], and cerebellum [CERE] sample). Black numbers indicate the total number of young versus old differentially expressed genes per region and sex. Red numbers indicate the number of genes that were distinctly expressed as a function of age in a single brain region and sex (linear regression model, false discovery rate (FDR) q < 0.05). b 15 genes were significantly different in young versus old comparisons across all brain regions and both sexes (β-value, indicative of the degree of change in outcome variable for every 1-unit of change in predictor variable; q < 0.05). Comparison of genes significantly up- or down-regulated as a function of age revealed transcripts that were commonly altered across more than one region or sex comparison (black) or distinctly altered in a single age, sex, and region comparison (red) in the c hippocampus, d subventricular zone, or e cerebellum. f Comparative Ingenuity pathway analysis (IPA) analysis of total probed inflammation- and senescence-related genes revealed z-scores for canonical pathways predicted to be up- (yellow) or down- (blue) regulated in the old versus young brain per region and sex. Source data are provided as a Source Data file.
Fig. 2
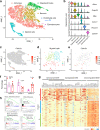
Fig. 2. Single-cell RNA-sequencing reveals an age-related Cdkn2a/p16Ink4a-positive senescent myeloid brain cell population exhibiting a transcriptional profile of altered chemoattractant, MHC, lysosomal, and homeostatic function.
a T-distributed stochastic neighbor embedding (tSNE) plot of cell types identified by scRNA-seq in mouse brain (n = 2 young and n = 4 old samples). b Violin plot of cell type marker expression within the six cell types. c tSNE plot showing Cdkn2a/p16Ink4a expression in the six cell types. Each dot represents an individual cell. The color scale bar represents the Cdkn2a expression level. d tSNE plot of the three clusters of myeloid cells identified by sequential, unbiased subclustering with each cluster indicated by a distinct color. e Scatterplot depicting Cdkn2a expression in subclustered myeloid cells. Each dot represents an individual cell, and the clusters match panel (d). The color scale bar represents the Cdkn2a expression level. f Cell abundance of myeloid cells subclusters between 6- versus 24-month-old females (n = 2 for young, n = 4 for old; mean ± SEM; two-tailed unpaired t-tests). g Heatmap of expression levels of senescence, SASP, and disease-associated (DAM) genes in myeloid subclusters 0, 1, and 2. h Pathways enriched in cluster two identified by GSEA with the normalized enrichment score (NES) and FDR q-values indicated in each panel. Source data are provided as a Source Data file.
Fig. 3
Fig. 3. Senescent brain myeloid cells secrete a SASP that promotes peripheral immune cell recruitment in vitro.
IR exposure to primary mouse brain myeloid cells induced senescence, which was confirmed by a SA-β-gal staining (scale bar: 0.1 mm) and b analysis of SASP proteins in conditioned media (mean ± SEM; two-tailed unpaired t-tests). c Schematic representation of the microfluidic migration chamber. The splenocyte entry chamber is connected via 10-micron grooves to the central imaging field. Conditioned medium from senescent or control brain myeloid cells was added to the indicated side chambers. d Migration index indicating average frame-to-frame migration toward SASP or control media from images collected every three min for 12 h (mean ± SEM; two-tailed one-sample t-test). See Supplementary Fig. 6 for a representative video of splenocyte migration to senescent cell media containing the SASP. (Data were generated from two separate experiments of n = 3.) Source data are provided as a Source Data file.
Fig. 4
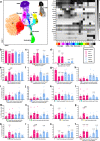
Fig. 4. Mass cytometry demonstrates the increased frequency of activated resident and infiltrating immune cells in the aged brain, which are reduced by systemically targeting p16-positive senescent cells in females.
a Uniform manifold approximation and projection (UMAP) representation of total CD45+ brain cell populations identified by mass cytometry with the colors and numbers corresponding to cell types delineated by FlowSOM-guided clustering, including distinct microglial, border macrophage (BAMs), B cell (B), dendritic cell (DCs), monocyte, neutrophil (N), and T cell populations defined by discrete marker combinations and proximity. bt Frequency distributions of FlowSOM-delineated populations with numbers and color coding corresponding to panel (a) (n = 4; Y-F-V = 6 months, female, vehicle; O-F-V = 24 months, female, vehicle; O-F-AP = 24 months, female, AP20187; Y-M-V = 6 months, male, vehicle; O-M-V = 24 months, male, vehicle; O-M-AP = 24 months, male, AP20187; mean ± SEM; generalized linear mixed model with multiple comparison testing; female and male samples analyzed separately). Source data are provided as a Source Data file.
Fig. 5
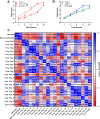
Fig. 5. Cognitive function is preserved by p16-positive senescent cell targeting and associated with the abundance of activated resident microglia and infiltrating brain immune populations in aged females.
a Nest building was assessed as a measure of executive function, using an established quality scale of 0-5 over 24 h among six- (Y) versus 24- (O) month-old a females (F) or b males (M) treated with vehicle (V) or AP20187 (AP) (n = 8 Y-F-V, n = 8 O-F-V, n = 9 O-F-AP, n = 7 Y-M-V, n = 8 O-M-V, n = 7 O-M-AP; mean ± SEM; two-way ANOVA; ***p = 0.000, *p = 0.013, #p = 0.052). c Spearman correlation r-values defining associations between nest score area under the curve (AUC), stone maze learning rate [(trial 1 errors−trail 2 errors)/trial 1 errors], CD45+ brain immune populations defined in Fig. 4, and total CD3+ T cell frequency. Source data are provided as a Source Data file.

References

    1. Mrdjen D, et al. High-dimensional single-cell mapping of central nervous system immune cells reveals distinct myeloid subsets in health, aging, and disease. Immunity. 2018;48:380–395 e386. doi: 10.1016/j.immuni.2018.01.011. - DOI - PubMed
    1. Baruch K, et al. CNS-specific immunity at the choroid plexus shifts toward destructive Th2 inflammation in brain aging. Proc. Natl Acad. Sci. USA. 2013;110:2264–2269. doi: 10.1073/pnas.1211270110. - DOI - PMC - PubMed
    1. Kang SS, et al. Microglial translational profiling reveals a convergent APOE pathway from aging, amyloid, and tau. J. Exp. Med. 2018;215:2235–2245. doi: 10.1084/jem.20180653. - DOI - PMC - PubMed
    1. Dulken BW, et al. Single-cell analysis reveals T cell infiltration in old neurogenic niches. Nature. 2019;571:205–210. doi: 10.1038/s41586-019-1362-5. - DOI - PMC - PubMed
    1. Mathys H, et al. Temporal tracking of microglia activation in neurodegeneration at single-cell resolution. Cell Rep. 2017;21:366–380. doi: 10.1016/j.celrep.2017.09.039. - DOI - PMC - PubMed

Publication types

Substances