

The relationships between growth rate and mitochondrial metabolism varies over time
- PMID: 36167968
- PMCID: PMC9515119
- DOI: 10.1038/s41598-022-20428-9
The relationships between growth rate and mitochondrial metabolism varies over time
Abstract
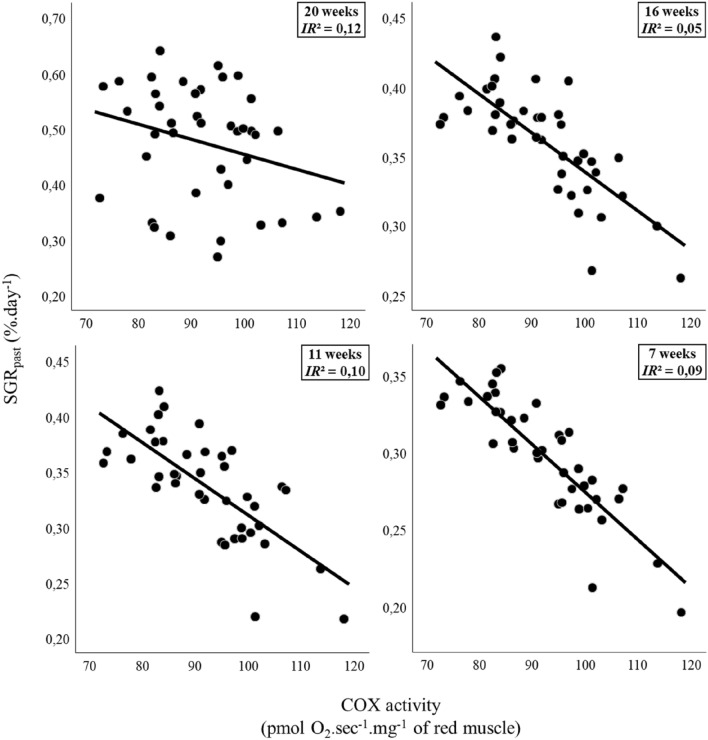
Mitochondrial metabolism varies significantly between individuals of the same species and can influence animal performance, such as growth. However, growth rate is usually determined before the mitochondrial assay. The hypothesis that natural variation in mitochondrial metabolic traits is linked to differences in both previous and upcoming growth remains untested. Using biopsies to collect tissue in a non-lethal manner, we tested this hypothesis in a fish model (Dicentrarchus labrax) by monitoring individual growth rate, measuring mitochondrial metabolic traits in the red muscle, and monitoring the growth of the same individuals after the mitochondrial assay. Individual variation in growth rate was consistent before and after the mitochondrial assay; however, the mitochondrial traits that explained growth variation differed between the growth rates determined before and after the mitochondrial assay. While past growth was correlated with the activity of the cytochrome c oxidase, a measure of mitochondrial density, future growth was linked to mitochondrial proton leak respiration. This is the first report of temporal shift in the relationship between growth rate and mitochondrial metabolic traits, suggesting an among-individual variation in temporal changes in mitochondrial traits. Our results emphasize the need to evaluate whether mitochondrial metabolic traits of individuals can change over time.
© 2022. The Author(s).
Conflict of interest statement
The authors declare no competing interests.
Figures


Similar articles
-
Variation in Metabolic Rate among Individuals Is Related to Tissue-Specific Differences in Mitochondrial Leak Respiration.Physiol Biochem Zool. 2016 Nov/Dec;89(6):511-523. doi: 10.1086/688769. Epub 2016 Sep 27. Physiol Biochem Zool. 2016. PMID: 27792536
-
Mitochondrial proton leak rates in the slow, oxidative myotomal muscle and liver of the endothermic shortfin mako shark (Isurus oxyrinchus) and the ectothermic blue shark (Prionace glauca) and leopard shark (Triakis semifasciata).J Exp Biol. 2006 Jul;209(Pt 14):2678-85. doi: 10.1242/jeb.02317. J Exp Biol. 2006. PMID: 16809458
-
Mitochondrial oxygen affinity predicts basal metabolic rate in humans.FASEB J. 2011 Aug;25(8):2843-52. doi: 10.1096/fj.11-182139. Epub 2011 May 16. FASEB J. 2011. PMID: 21576503
-
The causes and functions of mitochondrial proton leak.Biochim Biophys Acta. 1994 Aug 30;1187(2):132-9. doi: 10.1016/0005-2728(94)90099-x. Biochim Biophys Acta. 1994. PMID: 8075107 Review.
-
Characteristics and nature of redox-linked proton transfer reactions in cytochrome c oxidase of mitochondria.J Inorg Biochem. 1985 Mar-Apr;23(3-4):317-25. doi: 10.1016/0162-0134(85)85041-8. J Inorg Biochem. 1985. PMID: 2410563 Review.
Cited by
-
Genetic markers and tree properties predicting wood biorefining potential in aspen (Populus tremula) bioenergy feedstock.Biotechnol Biofuels Bioprod. 2023 Apr 10;16(1):65. doi: 10.1186/s13068-023-02315-1. Biotechnol Biofuels Bioprod. 2023. PMID: 37038157 Free PMC article.
-
Non-lethal sampling method for the analysis of white muscle fatty acid profiles in European sea bass (Dicentrarchus labrax).Fish Physiol Biochem. 2023 Dec;49(6):1381-1390. doi: 10.1007/s10695-023-01262-w. Epub 2023 Nov 10. Fish Physiol Biochem. 2023. PMID: 37948014
-
Joint impact on thermotolerance of Saccharomyces species divergence in mitochondrial and nuclear genomes.bioRxiv [Preprint]. 2025 May 13:2025.05.07.652752. doi: 10.1101/2025.05.07.652752. bioRxiv. 2025. PMID: 40463194 Free PMC article. Preprint.
-
ATP and appetite: mitochondrial efficiency predicts meal size and the time until next feeding in common minnows.R Soc Open Sci. 2025 Jul 9;12(7):250557. doi: 10.1098/rsos.250557. eCollection 2025 Jul. R Soc Open Sci. 2025. PMID: 40740712 Free PMC article.
-
Non-lethal sampling for assessment of mitochondrial function does not affect metabolic rate and swimming performance.Philos Trans R Soc Lond B Biol Sci. 2024 Feb 26;379(1896):20220483. doi: 10.1098/rstb.2022.0483. Epub 2024 Jan 8. Philos Trans R Soc Lond B Biol Sci. 2024. PMID: 38186271 Free PMC article.
References
-
- Armstrong DP, Keevil MG, Rollinson N, Brooks RJ. Subtle individual variation in indeterminate growth leads to major variation in survival and lifetime reproductive output in a long-lived reptile. Funct. Ecol. 2018;32:752–761. doi: 10.1111/1365-2435.13014. - DOI
-
- Nicholls, D. G. & Ferguson, S. J. in Bioenergetics (Third Edition) (eds David G. Nicholls & Stuart J. Ferguson) 249–270 (Academic Press, 2003).
Publication types
MeSH terms
Substances
LinkOut - more resources
Full Text Sources
Miscellaneous
