

Bayesian negative binomial regression with spatially varying dispersion: Modeling COVID-19 incidence in Georgia
- PMID: 36168515
- PMCID: PMC9500097
- DOI: 10.1016/j.spasta.2022.100703
Bayesian negative binomial regression with spatially varying dispersion: Modeling COVID-19 incidence in Georgia
Abstract
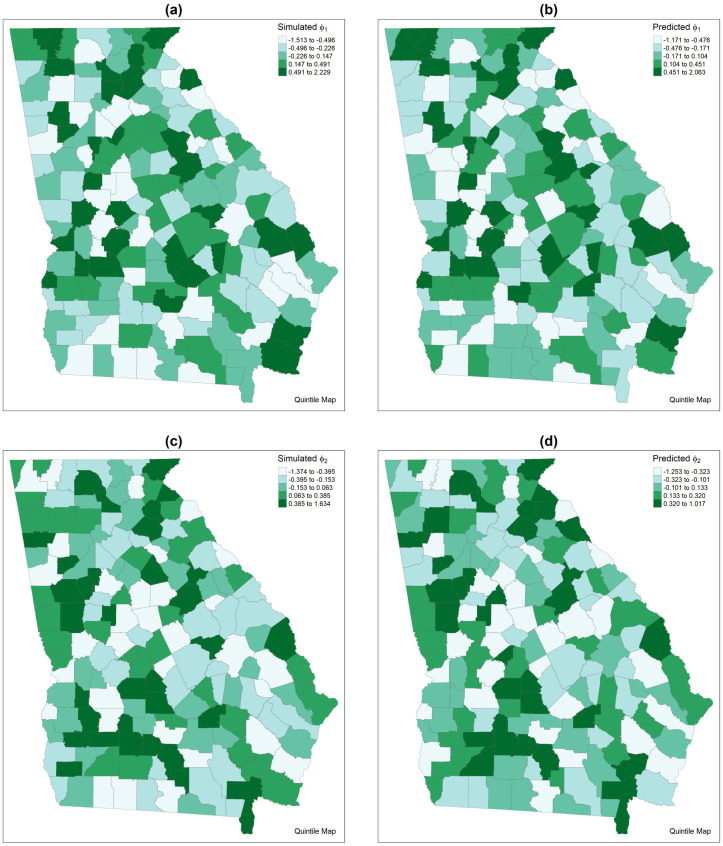
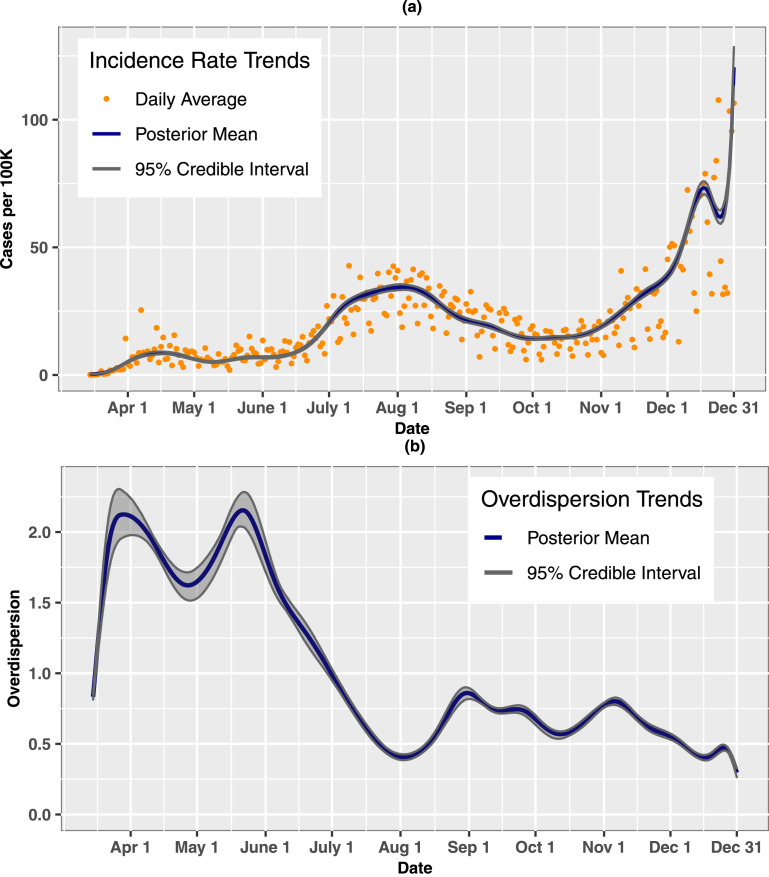
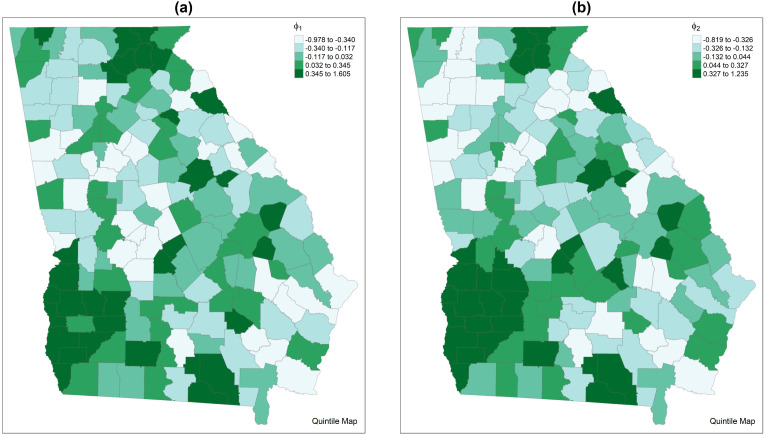
Overdispersed count data arise commonly in disease mapping and infectious disease studies. Typically, the level of overdispersion is assumed to be constant over time and space. In some applications, however, this assumption is violated, and in such cases, it is necessary to model the dispersion as a function of time and space in order to obtain valid inferences. Motivated by a study examining spatiotemporal patterns in COVID-19 incidence, we develop a Bayesian negative binomial model that accounts for heterogeneity in both the incidence rate and degree of overdispersion. To fully capture the heterogeneity in the data, we introduce region-level covariates, smooth temporal effects, and spatially correlated random effects in both the mean and dispersion components of the model. The random effects are assigned bivariate intrinsic conditionally autoregressive priors that promote spatial smoothing and permit the model components to borrow information, which is appealing when the mean and dispersion are spatially correlated. Through simulation studies, we show that ignoring heterogeneity in the dispersion can lead to biased and imprecise estimates. For estimation, we adopt a Bayesian approach that combines full-conditional Gibbs sampling and Metropolis-Hastings steps. We apply the model to a study of COVID-19 incidence in the state of Georgia, USA from March 15 to December 31, 2020.
Keywords:
© 2022 Elsevier B.V. All rights reserved.
Conflict of interest statement
The authors declare that they have no known competing financial interests or personal relationships that could have appeared to influence the work reported in this paper.
Figures


References
-
- Banerjee S., Carlin B., Gelfand A. second ed. CRC Press, Taylor and Francis Group; Boca Raton, FL: 2014. Hierarchical Modeling and Analysis for Spatial Data.
-
- Best N.G., Ickstadt K., Wolpert R.L. Spatial Poisson regression for health and exposure data measured at disparate resolutions. J. Amer. Statist. Assoc. 2000;95(452):1076–1088. doi: 10.1080/01621459.2000.10474304. - DOI
-
- Centers for Disease Control and Prevention N.G. 2018. Social vulnerability index 2018 database US. URL https://www.atsdr.cdc.gov/placeandhealth/svi/data_documentation_download....
-
- Consul P. Marcel Dekker; New York, Basel: 1989. Generalized Poisson Distributions: Properties and Applications.
-
- Eilers P.H.C., Marx B. Flexible smoothing with B-splines and penalties. Statist. Sci. 1996;11(2) doi: 10.1214/ss/1038425655. - DOI
Publication types
Grants and funding
LinkOut - more resources
Full Text Sources