

Study on Risk Factors of Primary Non-traumatic OVCF in Chinese Elderly and a Novel Prediction Model
- PMID: 36168985
- PMCID: PMC9627056
- DOI: 10.1111/os.13531
Study on Risk Factors of Primary Non-traumatic OVCF in Chinese Elderly and a Novel Prediction Model
Abstract
Objective: Prevention of fragility fractures is one of the public health priorities worldwide, whilst the incidence of osteoporotic vertebral compression fractures (OVCF) continues to rise and lacks the corresponding accurate prediction model. This study aimed to screen potential causes and risk factors for primary non-traumatic osteoporotic vertebral compression fractures (NTOVCF) in the elderly by characterizing a patient population with NTOVCF and comparing it with a population of osteoporotic patients.
Methods: Between January 2013 and January 2022, 208 elderly patients with unequivocal evidence of bone fragility manifested as painful NTOVCF were enrolled, and compared with 220 patients with osteoporosis and no fractures. The demographic data, bone turnover markers, blood routine, serum biochemical values, and radiological findings were investigated. Differences between the fracture and non-fracture groups were analyzed, and variables significant in univariate analysis and correlation analysis were included in the logistic analysis to build the risk prediction model for osteoporotic vertebral fractures. Univariate analysis using student's t-tests for continuous variables or a chi-squared test for categorical variables was conducted to identify risk factors.
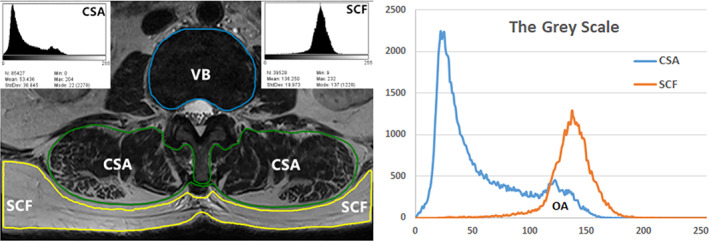
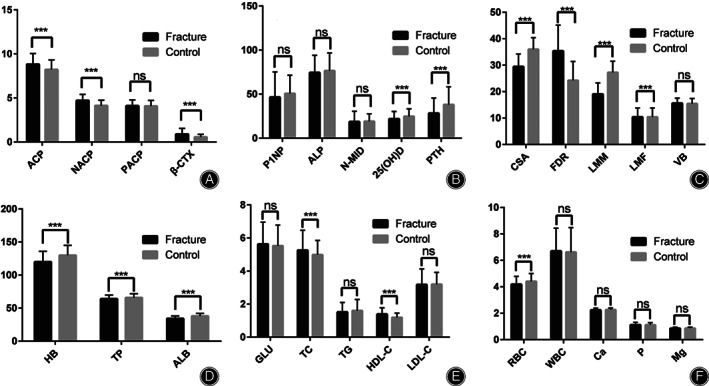
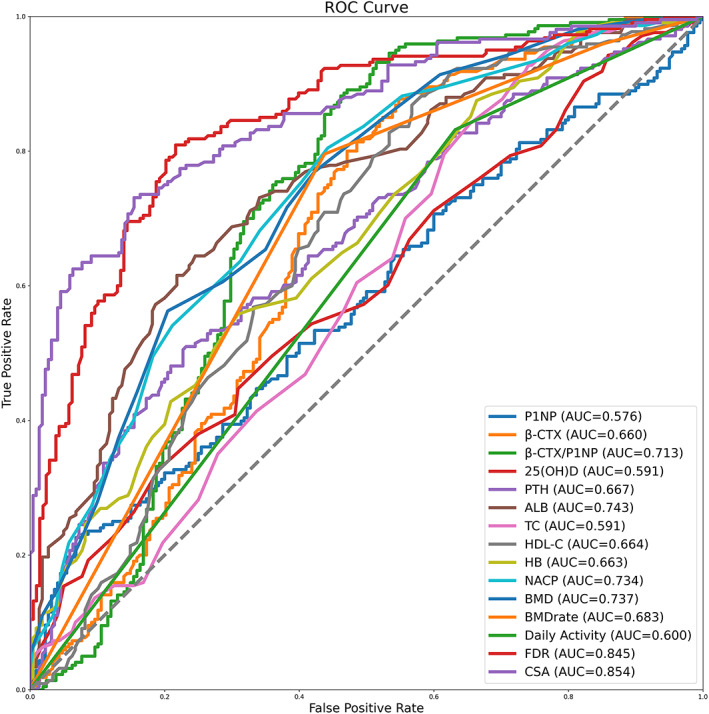
Results: No significant differences were revealed regarding age, gender, BMI, smoking, alcohol consumption, blood glucose, propeptide of type I procollagen (P1NP), and N-terminal middle segment osteocalcin (N-MID) (P > 0.05). Parathyroid Hormone (PTH), 25(OH)D, serum albumin (ALB), hemoglobin (HB), bone mineral density (BMD), and cross-sectional area (CSA) of the paraspinal muscle in the fracture group were significantly lower than those in the control group; however, b-C-terminal telopeptide of type I collagen (β-CTX), total cholesterol (TC), high-density lipoprotein cholesterol (HDL-C), non-prostatic acid phosphatase (NACP), and fatty degeneration ratio (FDR) were significantly higher than those in the control group (P < 0.05). Logistic regression analysis showed that ALB, HB, CSA, and BMD were negatively correlated with NTOVCF, while β-CTX, HDL-C, NACP, and FDR were positively correlated with NTOVCF.
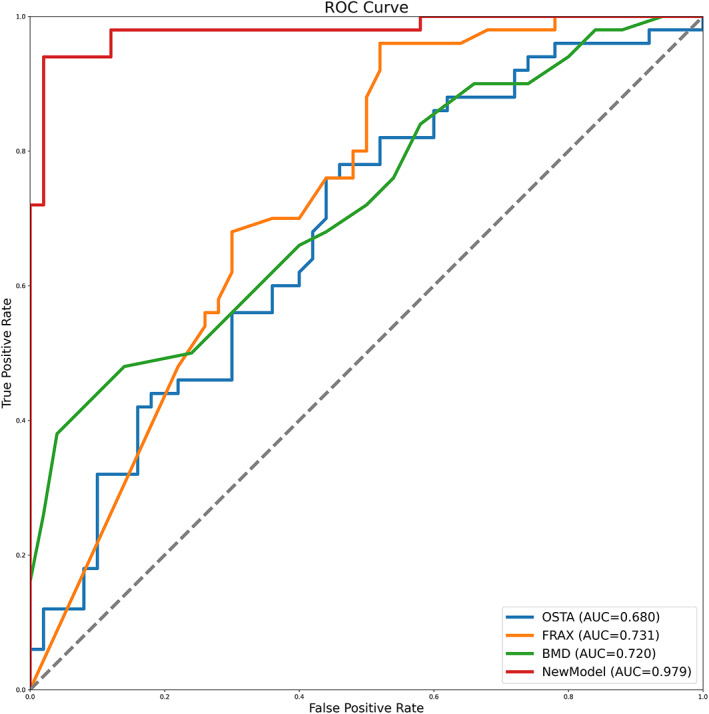
Conclusion: Decreased physical activity, anemia, hypoproteinemia, imbalances in bone metabolism, abnormal lipid metabolism, and degenerative and decreased muscle mass, were all risk factors for OVCF in the elderly, spontaneous fractures may be the consequence of cumulative declines in multiple physiological systems over the lifespan. Based on this risk model, timely detection of patients with high OVCF risk and implementation of targeted preventive measures is expected to improve the effect of fracture prevention.
Keywords: Elderly population; Osteoporosis; Osteoporotic vertebral compression fracture; Risk prediction model.
© 2022 The Authors. Orthopaedic Surgery published by Tianjin Hospital and John Wiley & Sons Australia, Ltd.
Figures
References
-
- Kendler DL, Bauer DC, et al. Vertebral fractures: clinical importance and management. Am J Med. 2016;129(2):221–10. - PubMed
-
- Gambacciani M, Levancini M. Management of postmenopausal osteoporosis and the prevention of fractures. Panminerva Med. 2014;56(2):115–31. - PubMed
-
- Miller PD. Management of severe osteoporosis. Expert Opin Pharmacother. 2016;17(4):473–88. - PubMed
-
- Kerschan‐Schindl K. Prevention and rehabilitation of osteoporosis. Wiener Medizinische Wochenschrift (1946). 2016;166(1–2):22–7. - PubMed
MeSH terms
Substances
Grants and funding
LinkOut - more resources
Full Text Sources
Medical
Miscellaneous
