A Single Nucleotide Polymorphism in SH2B3/LNK Promotes Hypertension Development and Renal Damage
- PMID: 36169218
- PMCID: PMC9588739
- DOI: 10.1161/CIRCRESAHA.121.320625
A Single Nucleotide Polymorphism in SH2B3/LNK Promotes Hypertension Development and Renal Damage
Erratum in
-
Correction to: A Single Nucleotide Polymorphism in SH2B3/LNK Promotes Hypertension Development and Renal Damage.Circ Res. 2023 Mar 3;132(5):e95. doi: 10.1161/RES.0000000000000599. Epub 2023 Mar 2. Circ Res. 2023. PMID: 36862815 No abstract available.
Abstract
Background: SH2B3 (SH2B adaptor protein 3) is an adaptor protein that negatively regulates cytokine signaling and cell proliferation. A common missense single nucleotide polymorphism in SH2B3 (rs3184504) results in substitution of tryptophan (Trp) for arginine (Arg) at amino acid 262 and is a top association signal for hypertension in human genome-wide association studies. Whether this variant is causal for hypertension, and if so, the mechanism by which it impacts pathogenesis is unknown.
Methods: We used CRISPR-Cas9 technology to create mice homozygous for the major (Arg/Arg) and minor (Trp/Trp) alleles of this SH2B3 polymorphism. Mice underwent angiotensin II (Ang II) infusion to evaluate differences in blood pressure (BP) elevation and end-organ damage including albuminuria and renal fibrosis. Cytokine production and Stat4 phosphorylation was also assessed in Arg/Arg and Trp/Trp T cells.
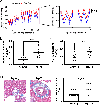
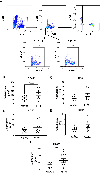
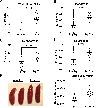
Results: Trp/Trp mice exhibit 10 mmHg higher systolic BP during chronic Ang II infusion compared to Arg/Arg controls. Renal injury and perivascular fibrosis are exacerbated in Trp/Trp mice compared to Arg/Arg controls following Ang II infusion. Renal and ex vivo stimulated splenic CD8+ T cells from Ang II-infused Trp/Trp mice produce significantly more interferon gamma (IFNg) compared to Arg/Arg controls. Interleukin-12 (IL-12)-induced IFNg production is greater in Trp/Trp compared to Arg/Arg CD8+ T cells. In addition, IL-12 enhances Stat4 phosphorylation to a greater degree in Trp/Trp compared to Arg/Arg CD8+ T cells, suggesting that Trp-encoding SH2B3 exhibits less negative regulation of IL-12 signaling to promote IFNg production. Finally, we demonstrated that a multi-SNP model genetically predicting increased SH2B3 expression in lymphocytes is inversely associated with hypertension and hypertensive chronic kidney disease in humans..
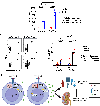
Conclusions: Taken together, these results suggest that the Trp encoding allele of rs3184504 is causal for BP elevation and renal dysfunction, in part through loss of SH2B3-mediated repression of T cell IL-12 signaling leading to enhanced IFNg production.
Keywords: cytokines; hypertension; inflammation; lymphocytes; polymorphism, single nucleotide.
Figures


References
-
- Lim SS, Vos T, Flaxman AD, Danaei G, Shibuya K, Adair-Rohani H, Amann M, Anderson HR, Andrews KG, Aryee M, et al. A comparative risk assessment of burden of disease and injury attributable to 67 risk factors and risk factor clusters in 21 regions, 1990–2010: a systematic analysis for the Global Burden of Disease Study 2010. Lancet. 2012;380:2224–2260. - PMC - PubMed
-
- Blacher J, Evans A, Arveiler D, Amouyel P, Ferrieres J, Bingham A, Yarnell J, Haas B, Montaye M, Ruidavets JB, et al. Residual cardiovascular risk in treated hypertension and hyperlipidaemia: the PRIME Study. Journal of human hypertension. 2010;24:19–26. - PubMed
-
- Nwanko T YS, Burt V, Gu Q. Hypertension among adults in the united states: National health and nutrition examination survey, 2011–2012. NCHS Data Brief. 2013;Oct:1–8. - PubMed
-
- Whelton PK, Carey RM, Aronow WS, Casey DE Jr., Collins KJ, Dennison Himmelfarb C, DePalma SM, Gidding S, Jamerson KA, Jones DW, et al. 2017 ACC/AHA/AAPA/ABC/ACPM/AGS/APhA/ASH/ASPC/NMA/PCNA Guideline for the Prevention, Detection, Evaluation, and Management of High Blood Pressure in Adults: Executive Summary: A Report of the American College of Cardiology/American Heart Association Task Force on Clinical Practice Guidelines. Circulation. 2018;138:e426–e483. - PubMed
Publication types
MeSH terms
Substances
Grants and funding
- S10 OD023475/OD/NIH HHS/United States
- U19 HL065962/HL/NHLBI NIH HHS/United States
- K08 HL153786/HL/NHLBI NIH HHS/United States
- S10 RR025141/RR/NCRR NIH HHS/United States
- P50 GM115305/GM/NIGMS NIH HHS/United States
- P30 CA068485/CA/NCI NIH HHS/United States
- U01 HG009086/HG/NHGRI NIH HHS/United States
- U24 DK059637/DK/NIDDK NIH HHS/United States
- F32 HL144048/HL/NHLBI NIH HHS/United States
- S10 OD017985/OD/NIH HHS/United States
- F30 HL151069/HL/NHLBI NIH HHS/United States
- UL1 TR000445/TR/NCATS NIH HHS/United States
- R01 HD074711/HD/NICHD NIH HHS/United States
- DP2 HL137166/HL/NHLBI NIH HHS/United States
- T32 GM007347/GM/NIGMS NIH HHS/United States
- T32 HL007411/HL/NHLBI NIH HHS/United States
- P30 DK020593/DK/NIDDK NIH HHS/United States
- RC2 GM092618/GM/NIGMS NIH HHS/United States
- T32 GM152284/GM/NIGMS NIH HHS/United States
- U01 HG006378/HG/NHGRI NIH HHS/United States
- UL1 RR024975/RR/NCRR NIH HHS/United States
- R01 NS032830/NS/NINDS NIH HHS/United States
- U01 HG004798/HG/NHGRI NIH HHS/United States
- R01 HL161212/HL/NHLBI NIH HHS/United States
- UL1 TR002243/TR/NCATS NIH HHS/United States
LinkOut - more resources
Full Text Sources
Medical
Molecular Biology Databases
Research Materials
Miscellaneous

