

Network autonomic analysis of post-acute sequelae of COVID-19 and postural tachycardia syndrome
- PMID: 36169757
- PMCID: PMC9517969
- DOI: 10.1007/s10072-022-06423-y
Network autonomic analysis of post-acute sequelae of COVID-19 and postural tachycardia syndrome
Abstract
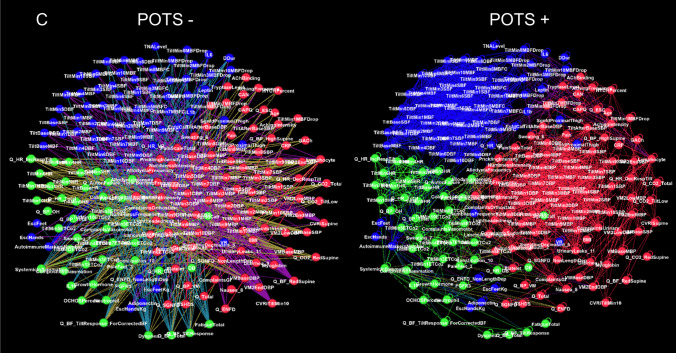
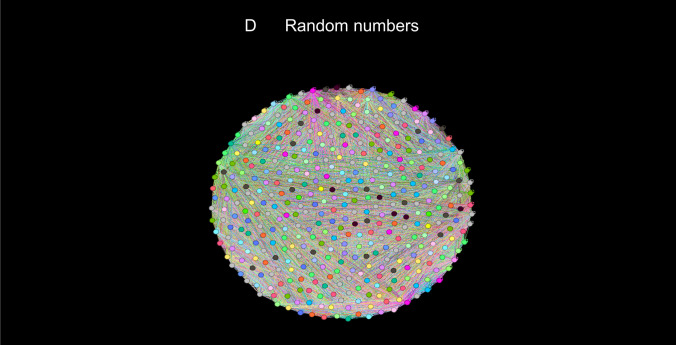
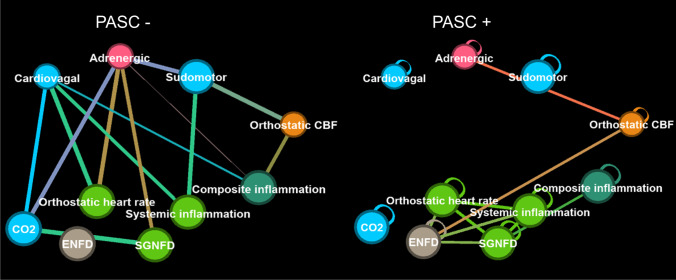
Background: The autonomic nervous system (ANS) is a complex network where sympathetic and parasympathetic domains interact inside and outside of the network. Correlation-based network analysis (NA) is a novel approach enabling the quantification of these interactions. The aim of this study is to assess the applicability of NA to assess relationships between autonomic, sensory, respiratory, cerebrovascular, and inflammatory markers on post-acute sequela of COVID-19 (PASC) and postural tachycardia syndrome (POTS).
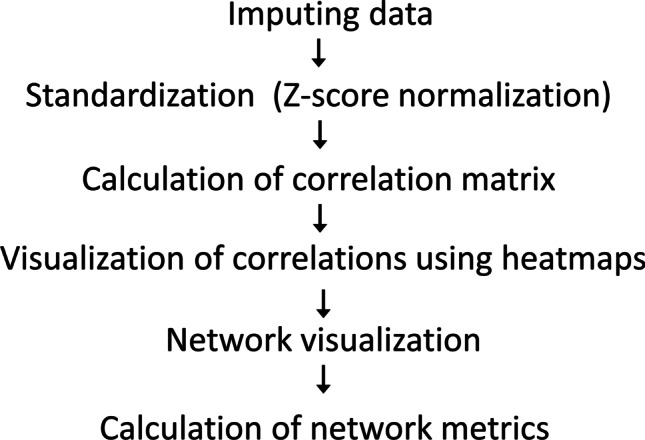
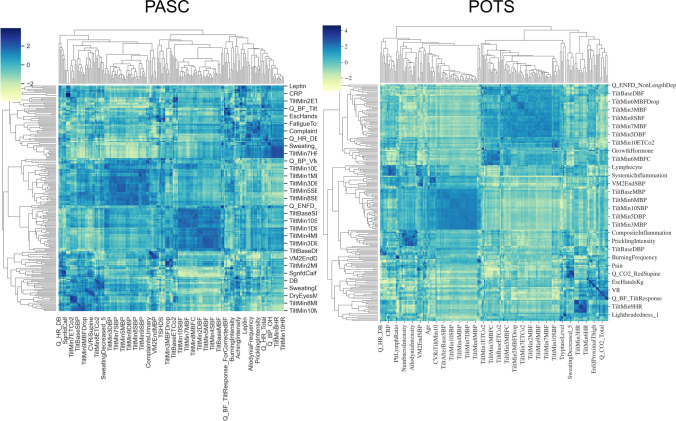
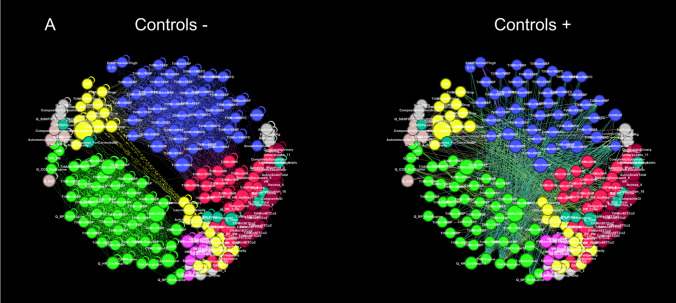
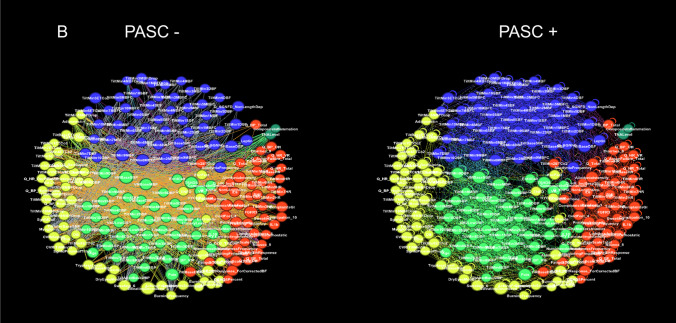
Methods: In this retrospective study, datasets from PASC (n = 15), POTS (n = 15), and matched controls (n = 11) were analyzed. Networks were constructed from surveys (autonomic and sensory), autonomic tests (deep breathing, Valsalva maneuver, tilt, and sudomotor test) results using heart rate, blood pressure, cerebral blood flow velocity (CBFv), capnography, skin biopsies for assessment of small fiber neuropathy (SFN), and various inflammatory markers. Networks were characterized by clusters and centrality metrics.
Results: Standard analysis showed widespread abnormalities including reduced orthostatic CBFv in 100%/88% (PASC/POTS), SFN 77%/88%, mild-to-moderate dysautonomia 100%/100%, hypocapnia 87%/100%, and elevated inflammatory markers. NA showed different signatures for both disorders with centrality metrics of vascular and inflammatory variables playing prominent roles in differentiating PASC from POTS.
Conclusions: NA is suitable for a relationship analysis between autonomic and nonautonomic components. Our preliminary analyses indicate that NA can expand the value of autonomic testing and provide new insight into the functioning of the ANS and related systems in complex disease processes such as PASC and POTS.
Keywords: Autonomic testing; Long COVID; Network analysis; PASC; POTS; Skin biopsy.
© 2022. Fondazione Società Italiana di Neurologia.
Conflict of interest statement
None.
Figures
References
-
- Novak P (2019) Autonomic Testing, Oxford University Press
-
- Calder PC, Bosco N, Bourdet-Sicard R, Capuron L, Delzenne N, Doré J, Franceschi C, Lehtinen MJ, Recker T, Salvioli S, Visioli F. Health relevance of the modification of low grade inflammation in ageing (inflammageing) and the role of nutrition. Ageing Res Rev. 2017;40:95–119. doi: 10.1016/j.arr.2017.09.001. - DOI - PubMed
MeSH terms
LinkOut - more resources
Full Text Sources
Medical
Research Materials
Miscellaneous
