

Geographic disparities and determinants of COVID-19 incidence risk in the greater St. Louis Area, Missouri (United States)
- PMID: 36170339
- PMCID: PMC9518888
- DOI: 10.1371/journal.pone.0274899
Geographic disparities and determinants of COVID-19 incidence risk in the greater St. Louis Area, Missouri (United States)
Abstract
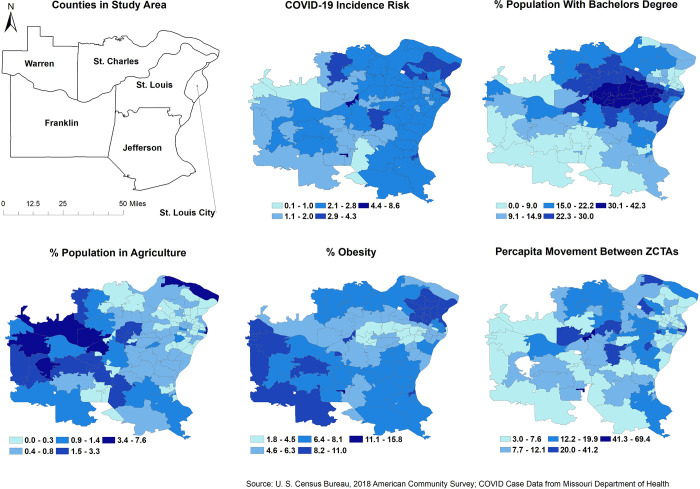
Background: Evidence seems to suggest that the risk of Coronavirus Disease 2019 (COVID-19) might vary across communities due to differences in population characteristics and movement patterns. However, little is known about these differences in the greater St Louis Area of Missouri and yet this information is useful for targeting control efforts. Therefore, the objectives of this study were to investigate (a) geographic disparities of COVID-19 risk and (b) associations between COVID-19 risk and socioeconomic, demographic, movement and chronic disease factors in the Greater St. Louis Area of Missouri, USA.
Methods: Data on COVID-19 incidence and chronic disease hospitalizations were obtained from the Department of Health and Missouri Hospital Association, respectively. Socioeconomic and demographic data were obtained from the 2018 American Community Survey while population mobility data were obtained from the SafeGraph website. Choropleth maps were used to identify geographic disparities of COVID-19 risk and several sociodemographic and chronic disease factors at the ZIP Code Tabulation Area (ZCTA) spatial scale. Global negative binomial and local geographically weighted negative binomial models were used to investigate associations between ZCTA-level COVID-19 risk and socioeconomic, demographic and chronic disease factors.
Results: There were geographic disparities found in COVID-19 risk. Risks tended to be higher in ZCTAs with high percentages of the population with a bachelor's degree (p<0.0001) and obesity hospitalizations (p<0.0001). Conversely, risks tended to be lower in ZCTAs with high percentages of the population working in agriculture (p<0.0001). However, the association between agricultural occupation and COVID-19 risk was modified by per capita between ZCTA visits. Areas that had both high per capita between ZCTA visits and high percentages of the population employed in agriculture had high COVID-19 risks. The strength of association between agricultural occupation and COVID-19 risk varied by geographic location.
Conclusions: Geographic disparities of COVID-19 risk exist in the St. Louis area and are associated with sociodemographic factors, population movements, and obesity hospitalization risks. The latter is particularly concerning due to the growing prevalence of obesity and the known immunological impairments among obese individuals. Therefore, future studies need to focus on improving our understanding of the relationships between COVID-19 vaccination efficacy, obesity and waning of immunity among obese individuals so as to better guide vaccination regimens and reduce disparities.
Conflict of interest statement
The authors have declared that no competing interests exist.
Figures

References
-
- Johns Hopkins Coronavirus Resource Center. COVID-19 Dashboard by the Center for Systems Science and Engineering (CSSE) at Johns Hopkins University (JHU). In: COVID-19 Dashboard, [Internet]. 2021. [cited 30 Nov 2021]. Available: https://coronavirus.jhu.edu/map.html
-
- Centers for Disease Control and Prevention (CDC). COVID Data Tracker. In: Data Tracker, [Internet]. 2021. [cited 27 Nov 2021]. Available: https://covid.cdc.gov/covid-data-tracker/#datatracker-home
-
- Centers for Disease Control and Prevention (CDC). COVID Data Tracker Weekly Review. In: Science and Research, [Internet]. 2021. [cited 27 Nov 2021]. Available: https://www.cdc.gov/coronavirus/2019-ncov/covid-data/covidview/index.html
Publication types
MeSH terms
Substances
Grants and funding
LinkOut - more resources
Full Text Sources
Medical
