. 2022 Sep 30;8(39):eabq3917.
doi: 10.1126/sciadv.abq3917. Epub 2022 Sep 28.

Injection continuous liquid interface production of 3D objects

Affiliations

Injection continuous liquid interface production of 3D objects

Gabriel Lipkowitz et al. Sci Adv. .

Abstract

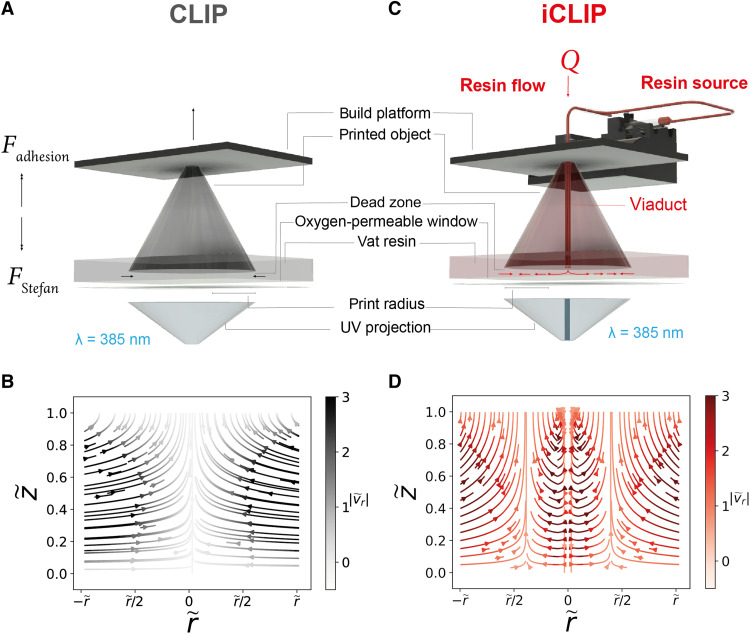
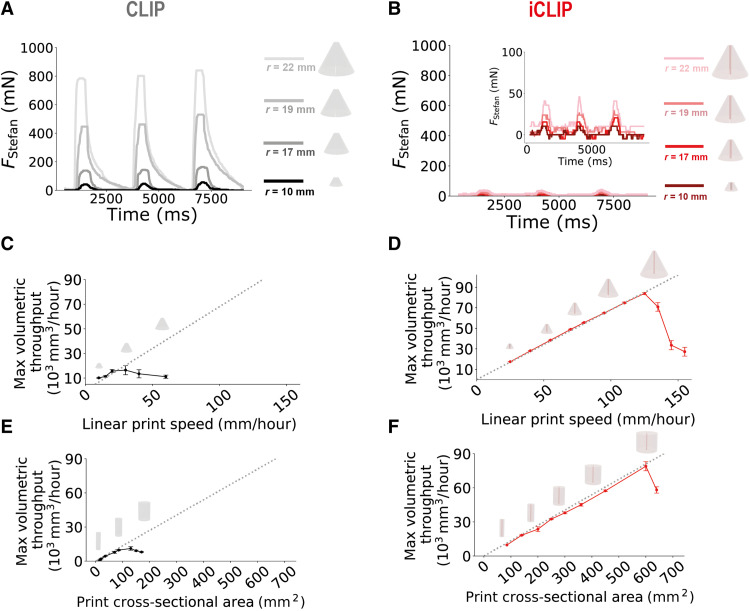
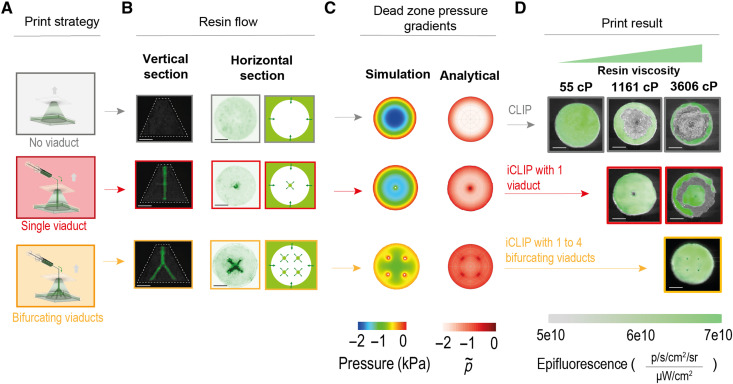
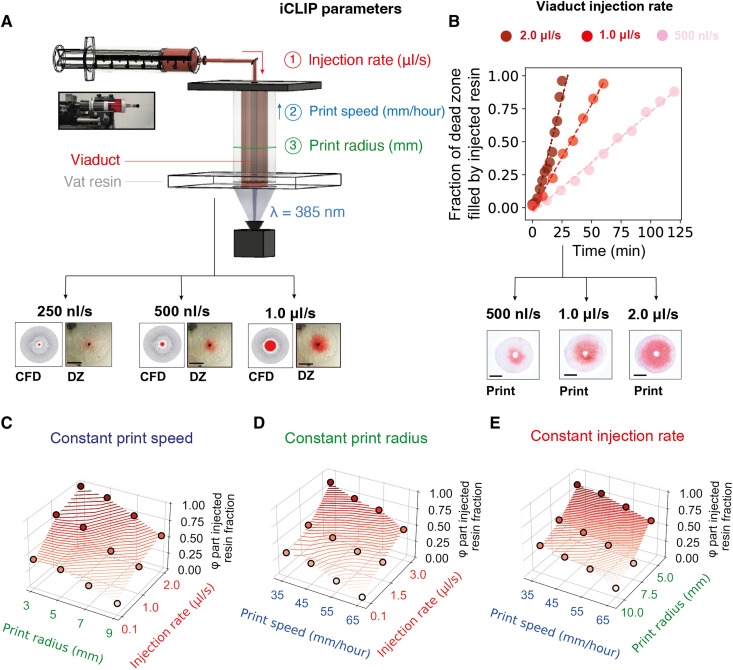
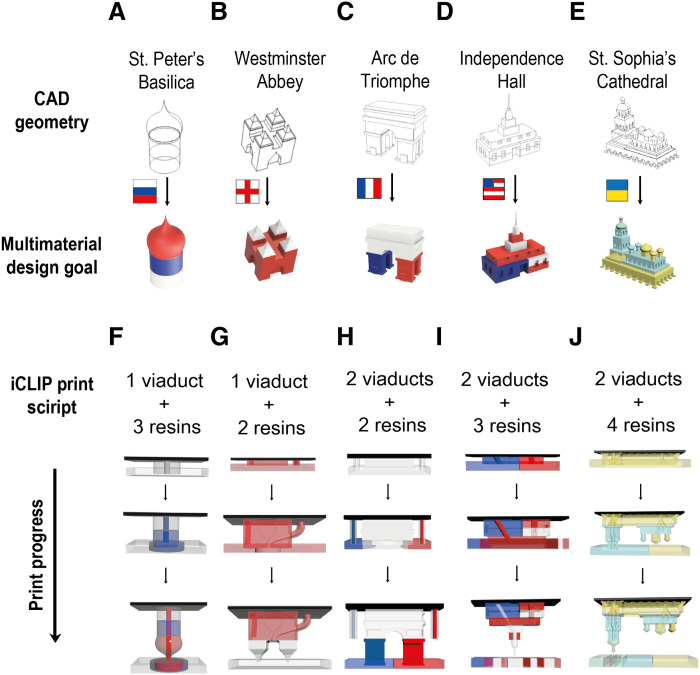
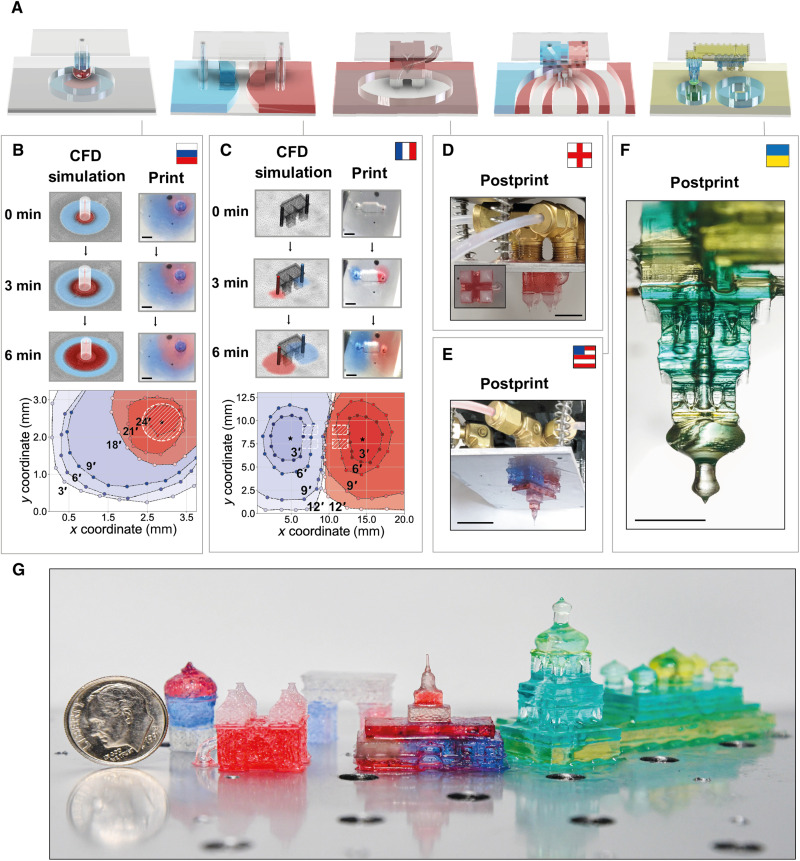
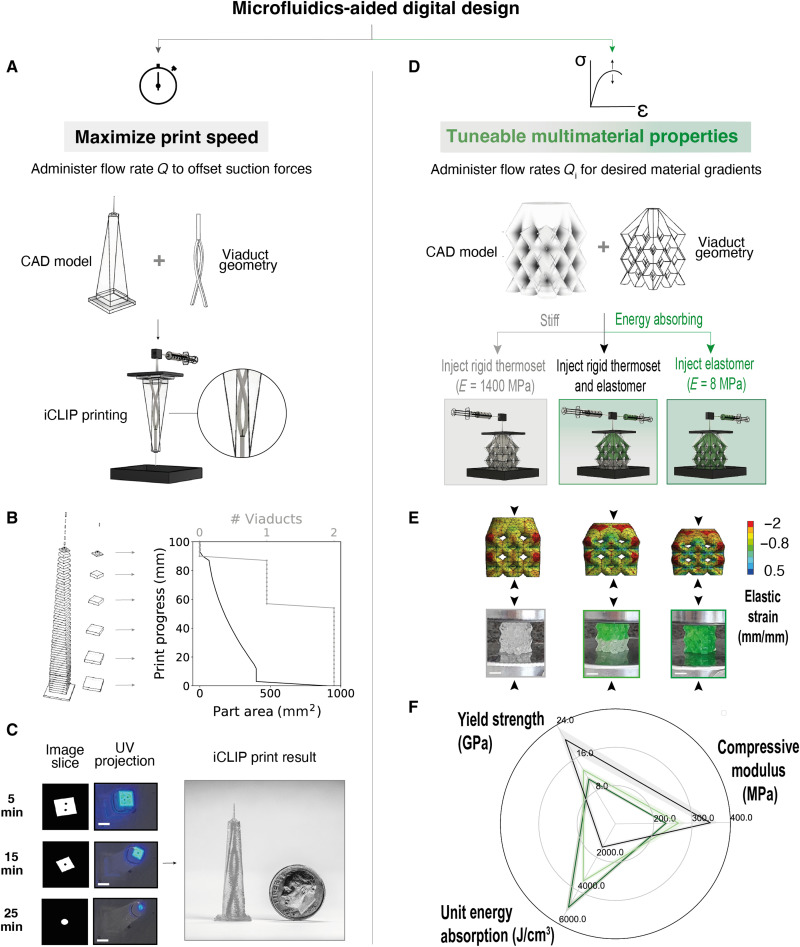
In additive manufacturing, it is imperative to increase print speeds, use higher-viscosity resins, and print with multiple different resins simultaneously. To this end, we introduce a previously unexplored ultraviolet-based photopolymerization three-dimensional printing process. The method exploits a continuous liquid interface-the dead zone-mechanically fed with resin at elevated pressures through microfluidic channels dynamically created and integral to the growing part. Through this mass transport control, injection continuous liquid interface production, or iCLIP, can accelerate printing speeds to 5- to 10-fold over current methods such as CLIP, can use resins an order of magnitude more viscous than CLIP, and can readily pattern a single heterogeneous object with different resins in all Cartesian coordinates. We characterize the process parameters governing iCLIP and demonstrate use cases for rapidly printing carbon nanotube-filled composites, multimaterial features with length scales spanning several orders of magnitude, and lattices with tunable moduli and energy absorption.


Figures

Fig. 1.
Fig. 1.. Injection continuous liquid interface production.
(A) Traditional CLIP process, with force diagram for the printed object and resin flows indicated. (B) Analytically derived dead zone velocity fields and pressure gradients from the lubrication theory while printing a cylindrical geometry by CLIP, where z~ and r~ are the vertical and radial distances in the dead zone, respectively, and vr~ is the radial velocity. Darker hues indicate higher-magnitude velocity vectors, and, conversely, lighter hues indicate stagnation zones of low-fluid velocity. (C) iCLIP process indicating the flow of the injected resin from a pressurized source through microfluidic ducts engineered within the growing part into the dead zone. (D) Analytically derived dead zone velocity fields and pressure gradients from the lubrication theory while printing a cylindrical geometry by CLIP, with continuous injection through a central viaduct.
Fig. 2.
Fig. 2.. iCLIP accelerates printing of 3D geometries by alleviating suction forces.
(A and B) Experimental load cell force data measured for three consecutive layers, each of 3-s duration, while printing a conical geometry with varying cross-sectional areas by CLIP and iCLIP. (C to F) Quantified maximum print volumetric throughputs for two test geometries with varying cross-sectional areas, cone (C and D) and cylinder (E and F), by CLIP (left) and iCLIP (right). Gray dotted lines indicate delamination-free prints. Error bars denote ±1 SD from three independent print trials.
Fig. 3.
Fig. 3.. Rapid printing with high-viscosity resins by iCLIP.
(A) Strategies for printing a cone geometry by CLIP (gray), iCLIP with one viaduct (red), and iCLIP with one-to-four bifurcating viaducts (orange), highlighting resin channels and simulated dead zone pressure gradients. (B) Images of iCLIP printed objects with viaducts facilitating resin flow highlighted. (C) Pressure gradients within the dead zone predicted by CFD simulation (left) and lubrication theory (right). (D) Bottom-up images of CLIP and iCLIP print outcomes with resins of varying viscosities; gray regions indicate cavitation events.
Fig. 4.
Fig. 4.. Multimaterial iCLIP control strategy.
(A) Test geometry for calibrating injection rates during iCLIP, with control parameters that can be tuned during an iCLIP print to adjust the fraction of the vat to injected resin in a part. Below are images of the dead zone during prints with varying injection rates, with corresponding CFD simulation predictions. (B) Correlation between administered injection rate and the fraction of the part formed by injected resin, for three different injection profiles. (C to E) Parameter sweep experiments adjusting one of three control parameters during iCLIP to calibrate material fractions of vat to injected resin in a part. Scale bars, 1 cm. DZ, dead zone.
Fig. 5.
Fig. 5.. Print scripts for multimaterial iCLIP.
(A to E) Five illustrative multimaterial iCLIP design objectives modeled as historically important buildings (35) on which the flag of the country of origin is imprinted in order of increasing complexity. (F to J) Corresponding iCLIP print strategies highlighting evolving duct geometries over the course of the print. Ducts are engineered internal and/or external to the part to achieve the desired gradients.
Fig. 6.
Fig. 6.. Experimental validation of multimaterial iCLIP print strategies.
(A) Vat resin distribution goals for multimaterial iCLIP printing flow control strategies. (B and C) For the St. Basil’s Cathedral and Arc de Triomphe prints, respectively, CFD simulations of flow boundaries induced by injection (left) and images of the resin vat from beneath the window (right), with corresponding digitally extracted flow boundaries at varying time points following the onset of injection (bottom). (D to F) Multimaterial gradients in Westminster Abbey, Independence Hall, and St. Sophia’s Cathedral prints, and (G) all tested models following iCLIP printing. Scale bars, 1 cm.
Fig. 7.
Fig. 7.. Multiobjective microfluidics-aided digital design for iCLIP.
(A) To maximize speed, iCLIP parameters are chosen for an input CAD model to minimize mass transport limitations by (B) optimizing the number and path of viaducts for changing part cross-sectional area, producing the dynamically changing viaduct path in (C). (D) To tune part (multi-)material properties, models are infiltrated with viaducts to transport either stiff or elastic resins to the dead zone, guided by (E) FEA simulations and experimentally validated by (F) mechanical testing in uniaxial compression (rigid lattices in gray, rigid elastomer composite lattices in equal ratios in light green, and elastomer lattices in dark green). Scale bars, 5 mm. Error bars denote ±1 SD from the mean. Simulation deformations are exaggerated for visualization.

References

    1. Huang J., Qin Q., Wang J., A review of stereolithography: Processes and systems. Processes 8, 1138 (2020).
    1. Tumbleston J., Shirvanyants D., Ermoshkin N., Janusziewicz R., Johnson A., Kelly D., Chen K., Pinschmidt R., Rolland J., Ermoshkin A., Samulski E., DeSimone J., Continuous liquid interface production of 3D objects. Science 347, 1349–1352 (2015). - PubMed
    1. Janusziewicz R., Tumbleston J., Quintanilla A., Mecham S., DeSimone J., Layerless fabrication with continuous liquid interface production. Proc. Natl. Acad. Sci. U.S.A. 113, 11703–11708 (2016). - PMC - PubMed
    1. Johnson A., Caudill C., Tumbleston J., Bloomquist C., Moga K., Ermoshkin A., Shirvanyants D., Mecham S., Luft C., DeSimone J., Single-step fabrication of computationally designed microneedles by continuous liquid interface production. PLOS ONE 11, e0162518 (2016). - PMC - PubMed
    1. Ware H., Sun C., Method for attaining dimensionally accurate conditions for high-resolution three-dimensional printing ceramic composite structures using microclip process. J. Micro Nano-Manuf. 7, 031001 (2019). - PMC - PubMed