. 2022 Sep 30;8(39):eabn9828.
doi: 10.1126/sciadv.abn9828. Epub 2022 Sep 28.

Accurate detection of benign and malignant renal tumor subtypes with MethylBoostER: An epigenetic marker-driven learning framework

Affiliations

Accurate detection of benign and malignant renal tumor subtypes with MethylBoostER: An epigenetic marker-driven learning framework

Sabrina H Rossi et al. Sci Adv. .

Abstract

Current gold standard diagnostic strategies are unable to accurately differentiate malignant from benign small renal masses preoperatively; consequently, 20% of patients undergo unnecessary surgery. Devising a more confident presurgical diagnosis is key to improving treatment decision-making. We therefore developed MethylBoostER, a machine learning model leveraging DNA methylation data from 1228 tissue samples, to classify pathological subtypes of renal tumors (benign oncocytoma, clear cell, papillary, and chromophobe RCC) and normal kidney. The prediction accuracy in the testing set was 0.960, with class-wise ROC AUCs >0.988 for all classes. External validation was performed on >500 samples from four independent datasets, achieving AUCs >0.89 for all classes and average accuracies of 0.824, 0.703, 0.875, and 0.894 for the four datasets. Furthermore, consistent classification of multiregion samples (N = 185) from the same patient demonstrates that methylation heterogeneity does not limit model applicability. Following further clinical studies, MethylBoostER could facilitate a more confident presurgical diagnosis to guide treatment decision-making in the future.


Figures
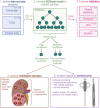
Fig. 1.
Fig. 1.. Overview of MethylBoostER.
Three DNA methylation datasets are used to train and test the XGBoost classification model. The model is then validated on four external datasets. The high- and moderate-confidence predictions from the model output are used for improving diagnostic decisions. Model performance on both multiregion samples and sample purity was assessed.
Fig. 2.
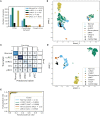
Fig. 2.. Data characteristics and testing set performance.
(A) Number of samples in each class used for the training/testing sets. (B) Uniform Manifold Approximation and Projection (UMAP) representation of the training/test dataset, using all input features. (C) Confusion matrix displaying the testing set performance, with precision and recall bars. (D) UMAP representation of the training/test dataset, using the input features learnt by the XGBoost model. (E) ROC curves over the testing set, split by class.
Fig. 3.
Fig. 3.. High- and moderate-confidence predictions.
(A) Histogram of the model’s probabilities of the predicted class for the testing sets. (B) Line plot showing how the testing set accuracy scores and fraction of high-confidence predictions vary as the threshold changes. The vertical dotted line indicates the chosen threshold, 0.85. (C) Graphical overview of the prediction process with high- and moderate-confidence predictions.
Fig. 4.
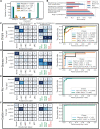
Fig. 4.. External validation on four independent datasets.
(A) Number of samples in each class for each dataset. (B) Accuracy for high- and moderate-confidence predictions for each external dataset. “First or second prediction” indicates that a prediction is treated as correct if its first or second prediction was correct. (C to F) Confusion matrices for both high- and moderate-confidence predictions and ROC curves, split by class, for each external dataset. For the moderate-confidence confusion matrices, the x axis is split into first prediction was correct, the second prediction was correct, and both first and second predictions were incorrect.
Fig. 5.
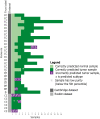
Fig. 5.. Classification of multiregion samples.
Diagram visualizing the model’s predictions of multiregion samples for each patient in the Cambridge and Evelönn datasets.
Fig. 6.
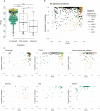
Fig. 6.. Sample purity and MethylBoostER output.
(A) Sample purity for samples that are predicted correctly on the first prediction (1st correct) and second prediction (2nd correct) and incorrectly predicted samples (incorrect) on both predictions. Data are shown for all datasets combined, with pathological subtypes shown in different colors. Adjusted P values are shown (*P < 0.05 and ***P < 0.0009). (B and C) Sample purity and the probability of the first prediction are demonstrated for all datasets combined (B) and each dataset individually (C). The threshold t = 0.85 indicates a high-confidence prediction. Samples that are incorrectly predicted (in both first and second prediction) are indicated with a cross.
Fig. 7.
Fig. 7.. The genomic location and functional annotation of the features selected by MethlyBoostER.
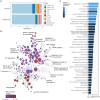
(A) Distribution of genomic locations (relative to genes) for the selected features compared to the background (the total set of input features). (B) Enriched GO terms from the Biological Process category represented as a network, where each branch represents a different functional category. Results were obtained from the gene-wise GO analysis. (C) Enriched GO terms from the Biological Process category represented as a bar plot. Results were obtained from the localized region GO analysis.
Fig. 8.
Fig. 8.. Proposed future integration of MethylBoostER model into the existing diagnostic pathway for patients with SRMs.
Following future model refinements and clinical trials, MethylBoostER could play a role in the diagnostic pathway. Here, we describe the potential clinical utility. Patients would have an image-guided renal biopsy, and biopsy samples would undergo DNA methylation analysis. MethylBoostER results would be interpreted in the context of integration with clinical and imaging data. For high-confidence predictions, MethylBoostER would predict one class, where benign oncocytoma and malignant RCC would likely be managed with active surveillance and active treatment, respectively. In moderate-confidence predictions, the two classes with the highest probabilities would be predicted. Samples with low purity or cases in which MethylBoostER predicts normal kidney (suggesting that the target lesion was missed) would prompt repeat biopsy.

References

    1. Capitanio U., Bensalah K., Bex A., Boorjian S. A., Bray F., Coleman J., Gore J. L., Sun M., Wood C., Russo P., Epidemiology of renal cell carcinoma. Eur. Urol. 75, 74–84 (2019). - PMC - PubMed
    1. Welch H. G., Skinner J. S., Schroeck F. R., Zhou W., Black W. C., Regional variation of computed tomographic imaging in the United States and the risk of nephrectomy. JAMA Intern. Med. 178, 221–227 (2018). - PMC - PubMed
    1. Shuch B., Amin A., Armstrong A. J., Eble J. N., Ficarra V., Lopez-Beltran A., Martignoni G., Rini B. I., Kutikov A., Understanding pathologic variants of renal cell carcinoma: Distilling therapeutic opportunities from biologic complexity. Eur. Urol. 67, 85–97 (2015). - PubMed
    1. Moch H., Cubilla A. L., Humphrey P. A., Reuter V. E., Ulbright T. M., The 2016 WHO classification of tumours of the urinary system and male genital organs-part A: Renal, penile, and testicular tumours. Eur. Urol. 70, 93–105 (2016). - PubMed
    1. Patel H. D., Druskin S. C., Rowe S. P., Pierorazio P. M., Gorin M. A., Allaf M. E., Surgical histopathology for suspected oncocytoma on renal mass biopsy: A systematic review and meta-analysis. BJU Int. 119, 661–666 (2017). - PubMed