. 2022 Sep 30;8(39):eabo3991.
doi: 10.1126/sciadv.abo3991. Epub 2022 Sep 28.

Sex-specific epigenetic development in the mouse hypothalamic arcuate nucleus pinpoints human genomic regions associated with body mass index

Affiliations

Sex-specific epigenetic development in the mouse hypothalamic arcuate nucleus pinpoints human genomic regions associated with body mass index

Harry MacKay et al. Sci Adv. .

Abstract

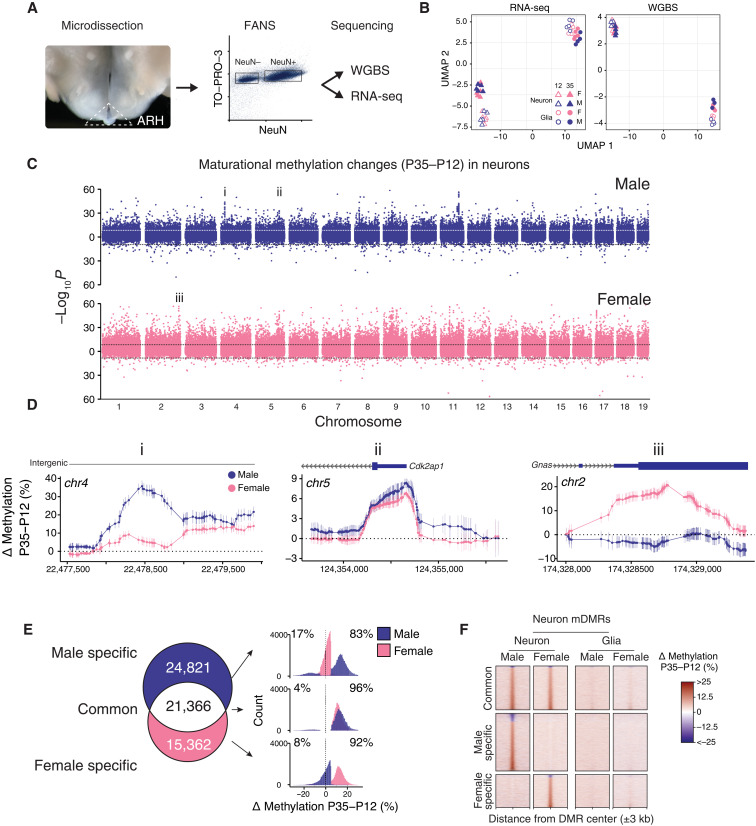
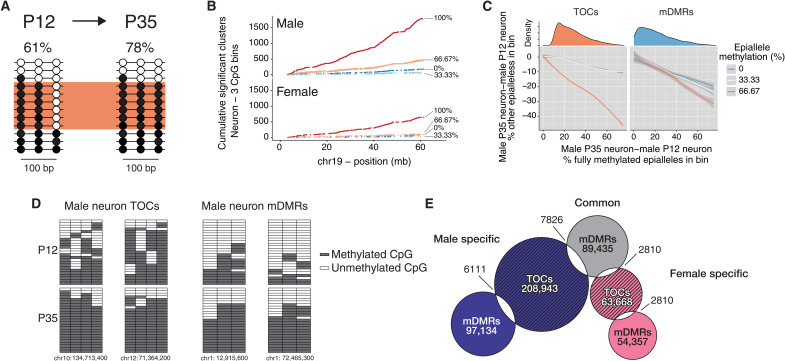
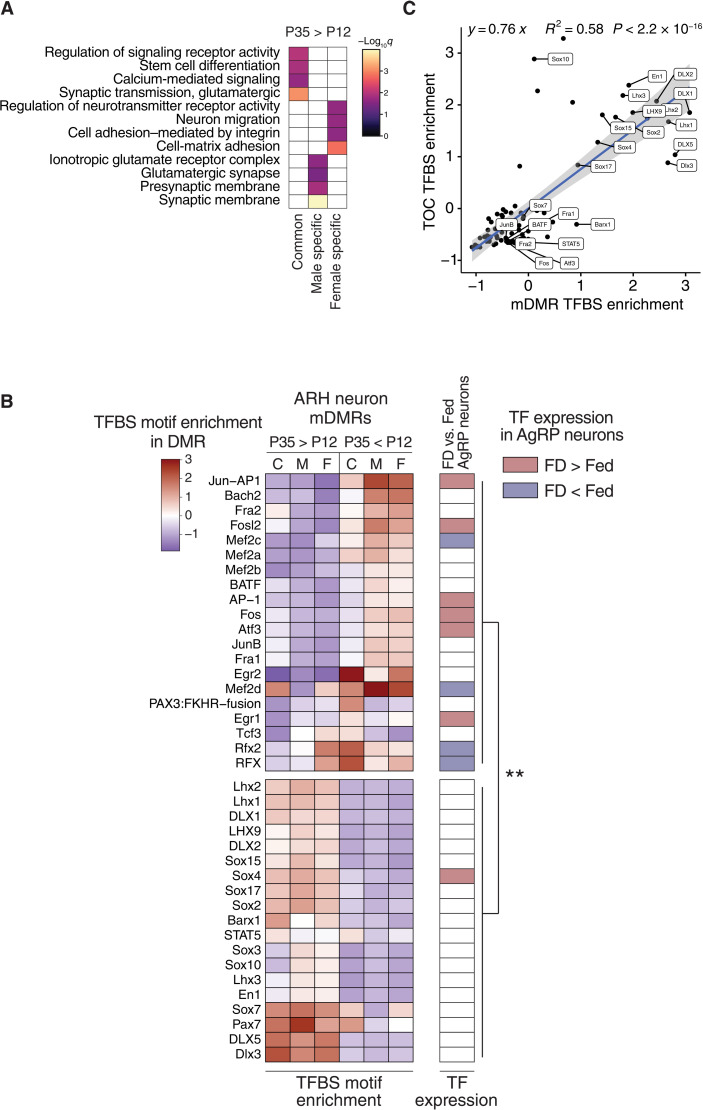
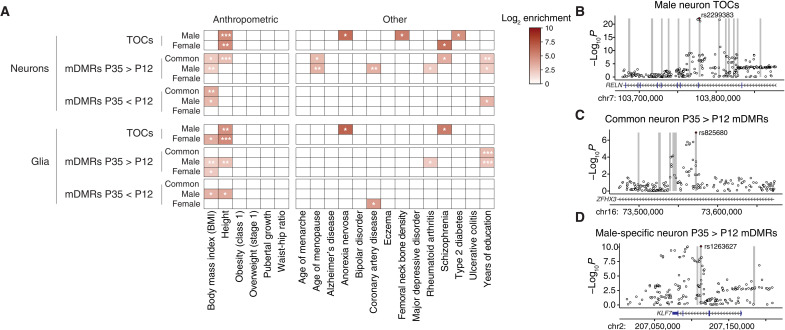
Recent genome-wide association studies corroborate classical research on developmental programming indicating that obesity is primarily a neurodevelopmental disease strongly influenced by nutrition during critical ontogenic windows. Epigenetic mechanisms regulate neurodevelopment; however, little is known about their role in establishing and maintaining the brain's energy balance circuitry. We generated neuron and glia methylomes and transcriptomes from male and female mouse hypothalamic arcuate nucleus, a key site for energy balance regulation, at time points spanning the closure of an established critical window for developmental programming of obesity risk. We find that postnatal epigenetic maturation is markedly cell type and sex specific and occurs in genomic regions enriched for heritability of body mass index in humans. Our results offer a potential explanation for both the limited ontogenic windows for and sex differences in sensitivity to developmental programming of obesity and provide a rich resource for epigenetic analyses of developmental programming of energy balance.


Figures

Fig. 1.
Fig. 1.. Postnatal epigenetic maturation in ARH neurons is sex specific.
(A) Illustration of ARH microdissection approach (left) and representative scatterplot from FANS (right). (B) UMAP clustering of autosomal RNA-seq and WGBS data on ARH neurons and glia from both ages and sexes. (C) Miami plot showing the significance of P35 to P12 differential methylation, at the CpG level, in male and female neurons. Points plotted above/below the origin represent CpGs that gained/lost methylation from P35 to P12, respectively. Y axis represents raw P values. Genome-wide significance threshold (horizontal dotted lines) = P < 2.45 × 10⁻⁹. (D) CpG-level plots of example regions from (C) showing clusters of male-specific (i), common (ii), and female-specific (iii) differentially methylated CpGs. (E) Venn diagram illustrating the overlap of mDMRs identified in male and female ARH neurons. Histograms (right) show the magnitudes and directions of these maturational methylation changes. Median differential methylation for P35 > P12 mDMRs ranged from 12.3 to 15.3%, and 13.8 to 17.5% in P35 < P12 mDMRs. (F) Heatmaps showing P35 to P12 differential methylation in 6-kb genomic regions centered on neuron mDMRs; most do not show methylation changes in glia.
Fig. 2.
Fig. 2.. Read-level analysis indicates epigenetic maturation in subsets of ARH neurons.
(A) Methylation changes that occur in only a subset of ARH neurons (orange box) may not be detected by conventional DMR callers; at each age, average methylation across all reads is shown. (B) Cumulative frequency along chromosome 19 of epiallele methylation states enriched in P35 relative to P12 neurons. Data are shown for three-CpG genomic bins by bin average methylation (0%: 000; 33.3%: 100, 010, or 001; 66.7%: 101, 110, or 011; 100%: 111; unmethylated/methylated CpGs represented by 0/1). The dominant feature is the enrichment of new 100% methylated clusters. (C) For such regions (left), proportional losses of partially methylated clusters (y axis) are plotted versus corresponding gains of fully methylated clusters at P35 relative to P12. The steep orange line indicates that most increases in fully methylated clusters arise from 66.7% methylated clusters (i.e., just one additional CpG site methylated); we call these TOCs. By contrast, at mDMRs (right), gains in fully methylated clusters arise equally from all other epialleles. Density distributions (top) show that most TOCs involve fewer than 40% of the reads in each bin. (D) Plots of read-level methylation and epiallele proportions in representative male neuronal TOC and mDMR bins. In the grids, rows and columns represent sequence reads and CpG sites, respectively. (E) Venn diagram illustrates numbers and overlaps of TOCs and mDMRs identified in male and female ARH neurons.
Fig. 3.
Fig. 3.. Postnatal epigenetic maturation in ARH neurons is associated with maturation of the response to dietary signals.
(A) GO biological function analysis of genes associated with common and sex-specific P35 > P12 neuron mDMRs. (B) Heatmap illustrating scaled enrichment of TF binding site motifs among neuron mDMRs that increase (P35 > P12) or decrease (P35 < P12) with age (left). K-means clustering (k = 2) divides these into two groups (top and bottom). Food deprivation–induced differential expression of TFs in AgRP neurons (right) (46). TFs regulated by food deprivation (FD) are enriched among the motifs associated with P35 < P12 mDMRs (χ2 = 10.16, P < 0.01). (C) Scaled motif enrichment in male neuron P35 > P12 TOCs is highly correlated with that at mDMRs (P < 2.2 × 10⁻¹⁶).
Fig. 4.
Fig. 4.. Regions of sex-specific epigenetic maturation in mouse ARH are enriched for heritability of BMI in humans.
(A) Significant enrichment of BMI-associated GWAS SNVs in mDMRs and TOCs as computed by stratified LD score regression. Only enrichments remaining significant after Benjamini-Hochberg correction are shown. (B to D) Examples of overlaps between TOCs or mDMRs and NHGRI index SNVs associated with BMI. Human orthologs of mDMRs and TOCs (±1 kb) are indicated by vertical gray bars. Benjamini-Hochberg–adjusted P values for SNV-BMI associations obtained from (9). *P < 0.05, **P < 0.01, and ***P < 0.001.
Fig. 5.
Fig. 5.. Conceptual model for how sex-specific epigenetic development in the ARH could underlie sex differences in susceptibility to developmental programming.
Illustrations depict early postnatal methylation dynamics at a female-precocious neuronal mDMR (i.e., one at which methylation increases earlier in female than in male ARH neurons). Under normal postnatal nutrition (top), the same developmental outcome is achieved in both male and female ARH neurons (potential conversion of some nascent 5mC to 5hmC is illustrated by dotted arrows projecting out of the page). In this hypothetical example, overnutrition from P2 to P10 (bottom) impairs de novo methylation only in females, because this epoch overlaps the critical window for ARH neuronal epigenetic maturation at this female-precocious locus.

References

    1. Swinburn B. A., Kraak V. I., Allender S., Atkins V. J., Baker P. I., Bogard J. R., Brinsden H., Calvillo A., De Schutter O., Devarajan R., Ezzati M., Friel S., Goenka S., Hammond R. A., Hastings G., Hawkes C., Herrero M., Hovmand P. S., Howden M., Jaacks L. M., Kapetanaki A. B., Kasman M., Kuhnlein H. V., Kumanyika S. K., Larijani B., Lobstein T., Long M. W., Matsudo V. K. R., Mills S. D. H., Morgan G., Morshed A., Nece P. M., Pan A., Patterson D. W., Sacks G., Shekar M., Simmons G. L., Smit W., Tootee A., Vandevijvere S., Waterlander W. E., Wolfenden L., Dietz W. H., The global syndemic of obesity, undernutrition, and climate change: The Lancet Commission report. Lancet 393, 791–846 (2019). - PubMed
    1. Widdowson E., McCance R. A., The effect of finite periods of undernutrition at different ages on the composition and subsequent development of the rat. Proc. R. Soc. London Ser. B Biol. Sci. 158, 329–342 (1963). - PubMed
    1. Ravelli G. P., Stein Z. A., Susser M. W., Obesity in young men after famine exposure in utero and early infancy. N. Engl. J. Med. 295, 349–353 (1976). - PubMed
    1. Gluckman P. D., Hanson M., Zimmet P., Forrester T., Losing the war against obesity: The need for a developmental perspective. Sci. Transl. Med. 3, 93cm19 (2011). - PubMed
    1. Zeltser L. M., Feeding circuit development and early-life influences on future feeding behaviour. Nat. Rev. Neurosci. 19, 302–316 (2018). - PMC - PubMed