. 2022 Sep 30;8(39):eabo4662.
doi: 10.1126/sciadv.abo4662. Epub 2022 Sep 28.

Neurons burdened by DNA double-strand breaks incite microglia activation through antiviral-like signaling in neurodegeneration

Affiliations

Neurons burdened by DNA double-strand breaks incite microglia activation through antiviral-like signaling in neurodegeneration

Gwyneth M Welch et al. Sci Adv. .

Abstract

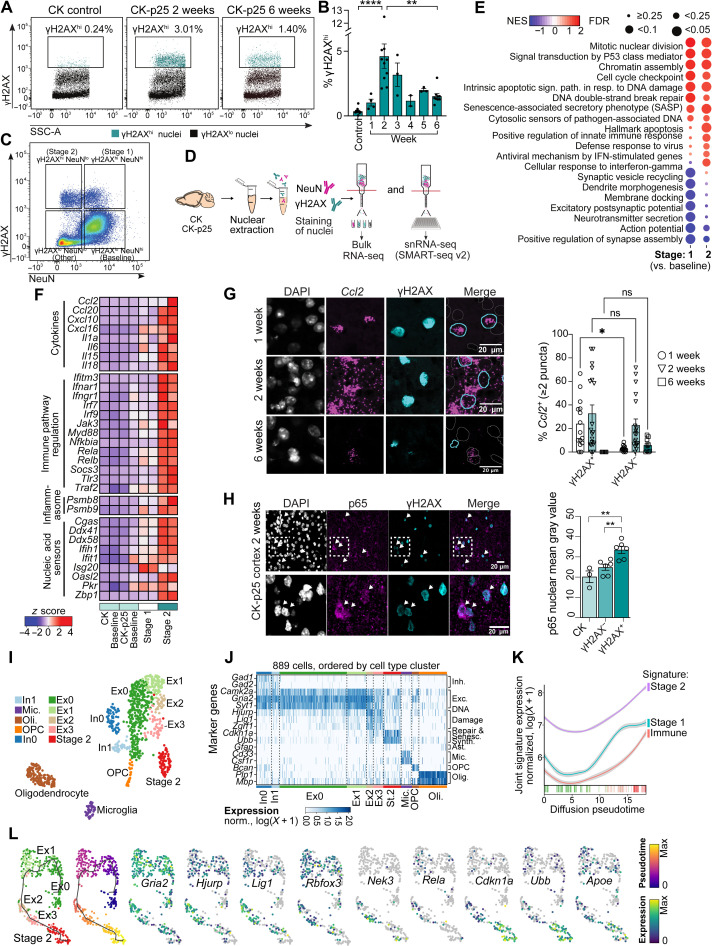
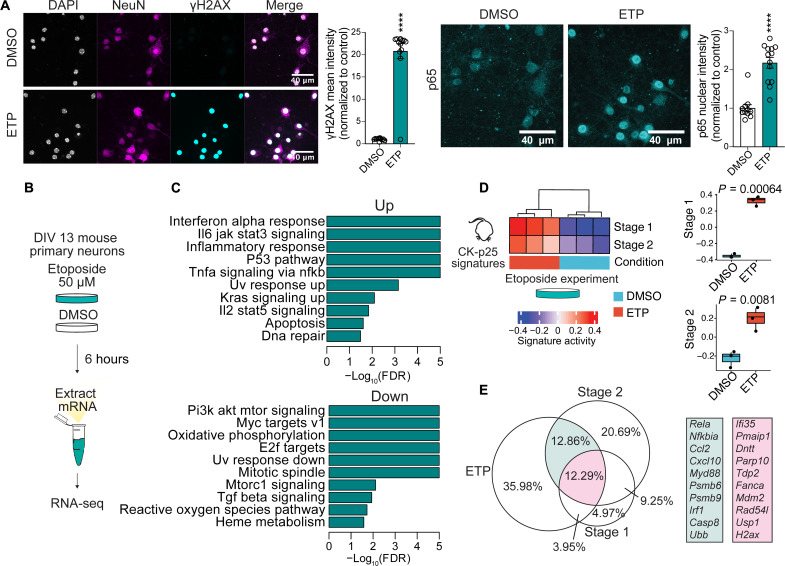
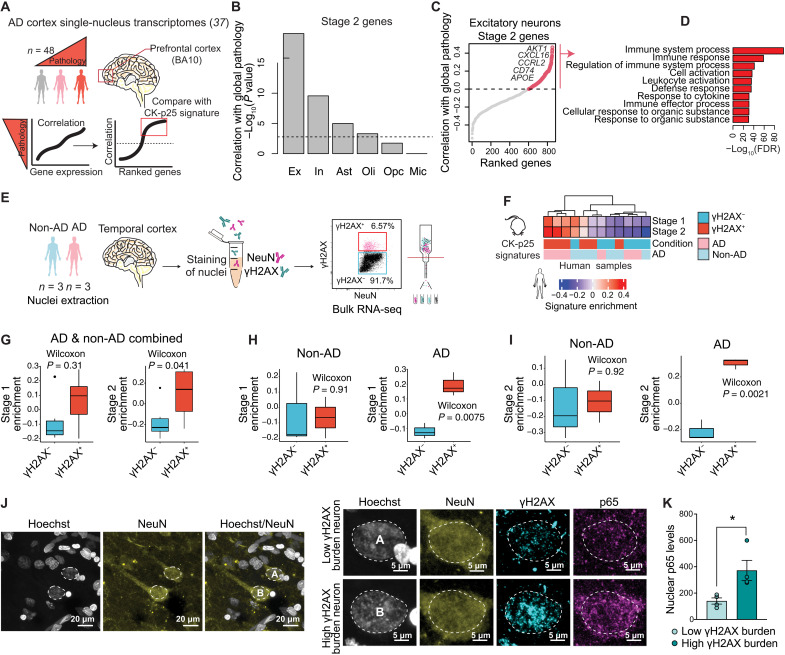
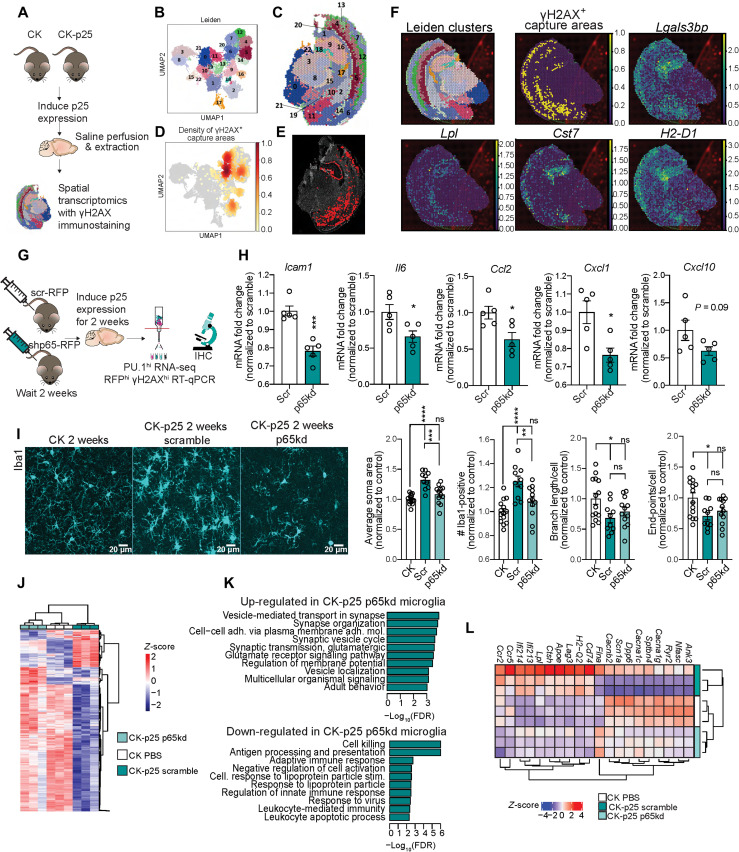
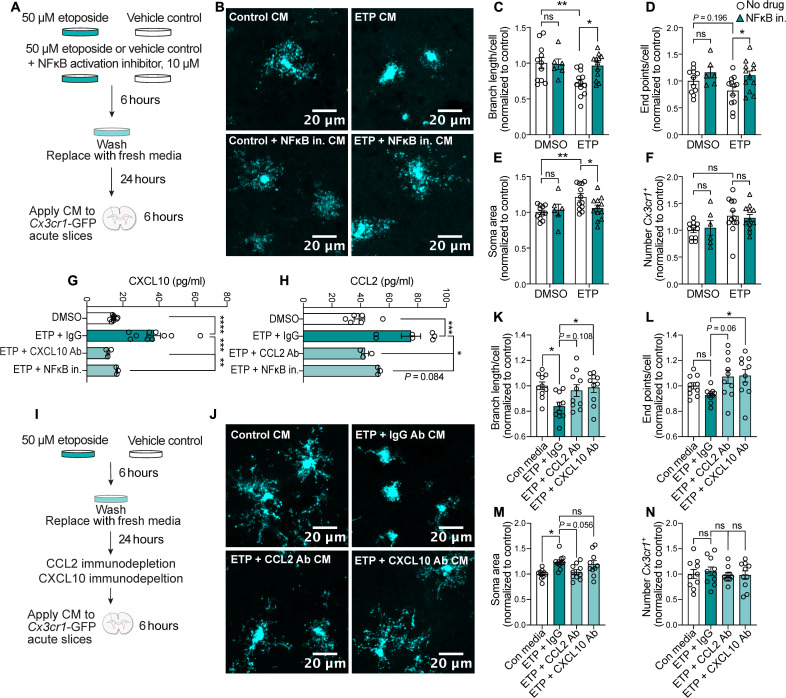
DNA double-strand breaks (DSBs) are linked to neurodegeneration and senescence. However, it is not clear how DSB-bearing neurons influence neuroinflammation associated with neurodegeneration. Here, we characterize DSB-bearing neurons from the CK-p25 mouse model of neurodegeneration using single-nucleus, bulk, and spatial transcriptomic techniques. DSB-bearing neurons enter a late-stage DNA damage response marked by nuclear factor κB (NFκB)-activated senescent and antiviral immune pathways. In humans, Alzheimer's disease pathology is closely associated with immune activation in excitatory neurons. Spatial transcriptomics reveal that regions of CK-p25 brain tissue dense with DSB-bearing neurons harbor signatures of inflammatory microglia, which is ameliorated by NFκB knockdown in neurons. Inhibition of NFκB in DSB-bearing neurons also reduces microglia activation in organotypic mouse brain slice culture. In conclusion, DSBs activate immune pathways in neurons, which in turn adopt a senescence-associated secretory phenotype to elicit microglia activation. These findings highlight a previously unidentified role for neurons in the mechanism of disease-associated neuroinflammation.


Figures

Fig. 1.
Fig. 1.. Neurons marked by DNA DSBs activate inflammatory signaling at early stages of neurodegeneration.
(A) Flow cytometry dot plots of γH2AXhi nuclei (turquoise) from CK and CK-p25 cortex. (B) Quantification of percent γH2AXhi for 1 to 6 weeks. Each data point represents percent γH2AXhi nuclei from one mouse. (C) Representative dot plot of γH2AX and NeuN immunoreactivity in 2-week CK-p25 cortex. (D) RNA-seq workflow. Bulk RNA-seq: n = 2 per genotype for bulk RNA-seq, 2-week time point. snRNA-seq: n = 3 per genotype at 1- and 2-week time points. (E) Differential Gene Ontology terms from bulk RNA-seq. FDR, false discovery rate; IFN, interferon; NES, normalized enrichment score. (F) Heatmap of differentially expressed genes associated with inflammation from bulk RNA-seq. (G) Left: Representative images of Ccl2 γH2AX staining for 1-, 2-, and 6-week CK-p25 cortex. Right: Quantification of number γH2AX+ and γH2AX cells with ≥2 Ccl2 puncta. Data points represent one image from one mouse. Three to four images were taken per mouse (1 week, n = 4; 2 weeks, n = 5; 6 weeks, n = 3). DAPI, 4′,6-diamidino-2-phenylindole. (H) Top: Representative image of p65 in 2-week CK-p25. Bottom: Quantification of p65 mean intensity for γH2AX+ and γH2AX nuclei. Data points represent 20 to 60 nuclei from one mouse. (I) UMAP (Uniform Manifold Approximation and Projection) of gated populations from CK and CK-p25 cortex at 1- and 2-week time points. (J) Marker gene expression for each cell type cluster. (K and L) Trajectory analysis of Ex0, Ex1, Ex2, Ex3, and stage 2 neurons. Smoothened gene signature expression across pseudotime. Immune = stage 2 immune genes. Padj < 0.05, log2 fold change ≥ 1.0 (K). Individual genes across trajectory (L). Error bars represent SEM; ****P < 0.0001, **P < 0.01, and *P < 0.05; ns, not significant. One-way analysis of variance (ANOVA) with Tukey’s test for multiple comparisons (B and H). Two-way ANOVA followed by Sidak’s test for multiple comparisons (G). Data are pooled from four independent experiments (B). Data are representative of two independent experiments (G and H).
Fig. 2.
Fig. 2.. Induction of DNA DSBs is sufficient to elicit immune pathway signaling in neuron primary culture.
(A) Left: Representative images of NeuN and γH2AX immunostaining in etoposide (ETP) and vehicle-treated primary cultures. Each data point represents γH2AX mean gray value for one nucleus. Right: Representative images of p65 immunostaining in ETP- and vehicle-treated primary cultures. Each data point represents p65 mean gray value for one nucleus. (B) Schematic of ETP treatment. DIV13 neuron primary cultures were treated with either 50 μM ETP or vehicle control (DMSO) for 6 hours. (C) Differential Gene Ontology (biological pathway) terms identified through GSEA from ETP versus DMSO contrast. (D) Left: Heatmap of stage 1 and stage 2 signature enrichment in DMSO- and ETP-treated neurons. Right: Quantification of stage 1 and stage 2 signature enrichment in DMSO- and ETP-treated neurons. Each data point represents one biological replicate. (E) Venn diagram of significantly up-regulated protein-coding genes from ETP-treated neurons and stage 1 and stage 2 gene signatures. Percentages are in reference to the total number of unique genes from all three gene sets. Genes overlapping in ETP and stage 2 are in turquoise. Genes overlapping in ETP, stage 2, and stage 1 are in magenta. The area of the circles is in proportion to the size of the gene sets. Error bars represent SEM; ****P < 0.0001. Student’s t test (A). Wilcoxon test (D). Data are representative of three independent experiments (A).
Fig. 3.
Fig. 3.. Inflammatory signaling in DSB-bearing neurons is positively correlated with Alzheimer’s disease pathology.
(A) Schematic of the stage 2 signature analysis in the AD snRNA-seq dataset (37). (B) Quantification of stage 2 signature correlation with global pathology in cell type clusters (37). Stage 2 genes were tested for significant and positive correlation with the global pathology metric for each major cell type. The −log10 P value for these tests is shown in the histogram. The dashed line indicates a P value of 0.01 after Bonferroni correction for multiple testing. Ex, excitatory neurons; In, inhibitory neurons; Ast, astrocytes; Oli, oligodendrocytes; Opc, oligodendrocyte precursor cells; Mic, microglia. (C) Stage 2 signature genes ranked by their correlation with global pathology in excitatory neurons. Example stage 2 genes are shown with red circles. (D) Gene Ontology of stage 2 signature genes positively correlated with global pathology. (E) Schematic of γH2AXhi nuclei sorting from AD and non-AD brain tissue. (F) Heatmap of stage 1 and stage 2 signature enrichment in γH2AXhi and γH2AXlo human NeuNhi nuclei. (G to I) Quantification of stage 1 and stage 2 signature enrichment in γH2AXhi and γH2AXlo human NeuNhi nuclei samples by FANS gate (G), as well as FANS gate and disease status (H and I). (J) Representative image of γH2AX, p65, and NeuN in the AD brain. Left: Two NeuN+ nuclei are outlined (white dashed line). Right: Magnification of the two outlined nuclei. Top nucleus (A) represents low DSB burden; bottom nucleus (B) represents high DSB burden. (K) Quantification of p65 nuclear enrichment in low and high DSB-burdened neurons. Each dot represents the average of 23 to 41 NeuN+ nuclei per individual. Error bars represent SEM; *P < 0.05. Student’s t test (K). Wilcoxon test (G to I).
Fig. 4.
Fig. 4.. Immune signaling in neurons recruits and activates microglia.
(A) Schematic of spatial transcriptomics experiment. CK (n = 3) and CK-p25 (n = 4) were induced for 2 weeks. Coronal brain sections were stained and imaged for γH2AX and then sequenced. (B) UMAP of capture areas from all samples. Leiden clusters are indicated by color and number. Each dot represents one capture area. (C) Leiden clusters superimposed onto a CK-p25 brain slice used for spatial transcriptomics. (D) UMAP indicating the density of γH2AX+ capture areas. (E) γH2AX+ capture areas identified in one CK-p25 brain slice. (F) Spatial clusters, γH2AX+ capture areas, and reactive microglia signature gene expression in one CK-p25 sample. (G) Schematic of neuronal p65 knockdown experiment. CK-p25 mice received retro-orbital injections of scramble shRNA–red fluorescent protein (RFP) adeno-associated virus (AAV) or shp65-RFP AAV. CK mice received retro-orbital injections of phosphate-buffered saline (PBS). Mice recovered for 2 weeks before being taken off dox. Brains were collected at the 2-week time point. (H) Reverse transcription quantitative polymerase chain reaction of immune genes in sorted RFPhi γH2AXhi nuclei. (I) Representative images of Iba1 in CK, scramble, and p65kd cortex. (J) Quantification of (left to right) Iba1+ soma area, number Iba1+ per image, average branch length per Iba1+ cell, and number end points per Iba1+ cell. Each data point represents one image. Two images were taken per mouse. (K) Heatmap of differentially expressed genes from p65 versus scramble contrast. (L) Up-regulated and down-regulated Gene Ontology (biological pathway) terms identified through GSEA of p65kd versus scramble contrast. (L) Heatmap of significantly up-regulated and down-regulated genes in PU.1hi nuclei from p65kd cortex compared to PU.1hi nuclei from scramble cortex. Error bars represent SEM; ****P < 0.0001, ***P < 0.001, **P < 0.01, and *P < 0.05. Student’s t test (H). One-way ANOVA followed by Holm-Sidak’s test for multiple comparisons (I). (H) Scramble (n = 5), p65kd (n = 5). (I) CK (n = 7), scramble (n = 5), p65kd (n = 6).
Fig. 5.
Fig. 5.. CCL2 and CXCL10 are secreted by DSB-bearing neurons to activate microglia.
(A) Schematic for treating acute Cx3cr1-GFP slices with conditioned medium (CM) from ETP-treated primary neurons. Cultures were treated with 50 μM ETP or vehicle control (DMSO) ± 10 μM NFκB Activation Inhibitor VI (IKK2 inhibitor) for 6 hours. Cultures were washed with PBS, and the medium was replaced. After 24 hours, the medium was applied to acute Cx3cr1-GFP slices for 6 hours. (B) Representative images of GFP in Cx3cr1-GFP acute slices treated with CM. (C to F) Quantification of branch length (C), end points (D), soma area per microglia (E), and number of microglia per image (F). Each data point represents the average of two images in one acute slice. (G and H) Quantification of CXCL10 (G) and CCL2 (H) from CM from control and ETP-treated primary neurons. Each data point represents one biological replicate. (I) Schematic of ETP CM experiment. Primary neurons were treated with either ETP or DMSO for 6 hours and washed with PBS, and then the medium was replaced. Cultures recovered for 24 hours before CM was collected. Immunoglobulin G (IgG), CCL2, or CXCL10 antibodies were used to immunodeplete CM before they were applied to Cx3cr1-GFP acute slices for 6 hours. (J) Representative images of microglia from acute slices treated with different CM. (K to N) Quantification of (K) branch length (L) end points, soma area per microglia (M), and number of microglia per image (N). Each data point represents the average of two images in one acute slice. Error bars represent SEM; ****P < 0.0001, ***P < 0.001, **P < 0.01, and *P < 0.05. Two-way ANOVA followed by Sidak’s test for multiple comparisons (C to F). One-way ANOVA followed by Tukey’s test for multiple comparisons (K to N). Data are combined from two independent experiments (C to F and K to N). Data are combined from three independent experiments (G and H).

Similar articles

Cited by

References

    1. Madabhushi R., Pan L., Tsai L.-H., DNA damage and its links to neurodegeneration. Neuron 83, 266–282 (2014). - PMC - PubMed
    1. Welch G., Tsai L., Mechanisms of DNA damage-mediated neurotoxicity in neurodegenerative disease. EMBO Rep. 23, e54217 (2022). - PMC - PubMed
    1. Lu T., Pan Y., Kao S.-Y., Li C., Kohane I., Chan J., Yankner B. A., Gene regulation and DNA damage in the ageing human brain. Nature 429, 883–891 (2004). - PubMed
    1. Lovell M. A., Markesbery W. R., Oxidative DNA damage in mild cognitive impairment and late-stage Alzheimer’s disease. Nucleic Acids Res. 35, 7497–7504 (2007). - PMC - PubMed
    1. Jacobsen E., Beach T., Shen Y., Li R., Chang Y., Deficiency of the Mre11 DNA repair complex in Alzheimer’s disease brains. Mol. Brain Res. 128, 1–7 (2004). - PubMed