. 2022 Sep 30;8(39):eabo1123.
doi: 10.1126/sciadv.abo1123. Epub 2022 Sep 28.

Circadian disruption enhances HSF1 signaling and tumorigenesis in Kras-driven lung cancer

Affiliations

Circadian disruption enhances HSF1 signaling and tumorigenesis in Kras-driven lung cancer

Marie Pariollaud et al. Sci Adv. .

Abstract

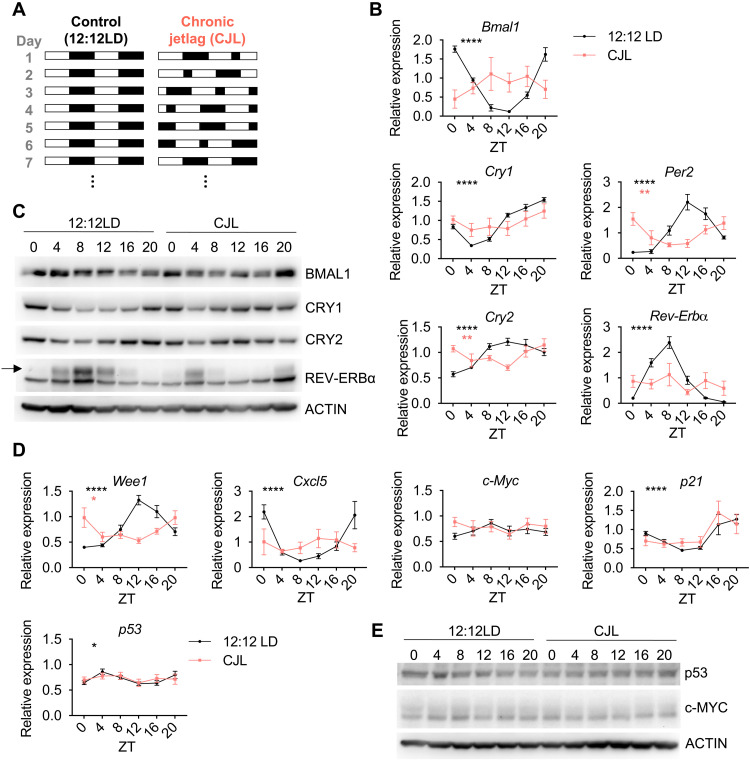
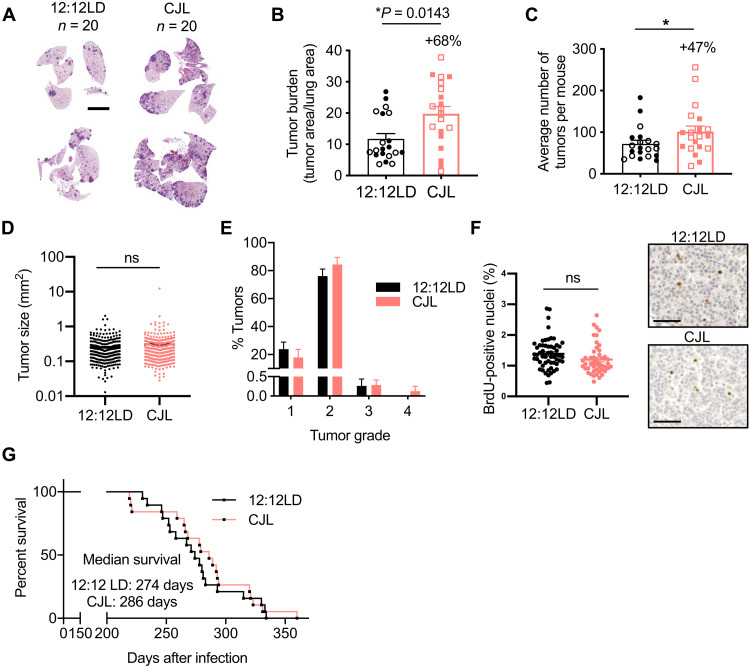
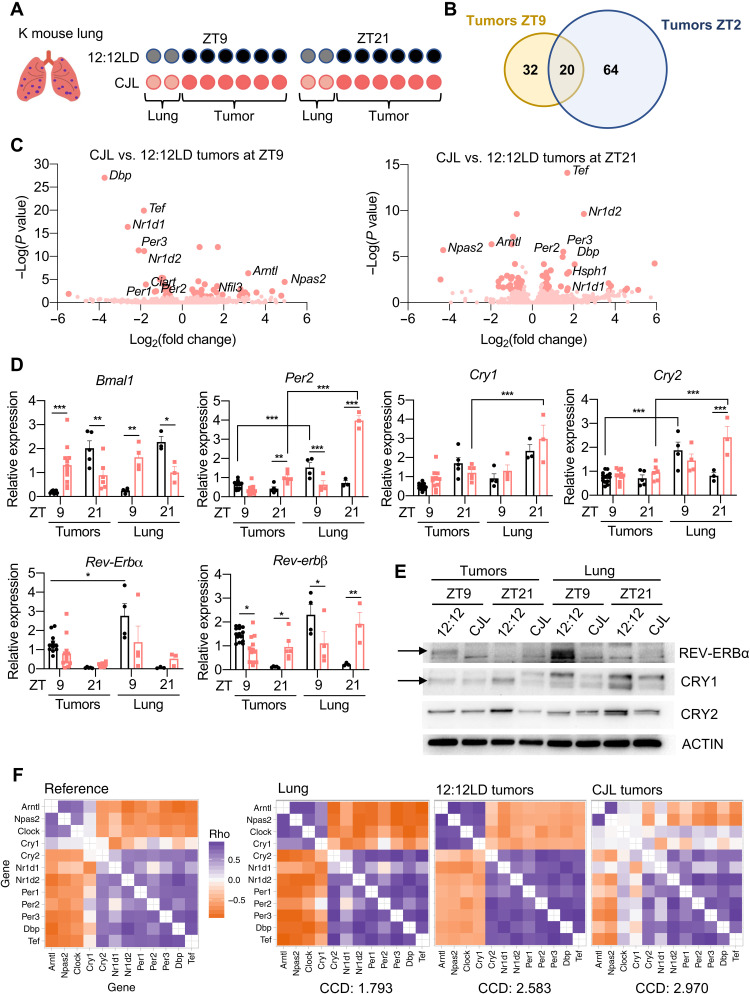
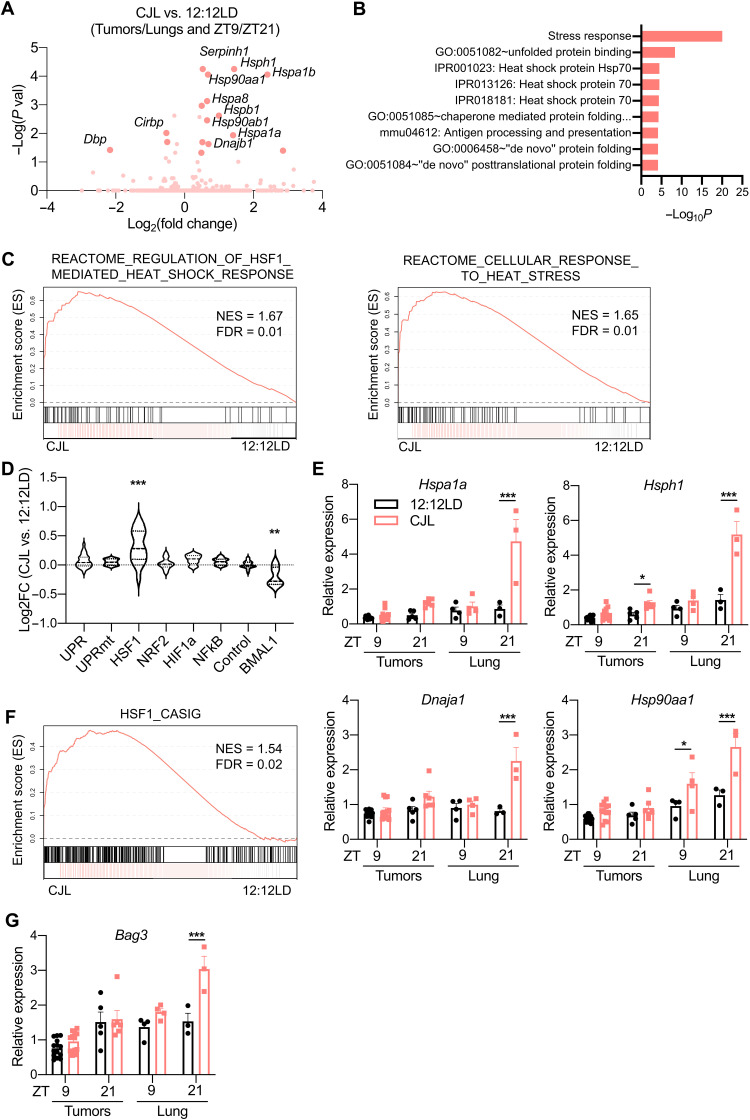
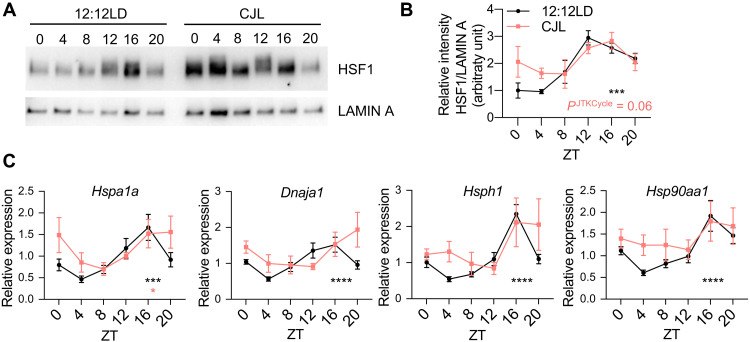
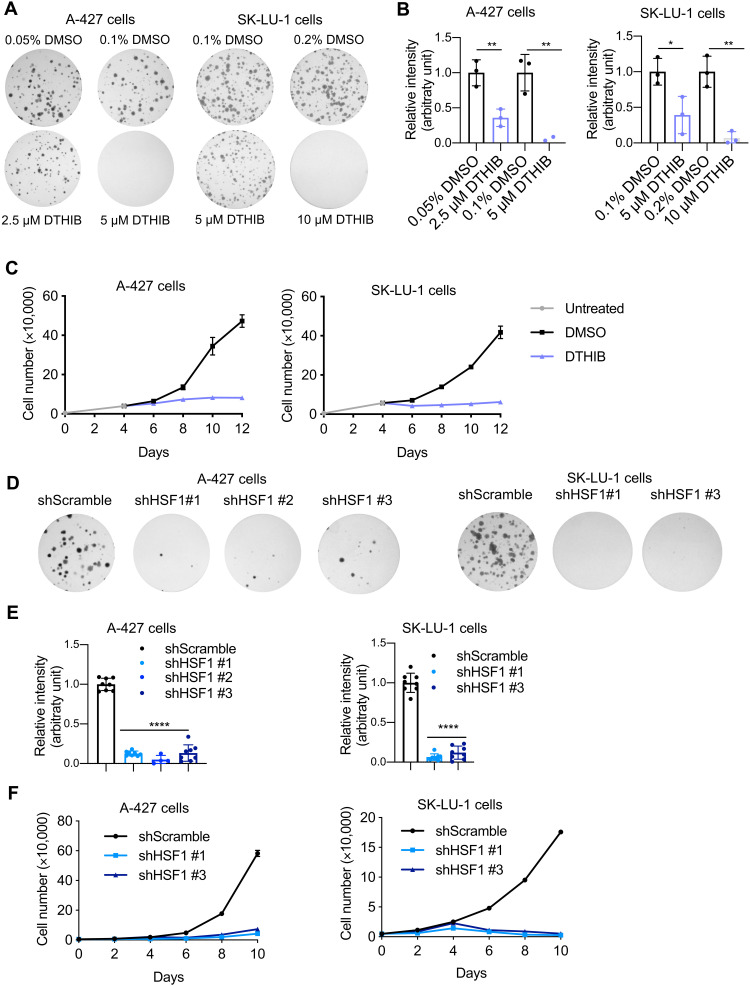
Disrupted circadian rhythmicity is a prominent feature of modern society and has been designated as a probable carcinogen by the World Health Organization. However, the biological mechanisms that connect circadian disruption and cancer risk remain largely undefined. We demonstrate that exposure to chronic circadian disruption [chronic jetlag (CJL)] increases tumor burden in a mouse model of KRAS-driven lung cancer. Molecular characterization of tumors and tumor-bearing lung tissues revealed that CJL enhances the expression of heat shock factor 1 (HSF1) target genes. Consistently, exposure to CJL disrupted the highly rhythmic nuclear trafficking of HSF1 in the lung, resulting in an enhanced accumulation of HSF1 in the nucleus. HSF1 has been shown to promote tumorigenesis in other systems, and we find that pharmacological or genetic inhibition of HSF1 reduces the growth of KRAS-mutant human lung cancer cells. These findings implicate HSF1 as a molecular link between circadian disruption and enhanced tumorigenesis.


Figures

Fig. 1.
Fig. 1.. CJL severely impairs rhythmicity and magnitude of core clock and clock-controlled genes in the lung.
(A) Schematic representation of the CJL protocol. White and black rectangles represent periods of light and dark, respectively. Each row represents two consecutive days starting with the numbered day shown at left. (B to E) C57BL/6J male and female mice were housed in 12:12LD or CJL for 8 weeks. Lung tissues were collected at the indicated times (ZT0: light on; ZT12: light off) on day 1 of the schedule shown in (A). (B and D) Gene expression normalized to U36b4 measured by quantitative real-time PCR. Data represent means ± SEM for three males and three females per time point and light condition. Rhythmicity was determined by JTK_Cycle analyses; *PJTKcycle < 0.05, **PJTKcycle < 0.01, and ****PJTKcycle < 0.0001. (C and E) Proteins detected by immunoblot. Each lane on the Western blot represents a sample prepared from a unique animal. Representative images were taken from n = 6 biological replicates.
Fig. 2.
Fig. 2.. CJL causes an increase in tumor burden in K mice but has no impact on survival.
Five weeks after infection with lentivirus-Cre, K mice were placed in either 12:12LD or CJL for 20 weeks (A to F) or until signs of distress (G). (A) Representative H&E-stained sections at end point. Scale bars, 5000 μm. Tumor burden (B), numbers (C), size (D), and grade (E) were assessed from H&E sections. Column data represent means ± SEM. Values for individual animals (B, C, and E) or tumors (D) are plotted. (B and C) Clear and filled symbols represent males and females, respectively. *P < 0.05 by Mann-Whitney test. (F) Representative BrdU IHC images in tumors from K mice euthanized at ZT5 and quantitation of stained positive nuclei. Scale bar, 50 μm. (G) Kaplan-Meier survival analysis for K mice placed in 12:12LD (n = 19) or CJL (n = 19) conditions.
Fig. 3.
Fig. 3.. CJL further disrupts an already dysregulated clockwork in tumors from K mice.
Five weeks after infection with lentivirus-Cre, K mice were placed in either 12:12LD or CJL for 20 weeks. (A) For RNA sequencing, six tumors per animal and two mice per time point and light conditions were used. (B) Plots indicating the numbers of differentially expressed genes between 12:12LD and CJL by DESeq2 analyses for each condition, with adujusted P value < 0.05 and fold change > ±1.4 cutoffs. (C) Volcano plots of differentially expressed genes between 12:12LD and CJL by DESeq2 analyses for tumors collected at ZT9 and ZT21. (D) Gene expression normalized to U36b4 measured by quantitative real-time PCR. Data represent means ± SEM; n = 14 and 12 for tumors collected at ZT9 in 12:12LD and CJL, respectively; n = 5 and 6 for tumors collected at ZT21 in 12:12LD and CJL, respectively; and n = 3 to 4 for lung samples. *P < 0.05, **P < 0.01, and ***P < 0.001 by two-way ANOVA post hoc Bonferroni test. (E) Proteins detected by immunoblot. Tumors and lungs for each light condition and time point on the blot were from the same animal. Representative images were taken from n = 3 biological replicates. (F) Heatmaps of Spearman correlation between each pair of the 12 clock genes and corresponding CCD (relative to the mouse reference) in murine healthy lung from previously published dataset GSE54651 or in tumors from 12:12LD or CJL conditions.
Fig. 4.
Fig. 4.. CJL enhances expression of the HSF1-mediated heat shock response and cancer signature in KrasG12D-driven lung tumor model.
Five weeks after infection with lentivirus-Cre, K mice were placed in either 12:12LD or CJL for 20 weeks. (A) Volcano plots of differentially expressed genes between 12:12LD and CJL by DESeq2 analyses for all samples (tumors + lungs), taking time of collection (ZT9/21) as confounding factor. (B) DAVID analyses on the differentially expressed genes by DESeq2 in all samples between 12:12LD and CJL, taking time of collection as confounding factor. Only terms with false discovery rate (FDR) < 0.25 are shown. (C) GSEA plots for the cellular response to heat stress and HSF1-mediated heat shock response reactome gene sets applied to samples (lungs + tumors) from CJL versus 12:12LD-housed K mice. NES, normalized enrichment score. (D) Activation of stress response pathways by CJL in lungs and tumors, independently of collection time, revealed by grouped fold change for transcripts established as selective targets of each stress pathways (49) or “BMAL1 pathway” (43). **P < 0.01 and ***P < 0.001 by one-way ANOVA with Dunnett’s multiple comparison test. (E and G) Gene expression normalized to U36b4 measured by quantitative real-time PCR; T, tumors; L, lungs. Data represent means ± SEM. n = 14 and 12 for tumors collected at ZT9 in 12:12LD and CJL, respectively; n = 5 and 6 for tumors collected at ZT21 in 12:12LD and CJL, respectively; and n = 3 to 4 for lung samples. *P < 0.05, **P < 0.01, and ***P < 0.001 by two-way ANOVA post hoc Bonferroni test. (F) GSEA plot for the gene set representing the HSF1-CaSig network applied to samples (lungs + tumors) from CJL versus 12:12LD-housed K mice.
Fig. 5.
Fig. 5.. Time-regulated HSF1 nuclear accumulation and transcriptional activity are perturbed upon CJL exposure.
C57BL/6J mice were housed in 12:12LD or CJL for 8 to 12 weeks. Lung tissues were collected at the indicated times (hours after lights on) on day 1 of the schedule shown in Fig. 1A. (A) Proteins from lung nuclear extracts detected by immunoblot. Each lane on the Western blot represents a sample prepared from a unique animal. Representative images were taken from n = 3 biological replicates. (B) Quantitation of (A). Rhythmicity was determined by JTK_Cycle analyses. ***PJTKCycle < 0.001. (C) Gene expression normalized to U36b4 measured by quantitative real-time PCR. Data represent means ± SEM for three males and three females per time point and light condition. Rhythmicity was determined by JTK_Cycle analyses. *PJTKcycle < 0.05, ***PJTKcycle < 0.001, and ****PJTKcycle < 0.0001.
Fig. 6.
Fig. 6.. Activation of HSF1 signaling plays a role in human KRAS-mutant LUAD cell growth.
(A) Representative images of crystal violet stained colonies formed by A-427 or SK-LU-1 cells treated with DTHIB or vehicle dimethyl sulfoxide (DMSO) 2 days after seeding, for 14 days. (B) Quantification of (A) from three biological replicates. Each condition was compared to controls that were plated in wells on the same plates. Bars represent means ± SD. *P < 0.05, **P < 0.01 by Student’s t test. (C) Proliferation of A-427 and SK-LU-1 cells treated with DTHIB or vehicle DMSO from day 4 after seeding. Representative of three independent biological replicates. (D) Representative images of crystal violet stained colonies formed by A-427 or SK-LU-1 cells upon genetic (shRNA) inhibition of HSF1. (E) Quantification of (D) from three biological replicates. Each condition was compared to shScramble controls that were plated in wells on the same plates. Bars represent means ± SD. ****P < 0.0001 by one-way ANOVA post hoc Bonferroni test. (F) Proliferation of A-427 and SK-LU-1 cells upon genetic (shRNA) inhibition of HSF1. Representative of three independent biological replicates.

References

    1. N. O. H. S. (NHIS-OHS, 2015); wwwn.cdc.gov/Niosh-whc/chart/ohs-workorg?OU=WORKSCHD_RCD&T=I&V=R2.
    1. Pariollaud M., Lamia K. A., Cancer in the fourth dimension: What is the impact of circadian disruption? Cancer Discov. 10, 1455–1464 (2020). - PMC - PubMed
    1. Papagiannakopoulos T., Bauer M. R., Davidson S. M., Heimann M., Subbaraj L., Bhutkar A., Bartlebaugh J., Vander Heiden M. G., Jacks T., Circadian rhythm disruption promotes lung tumorigenesis. Cell Metab. 24, 324–331 (2016). - PMC - PubMed
    1. Gu F., Xu S., Devesa S. S., Zhang F., Klerman E. B., Graubard B. I., Caporaso N. E., Longitude position in a time zone and cancer risk in the United States. Cancer Epidemiol. Biomarkers Prev. 26, 1306–1311 (2017). - PMC - PubMed
    1. Ye Y., Xiang Y., Ozguc F. M., Kim Y., Liu C.-J., Park P. K., Hu Q., Diao L., Lou Y., Lin C., Guo A.-Y., Zhou B., Wang L., Chen Z., Takahashi J. S., Mills G. B., Yoo S.-H., Han L., The genomic landscape and pharmacogenomic interactions of clock genes in cancer chronotherapy. Cell Syst 6, 314–328.e2 (2018). - PMC - PubMed