. 2022 Sep 27;40(13):111438.
doi: 10.1016/j.celrep.2022.111438.

Cortical mechanisms of visual brightness

Affiliations

Cortical mechanisms of visual brightness

Reece Mazade et al. Cell Rep. .

Abstract

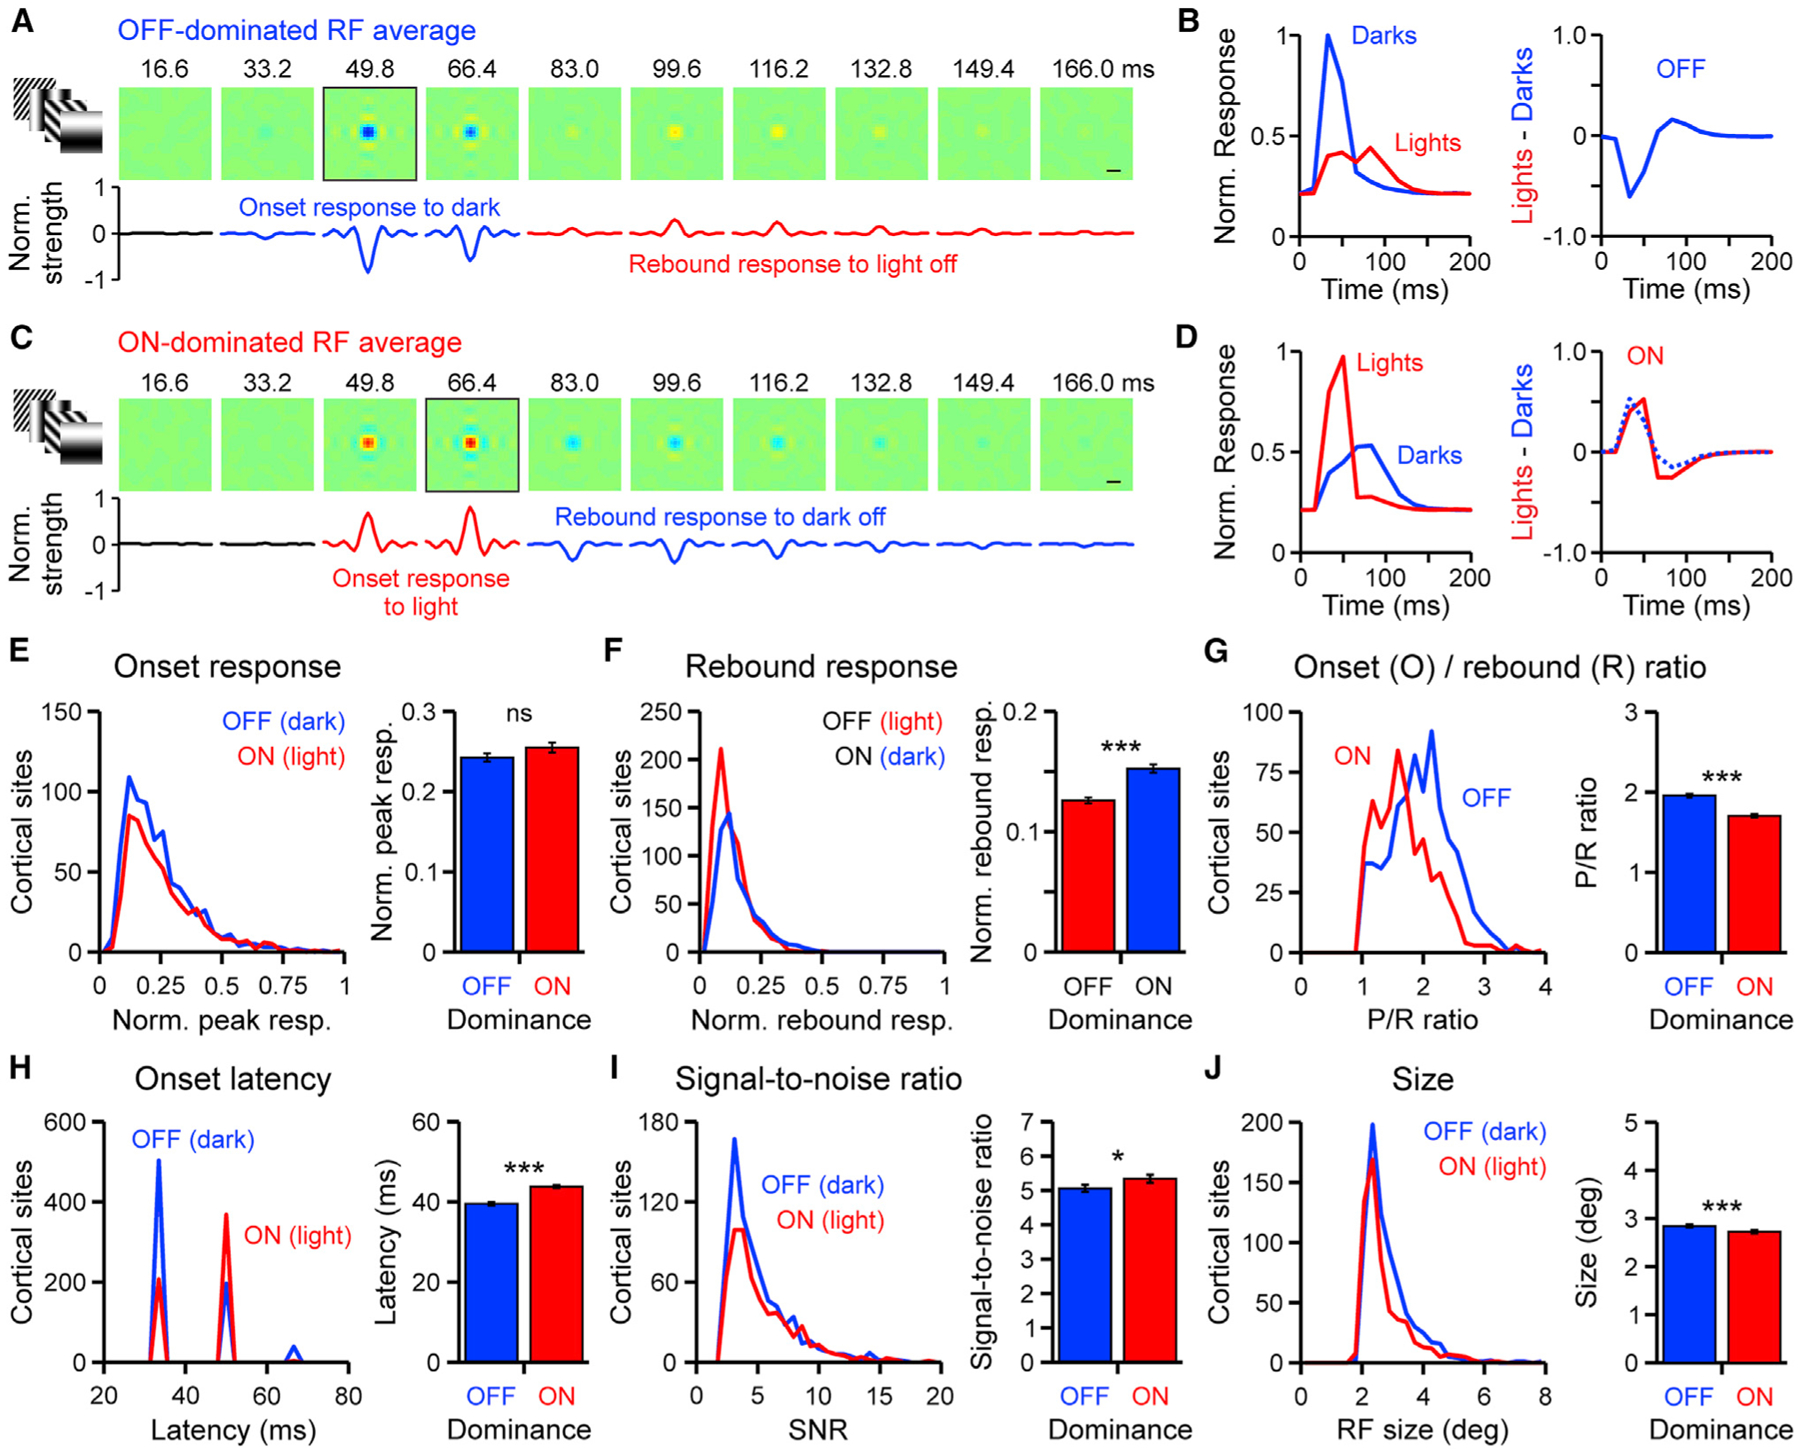
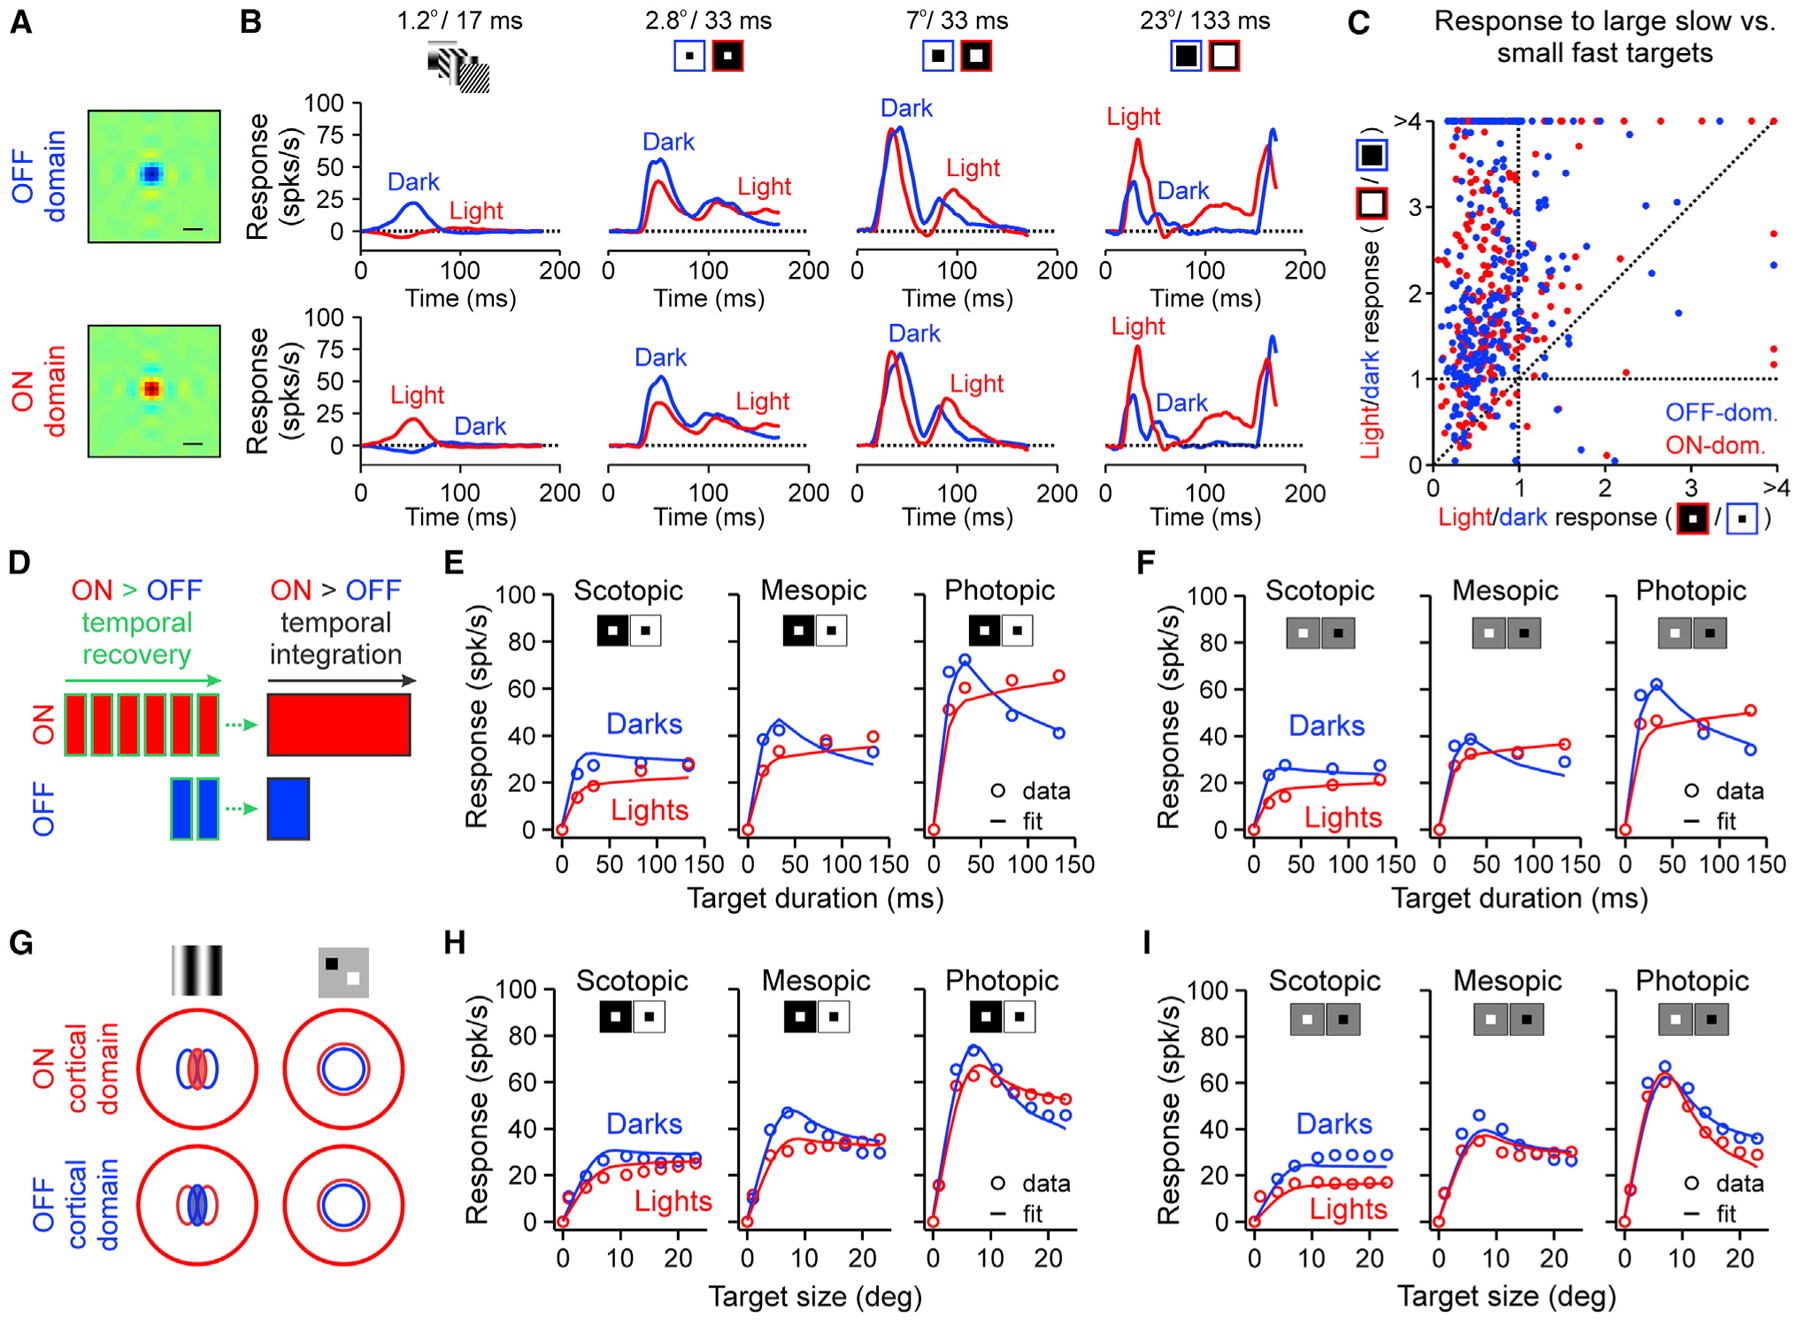
The primary visual cortex signals the onset of light and dark stimuli with ON and OFF cortical pathways. Here, we demonstrate that both pathways generate similar response increments to large homogeneous surfaces and their response average increases with surface brightness. We show that, in cat visual cortex, response dominance from ON or OFF pathways is bimodally distributed when stimuli are smaller than one receptive field center but unimodally distributed when they are larger. Moreover, whereas small bright stimuli drive opposite responses from ON and OFF pathways (increased versus suppressed activity), large bright surfaces drive similar response increments. We show that this size-brightness relation emerges because strong illumination increases the size of light surfaces in nature and both ON and OFF cortical neurons receive input from ON thalamic pathways. We conclude that visual scenes are perceived as brighter when the average response increments from ON and OFF cortical pathways become stronger.

Keywords: CP: Neuroscience; LGN; area V1; luminance contrast; natural images; perception; receptive field; retina; striate cortex; thalamus; visual cortex.


Conflict of interest statement

Declaration of interests The authors declare no competing interests.

Figures

Figure 1.
Figure 1.. ON-OFF receptive field dominance changes with the spatial structure of the stimulus
(A) Contrast polarity histogram of cortical responses to gratings. Contrast polarity (CP) was calculated as (ON − OFF)/(ON + OFF), where ON and OFF are maximum responses to light and dark stimuli, respectively. Positive values indicate ON dominance (red, n = 578) and negative values OFF dominance (blue, n = 741). n: number of cortical sites, p: probability that the distribution is not bimodal (Hartigan dip test). (B–D) Same as in (A) but for white noise (B, n = 747/564 for OFF/ON), surfaces (C, n = 465/386 for OFF/ON, 7° surfaces), and sparse noise (D, n = 944/262 for OFF/ON, 2.8° targets). (E) Single cortical sites (top) and averages (bottom) of OFF- and ON-dominated peri-stimulus time histograms (PSTHs) measured with light (red) and dark (blue) grating phases. (F–H) Same as in (E) but for white noise (F), surfaces (G), and sparse noise (H). Notice that gratings and white noise produce bimodal distributions for contrast polarity and PSTHs with opposite responses, whereas surfaces and sparse noise do not. See also Figure S1.
Figure 2.
Figure 2.. ON and OFF cortical neurons have different spatiotemporal properties
(A) Average OFF-dominated receptive field (n = 741) with onset response to the dark grating phase turned on (blue) followed by rebound response to the light grating phase turned off (red). Line plots below show the normalized receptive field strength through the center of the receptive field. Scale bar: 2° (B) Average normalized response to dark and light stimuli (left) and light-dark difference (right) in OFF cortical domains (blue). (C and D) Same as in (A) and (B) but for average ON-dominated receptive field (n = 578). The dotted blue line is the inverted OFF response from (B) normalized to match the baseline and maximum of the ON response. (E) Distribution of onset responses (left) and averages (right) for ON (red) and OFF (blue) cortical sites. (F) Same as in (A) but for the rebound response (ON: rebound to dark turned off; OFF: rebound to light turned off). (G) Same as in (A) but for the onset (O)/rebound (R) ratios. (H–J) Same as in (A) but for receptive field onset latency (H), signal-to-noise ratio (I), and size (J). The sharp peaks in the latency histogram correspond to the temporal bins (stimulus update) used to calculate the receptive fields. Error bars are SEM; ns: not significant. *p < 0.05, ***p < 0.001, Wilcoxon rank-sum test in all panels. See also Figure S2.
Figure 3.
Figure 3.. ON and OFF cortical neurons have different response time courses
(A) Representative impulse response from an example cortical site calculated as an average from the responses to the 10 preferred gratings. The five preferred gratings that generated the strongest responses are shown below marked by numbers from strongest (1) to weakest (5). (B) Distribution of onset responses (left) and average (right) from ON (red, n = 578) and OFF (blue, n = 741) cortical sites. (C) Same as in (B) but for suppression to preferred stimulus. (D) Representative impulse response from an example cortical site calculated as an average from the responses to the 10 non-preferred gratings. The five non-preferred gratings that generated the strongest suppression are shown below marked by numbers from strongest (1) to weakest (5). (E and F) Same as in (B) and (C) but for suppression (E) and rebound response to non-preferred stimulus (F, OFF: rebound response to light off, ON: rebound response to dark off). (G) Impulse responses illustrating the measurements of response latency and duration. (H–L) Same as in (B) but for response latency to preferred stimulus (H), suppression latency to non-preferred stimulus (I), response duration to preferred stimulus (J), suppression duration to non-preferred stimulus (K), and signal-to-noise ratio (SNR) of response to preferred stimulus (L). Error bars are SEM; ns: not significant, *p < 0.05, ***p < 0.001, Wilcoxon rank-sum test in all panels.
Figure 4.
Figure 4.. Increasing retinal illumination makes cortical responses stronger, faster, and shorter
(A) Responses from an OFF-dominated cortical site to preferred (dark, blue) and non-preferred gratings (light, red) measured at multiple stimulus luminances (rows). (B) Same as in (A), but for an ON-dominated cortical site. (C) Average response strength to preferred gratings for OFF- (blue, n = 110) and ON-dominated (red, n = 88) cortical sites. A linear fit (not shown) can approximate the change in response strength with luminance (R2 and p values in magenta). (D–J) Same as in (C) but for suppression to non-preferred stimulus (D), suppression to preferred stimulus (E), ratio between response to preferred stimuli (R) and suppression (S) to non-preferred stimuli (F), response latency to preferred stimulus (G), suppression latency to non-preferred stimulus (H), response duration to preferred stimulus (I), and suppression duration to non-preferred stimulus (J). Error bars are SEM; *p < 0.05, ** p< 0.01, ***p < 0.001, Wilcoxon rank-sum test in all panels. See also Figure S3.
Figure 5.
Figure 5.. ON and OFF cortical domains respond similarly to surfaces
(A) Left four panels: size suppression histograms from OFF (top, n = 259) and ON cortical domains (bottom, n = 224) driven by dark (blue) and light (red) surfaces presented for different durations (16–133 ms) at maximum monitor contrast (light background for dark surfaces and dark background for light surfaces). Right panel: average size suppression for dark and light surfaces presented for 133 ms in OFF and ON domains. (B) Same as in (A) but for OFF (n = 190) and ON cortical domains (n = 131) stimulated with dark and light surfaces presented at half monitor contrast (midgray background). (C and D) Same as in (A) and (B) but for temporal suppression from dark and light surface stimuli presented with different sizes (4°–23°). Error bars are SEM; p values obtained with Wilcoxon rank-sum test in all panels. See also Figures S4 and S5.
Figure 6.
Figure 6.. Modeling the stimulus preferences from ON and OFF cortical neurons
(A) Average receptive fields from OFF (top, blue, n = 238) and ON (bottom, red, n = 207) cortical neurons. Scale bar: 2°. (B) Average impulse responses from the same OFF (top) and ON neurons (bottom) measured with dark (blue) and light (red) gratings, sparse noise (2.8°/33 ms), small fast surfaces (7°/33 ms), and large slow surfaces (23°/133 ms). (C) Scatterplot showing the light/dark response ratio from ON and OFF neurons for large slow and small fast surfaces (n = 478). (D) Cartoon illustrating simulated temporal differences between ON and OFF pathways (ON pathways can sustain longer responses but take longer to recover). (E) Average stimulus duration tuning in response to dark (blue, n = 239) and light (red, n = 338) surfaces (average of all surface sizes) measured on maximum contrast backgrounds under scotopic, mesopic, and photopic illumination and fit with an ON-OFF model (see STAR Methods). (F) Same as in (E) but for stimulus duration tuning in response to dark (n = 187) and light surfaces (n = 185) measured on midgray backgrounds. (G) Cartoon illustrating the difference between ON and OFF spatial integration for grating stimuli and the similarity in ON and OFF spatial integration for surfaces. Notice that receptive field centers measured with sparse noise are slightly larger for light than dark stimuli due to neuronal blur (Kremkow et al., 2014). (H and I) Same as in (E) and (F) but for average stimulus size tuning (average of all surface durations) fit with an ON-OFF model measured with maximum contrast (H, dark: n = 309, light: n = 330) and midgray backgrounds (I, dark: n = 186, light: n = 185). Luminance data are adapted from Mazade et al. (2019). See also Figure S6.
Figure 7.
Figure 7.. Cortical processing of visual brightness
For a Figure360 author presentation of Figure 7, see https://doi.org/10.1016/j.celrep.2022.111438. (A) Average cortical response from ON and OFF neurons to light (red, n = 304) or dark stimuli (blue, n = 325) of 2.8° and 33 ms measured under different luminance ranges (maximum minus minimum luminance in the display). (B) Same as in (A) but for large surfaces of 23° and 133-ms duration (light: n = 306, dark: n = 218). (C) Color plots showing the average cortical response to the onset of light (n = 304) and dark stimuli (n = 297) with different sizes (y axis) and luminance ranges (x axis) presented for 33 (left) and 133 ms (right). Blue: stronger responses to darks than lights. Red: stronger responses to lights than darks. (D) Example natural images with high (top) and low brightness (bottom) passed through separate ON and OFF luminance/response functions (LRFs) and split into an image of darks (darkest pixels, blue) and an image of lights (brightest pixels, red). (E) Left: scatterplot illustrating the size of the largest continuous dark and light regions of 1,314 images plotted against the mean brightness. Right: the same data binned into 10% mean luminance increments (open circles) and fit with NakaRushton functions (solid lines) (see STAR Methods). (F) Individual luminance adjustment curves from a checkerboard brightness matching task performed by six subjects. Positive values indicate an increase in adjusted luminance to make a stimulus perceived as dim to appear as bright as the reference stimulus. Negative values indicate a reduction in adjusted luminance. Pink shading illustrates square sizes stimulating foveal receptive fields (centers + flanks). Blue shading illustrates square sizes stimulating the suppressive surrounds. (G) Average luminance adjustment across all six subjects as a function of check size. Error bars are SEM in all panels, ***p < 0.001, all p values calculated with Wilcoxon rank-sum test. See also Figure S7.

References

    1. Alonso JM, Usrey WM, and Reid RC (2001). Rules of connectivity between geniculate cells and simple cells in cat primary visual cortex. J. Neurosci 21, 4002–4015. - PMC - PubMed
    1. Bloomfield SA, and Volgyi B (2009). The diverse functional roles and regulation of neuronal gap junctions in the retina. Nat. Rev. Neurosci 10, 495–506. 10.1038/nrn2636. - DOI - PMC - PubMed
    1. Brainard DH (1997). The psychophysics toolbox. Spat. Vis 10, 433–436. - PubMed
    1. Chapman B, Zahs KR, and Stryker MP (1991). Relation of cortical cell orientation selectivity to alignment of receptive fields of the geniculocortical afferents that arborize within a single orientation column in ferret visual cortex. J. Neurosci 11, 1347–1358. - PMC - PubMed
    1. Chichilnisky EJ, and Kalmar RS (2002). Functional asymmetries in ON and OFF ganglion cells of primate retina. J. Neurosci 22, 2737–2747. - PMC - PubMed

Publication types

LinkOut - more resources