. 2022 Sep 27;40(13):111417.
doi: 10.1016/j.celrep.2022.111417.

Fasting-mimicking diet cycles reduce neuroinflammation to attenuate cognitive decline in Alzheimer's models

Affiliations

Fasting-mimicking diet cycles reduce neuroinflammation to attenuate cognitive decline in Alzheimer's models

Priya Rangan et al. Cell Rep. .

Abstract

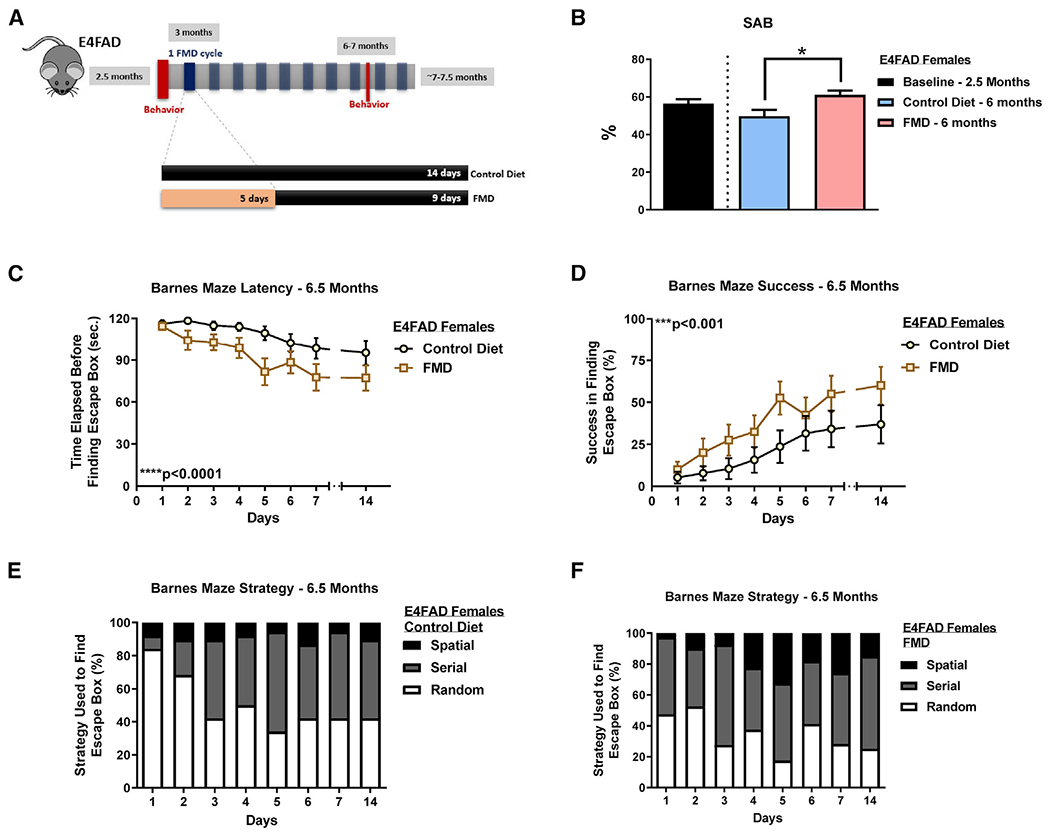
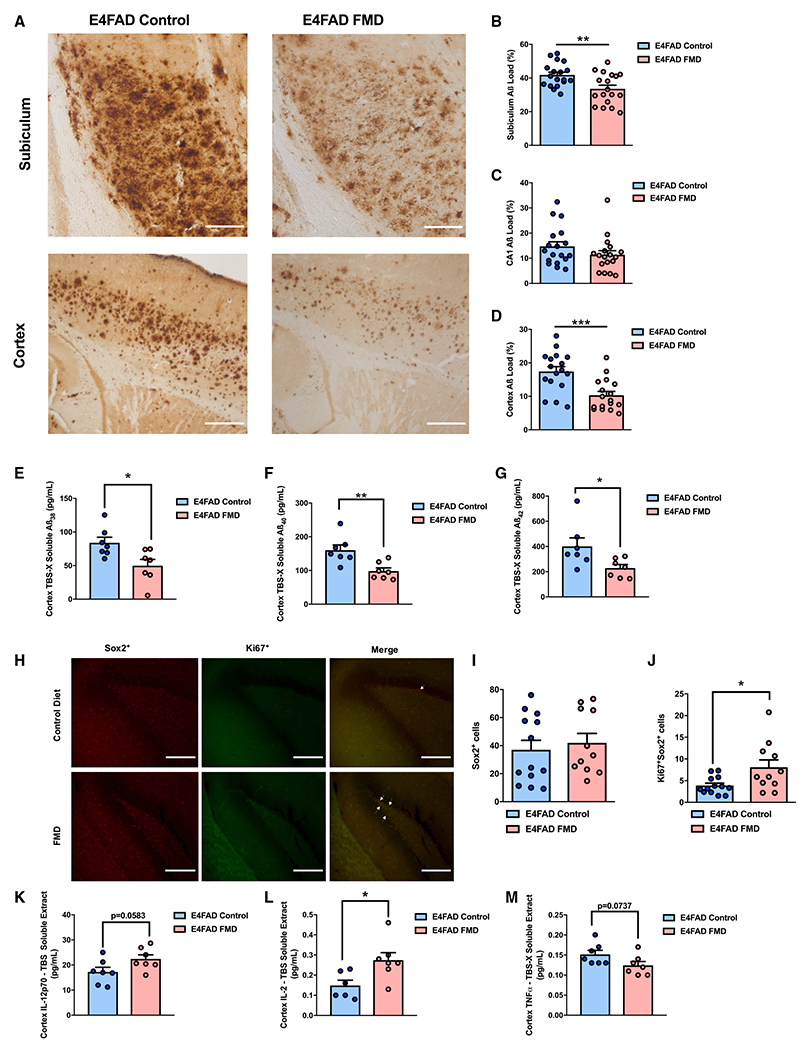
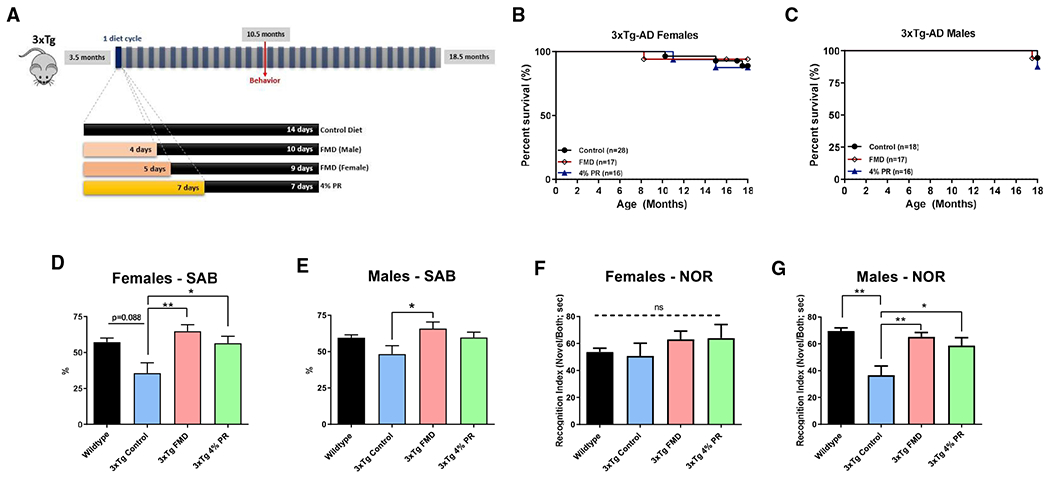
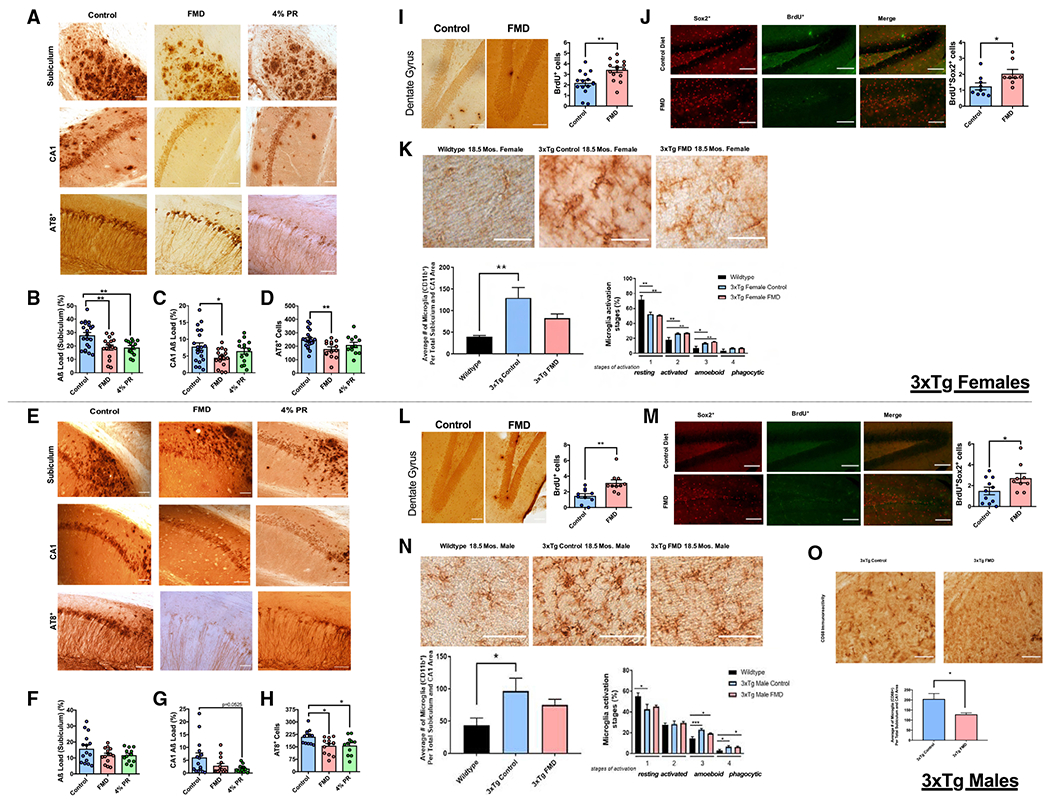
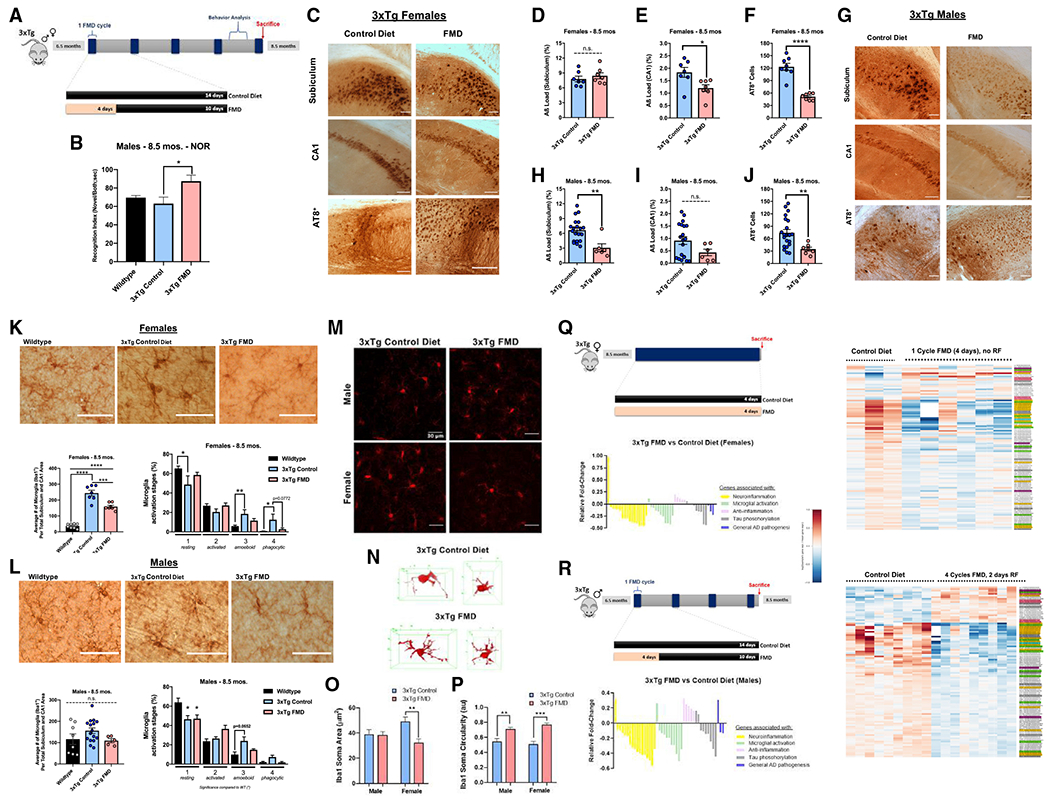
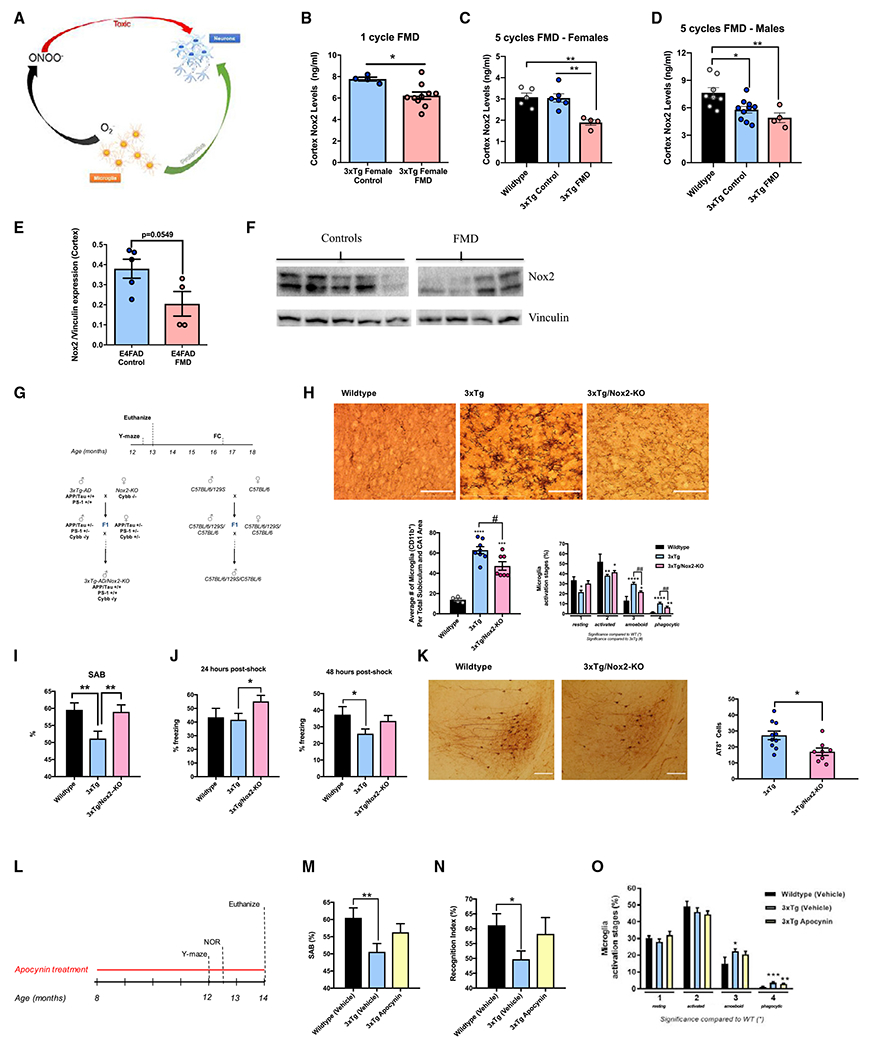
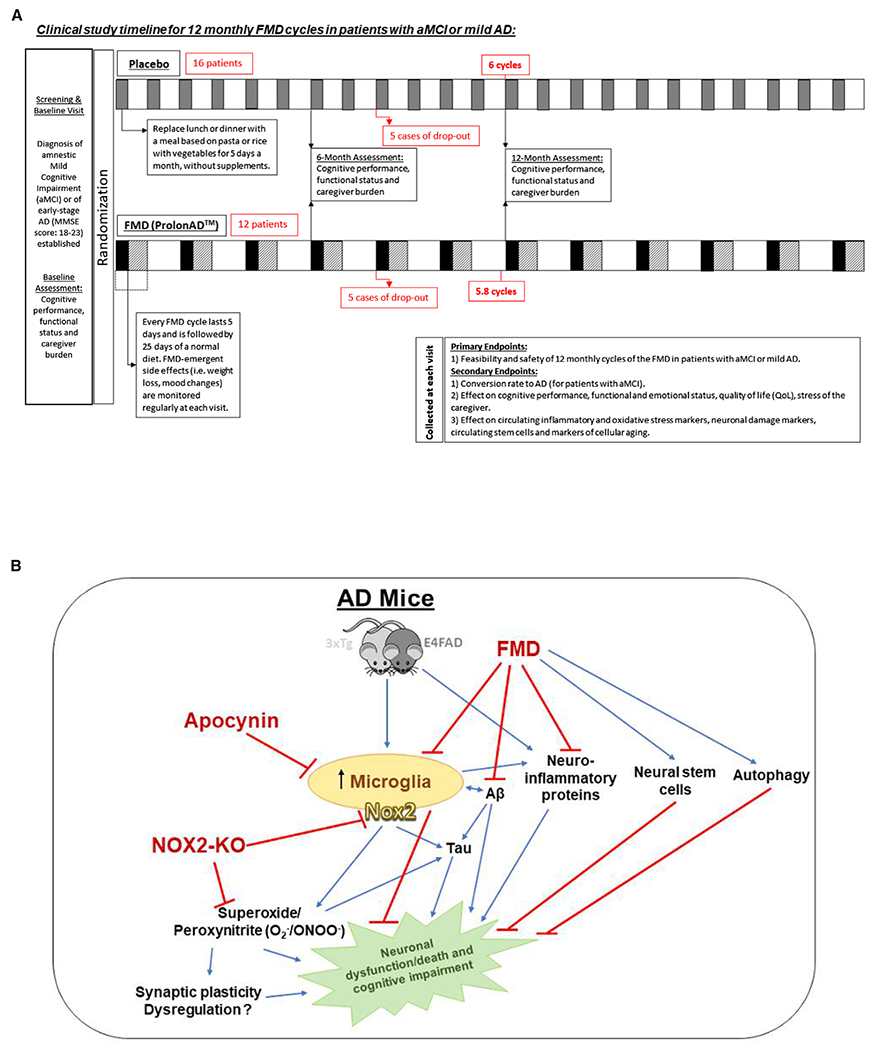
The effects of fasting-mimicking diet (FMD) cycles in reducing many aging and disease risk factors indicate it could affect Alzheimer's disease (AD). Here, we show that FMD cycles reduce cognitive decline and AD pathology in E4FAD and 3xTg AD mouse models, with effects superior to those caused by protein restriction cycles. In 3xTg mice, long-term FMD cycles reduce hippocampal Aβ load and hyperphosphorylated tau, enhance genesis of neural stem cells, decrease microglia number, and reduce expression of neuroinflammatory genes, including superoxide-generating NADPH oxidase (Nox2). 3xTg mice lacking Nox2 or mice treated with the NADPH oxidase inhibitor apocynin also display improved cognition and reduced microglia activation compared with controls. Clinical data indicate that FMD cycles are feasible and generally safe in a small group of AD patients. These results indicate that FMD cycles delay cognitive decline in AD models in part by reducing neuroinflammation and/or superoxide production in the brain.

Trial registration: ClinicalTrials.gov NCT05480358.

Keywords: Alzheimer’s disease; CP: Metabolism; CP: Neuroscience; NADPH oxidase; amyloid beta; fasting; fasting-mimicking diet; hyperphosphorylated tau; microglia; neuroinflammation; protein restriction; superoxide.


Conflict of interest statement

Declaration of interests V.D.L. has equity interest in L-Nutra, which develops and sells medical food for the prevention and treatment of diseases. A patent on this work has been filed by the University of Southern California, which has equity interest in L-Nutra (Fasting-mimicking Diet (FMD) as an Intervention for Alzheimer’s Disease (AD), US 62/840,762, Filed Apr 15, 2019).

Figures

Figure 1.
Figure 1.. FMD cycles improve cognitive behavior in female E4FAD mice
(A) Experimental diet and behavior schedule for female E4FAD mice starting at 2.5 months of age through 7–7.5 months of age. (B) SAB percentage for E4FAD females at baseline (2.5 months) and at 6 or 6.5 months after ~3 months of diet (baseline, n = 19; control, 6 months, n = 9; FMD, 6 months, n = 11). (C) Latency (seconds lapsed before finding escape box) between E4FAD FMD females (n = 20) and E4FAD females on control diet (n = 19) in the Barnes maze at approximately 6.5–7 months. (D) Success rate in finding the escape box between E4FAD FMD females (n = 20) and E4FAD females on control diet (n = 19) in the Barnes maze at approximately 6.5–7 months. (E) Strategies (random, serial, and spatial) used by female E4FAD control group (n = 19) to locate escape box. (F) Strategies (random, serial, and spatial) used by female E4FAD FMD group (n = 20) to locate escape box. Data are presented as mean ± SEM. *p < 0.05, **p < 0.01, and ****p < 0.0001, unpaired two-tailed student’s t test (SAB). Two-way ANOVA (Barnes maze).
Figure 2.
Figure 2.. FMD cycles reduce hippocampal and cortex Aβ load, Aβ peptides, and neuroinflammatory cytokines, while increasing hippocampal neurogenesis markers in E4FAD mice
(A) Representative images showing Aβ immunoreactivity in subiculum and cortical regions of female E4FAD control and FMD groups. (B) Quantification of subiculum Aβ load (%) for female E4FAD control (n = 18) and FMD (n = 18) groups. (C) Quantification of CA1 Aβ load (%) for female E4FAD control (n = 18) and FMD (n = 18) groups. (D) Quantification of cortex Aβ load (%) for female E4FAD control (n = 17) and FMD (n = 17) groups. (E) Quantification of triton-soluble Aβ38 for female E4FAD control (n = 7) and FMD (n = 7) groups. (F) Quantification of triton-soluble Aβ40 for female E4FAD control (n = 7) and FMD (n = 7) groups. (G) Quantification of triton-soluble Aβ42 for female E4FAD control (n = 7) and FMD (n = 7) groups. (H) Representative images showing Sox2+, Ki67+, and co-stain hippocampal immunohistochemistry for ~7–7.5-month-old female E4FAD control and FMD groups. White arrows indicate the Ki67+/Sox2+ foci. (I) Quantification of ~7–7.5-month-old E4FAD female Sox2+ (control [n = 13] and FMD [n = 11]) cells in the dentate gyrus (DG) after ~4 months of FMD cycles. (J) Quantification of ~7–7.5-month-old E4FAD female Ki67+Sox2+ (control [n = 13] and FMD [n = 11]) cells in the DG after ~4 months of FMD cycles. (K) Quantification of IL-2p70 in TBS-soluble cortex extract in control (n = 7) and FMD (n = 7) ~7–7.5-month-old female E4FAD mice. (L) Quantification of IL-2 in TBS-soluble cortex extract in control (n = 6) and FMD (n = 7) ~7–7.5-month-old female E4FAD mice. (M) Quantification of TNFα in detergent-soluble/triton-soluble cortex extract in control (n = 7) and FMD (n = 7) ~7–7.5-month-old female E4FAD mice. Data are presented as mean ± SEM. *p < 0.05, **p < 0.01, and ***p < 0.001, unpaired two-tailed Student’s t test. Images were taken at 20× magnification. Scale bar, 100 μm.
Figure 3.
Figure 3.. FMD cycles improve cognitive behavior in 3xTg mice
(A) Experimental diet and behavior schedule for 3xTg males and females starting at 3.5 months of age through 18.5 months of age. (B) Kaplan-Meier survival curves for 3xTg females in control (n = 25/28), FMD (n = 16/17), and 4% PR (n = 14/16). (C) Kaplan-Meier survival curves for 3xTg males in control (n = 17/18), FMD (n = 16/17), and 4% PR (n = 14/16) groups. (D) SAB score (%) for 8.5-month-old C57B/6 WT females (n = 8), 10.5-month-old 3xTg female control (n = 14), FMD (n = 14), and 4% PR (n = 16) groups. (E) SAB score (%) for 8.5-month-old C57B/6 WT males (n = 8), 10.5-month-old 3xTg male control (n = 13), FMD (n = 16), and 4% PR (n = 15) groups. (F) Recognition index (RI) scored as a percentage for trial 2 (time in seconds spent exploring novel object versus old object) of NOR task for 8.5-month-old C57B/6 WT females (n = 7), and 10.5-month-old 3xTg female control (n = 14), FMD (n = 13), and 4% PR (n = 13) groups. (G) RI for trial 2 of NOR task for 8.5-month-old C57B/6 WT males (n = 8), and 10.5-month-old 3xTg male control (n = 14), FMD (n = 14), and 4% PR (n = 16) groups. Figures 1B and 1C: n = mice that survived to 18 months of age/total mice enrolled in study for group. Figures 1D–1G: 8.5-month-old C57B/6 WT male and female data shown here are the same data as from Figure 5 and S3 and are shown as a comparison with aging 3xTg mice with or without previous treatment cycles. Data are presented as mean ± SEM. *p < 0.05 and **p < 0.01, one-way ANOVA and Bonferroni post test.
Figure 4.
Figure 4.. FMD cycles slow the progression of AD-associated pathology, increase levels of hippocampal neurogenesis markers, and regulate microglia levels and activation in aged 3xTg mice
(A) Representative images showing Aβ immunoreactivity and AT8-positive neurons (recognizes abnormally phosphorylated tau) in subiculum or CA1 hippocampus regions of female control, FMD, and 4% PR 3xTg mice. (B) Quantification of subiculum Aβ load (%) for female 3xTg control (n = 21), FMD (n = 16), and 4% PR (n = 14) mice. (C) Quantification of CA1 Aβ load (%) for female 3xTg control (n = 20), FMD (n = 16), and 4% PR (n = 14) mice. (D) Quantification of AT8+ neurons in the subiculum and CA1 for female 3xTg control (n = 20), FMD (n = 14), and PR (n = 12) mice. (E) Representative images showing Aβ immunoreactivity and AT8+ neurons in subiculum or CA1 hippocampus regions of male 3xTg control, FMD, and 4% PR mice. (F) Quantification of subiculum Aβ load (%) for male 3xTg control (n = 15), FMD (n = 14), and 4%PR (n = 12) mice. (G) Quantification of CA1 Aβ load (%) for male 3xTg control (n = 15), FMD (n = 14), and 4%PR (n = 12) mice. (H) Quantification of AT8+ neurons in the subiculum and CA1 for male 3xTg control (n = 12), FMD (n = 13), and 4%PR (n = 11) mice. (I) Representative images showing BrdU+ DAB-immunohistochemistry in DG of hippocampus for 18.5-month-old female 3xTg control and FMD groups (left). Quantification of BrdU+ cells within the SGZ and inner third of the granule cell layer of the DG for 18.5-month-old female 3xTg control (n = 15) and FMD (n = 15) groups (right). (J) Representative images showing Sox2+, BrdU+, and co-stain hippocampal immunohistochemistry for 18.5-month-old female 3xTg control and FMD groups (left). Quantification of 18.5-month-old 3xTg female BrdU+Sox2+ (control [n = 9] and FMD [n = 8]) cells within the SGZ and inner third of the granule cell layer of the DG after ~15 months of FMD cycles (right). (K) Representative images showing CD11b-ir microglia in hippocampus sections of 18.5-month-old female C57B/6 WT, 3xTg control, and 3xTg FMD mice (top). Quantification of density of CD11b-ir cells in hippocampus CA1 and subiculum combined brain regions of C57B/6 WT, 3xTg control, and 3xTg FMD groups (bottom left; n = 5–7 animals per group). Percentage of different microglia activation stages (from 1 to 4) of C57B/6 WT, 3xTg control, and 3xTg FMD mice (bottom right; n = 5–7 animals per group). (L) Representative images showing BrdU+ DAB-immunohistochemistry in DG of hippocampus for 18.5-month-old male 3xTg control and FMD groups (left). Quantification of BrdU+ cells within the SGZ and inner third of the granule cell layer of the DG for 18.5-month-old male 3xTg control (n = 10) and FMD (n = 10) groups (right). (M) Representative images showing Sox2+, BrdU+, and co-stain hippocampal immunohistochemistry for 18.5-month-old male 3xTg control and FMD groups (left). Quantification of 18.5-month-old 3xTg male BrdU+Sox2+ (control [n = 11] and FMD [n = 9]) cells within the SGZ and inner third of the granule cell layer of the DG after ~15 months of FMD cycles (right). (N) Representative images showing CD11b-ir microglia in hippocampus sections of 18.5-month-old male C57B/6 WT, 3xTg control, and 3xTg FMD mice (top). Quantification of density of CD11b-ir cells in hippocampus CA1 and subiculum combined brain regions of C57B/6 WT, 3xTg control, and 3xTg FMD (bottom left; n = 5–8 animals per group). Percentage of different microglia activation stages (from 1 to 4) of C57B/6 WT, 3xTg control, and 3xTg FMD mice (bottom right; n = 5–8 animals per group). (O) Representative images showing CD68+ microglia in hippocampus sections of 18.5-month-old male 3xTg control and 3xTg FMD mice (top; n = 2–3 animals per group). Quantification of density of CD68+ cells in hippocampus CA1 and subiculum combined brain regions of 3xTg control and 3xTg FMD (bottom; n = 2–3 animals per group. Data are presented as mean ± SEM. (B–D and F–H) *p < 0.05 and **p < 0.01, one-way ANOVA. (I–O) *p < 0.05 and **p < 0.01, unpaired two-tailed Student’s t test. Images were taken at 20× magnification. Scale bar, 100 μm.
Figure 5.
Figure 5.. Short-term treatment with FMD cycles improves memory, mitigates pathology progression, reduces microglia activation, and reduces the expression of neuroinflammation genes, microglial activation, and reduced tau phosphorylation in 3xTg mice
(A) Experimental diet and behavior schedule for 3xTg males and females starting at 6.5 months of age through approximately 8.5 months of age for five FMD cycles. (B) RI for trial 2 of NOR task for 8.5-month-old C57B/6 WT males (n = 8) and 8.5-month-old 3xTg male control (n = 10) and FMD after four cycles of FMD and 7 days of refeeding (n = 5). (C) Representative images showing subiculum and CA1 Aβ immunoreactivity and AT8+ neurons in hippocampus for 8.5-month-old 3xTg female control and FMD groups. (D) Quantification of subiculum Aβ load (%) for 3xTg female control (n = 7) and FMD (n = 7) groups. (E) Quantification of CA1 Aβ load (%) for 3xTg female control (n = 7) and FMD (n = 7) groups. (F) Quantification of AT8+ neurons in the subiculum and CA1 for 3xTg female control (n = 8) and FMD (n = 8) groups. (G) Representative images showing subiculum and CA1 Aβ immunoreactivity and AT8+ neurons in hippocampus for 8.5-month-old 3xTg male control and FMD groups. (H) Quantification of subiculum Aβ load (%) for 3xTg male control (n = 20) and FMD (n = 6) groups. (I) Quantification of CA1 Aβ load (%) for 3xTg male control (n = 20) and FMD (n = 6) groups. (J) Quantification of AT8+ neurons in the subiculum and CA1 for 3xTg male control (n = 21) and FMD (n = 7) groups. (K) Representative images showing Iba1-stained microglia in hippocampus sections of 8.5-month-old female C57B/6 WT and 3xTg control and FMD groups (top). Quantification of density of Iba1+ microglia in the CA1 and subiculum hippocampus regions of C57B/6 WT females (n = 8) and 3xTg female control (n = 7) and FMD (n = 7) groups (bottom left). Percentage of different microglia activation stages (from 1, resting, to 4, most activated) of C57B/6 WT females (n = 8) and 3xTg female control (n = 7) and FMD (n = 7) groups (bottom right). (L) Representative images showing Iba1-stained microglia in hippocampus sections of 8.5-month-old male C57B/6 WT and 3xTg control and FMD groups (top). Quantification of density of Iba1+ microglia in the CA1 and subiculum hippocampus regions of C57B/6 WT males (n = 8) and 3xTg male control (n = 16) and FMD (n = 5) groups (bottom left). Percentage of different microglia activation stages (from 1, resting, to 4, most activated) of C57B/6 WT males (n = 8) and 3xTg male control (n = 16) and FMD (n = 5) groups (bottom right). (M) Representative images of confocal stack immune reactive for Iba1 microglia (red) in the prefrontal cortex for male and female 3xTg control diet and FMD cohorts. Scale bars, 100 μm. (N) Example 3D skeletonized microglial projections for 3xTg control diet and 3xTg FMD cohorts. (O and P) Quantification of Iba1 immuno-reactive soma area (O) and circularity (P) in male (M) and female (F) 3×Tg mice with control diet (open bars) and FMD (filled bars) from high-magnification images (n = 2/group). (Q) Experimental timeline and gene expression (top left and right) in cortex samples of 8.5-month-old female 3xTg controls (n = 3) and 3xTg females after one 4-day cycle of FMD, with no refeeding (n = 6). Yellow-, green-, blue-, rose-, gray-, and lavender-highlighted gene names in heatmap correspond with genes associated with neuroinflammation, microglial activation, neuroinflammation and microglial activation, anti-neuroinflammation, tau phosphorylation, and general association with AD pathogenesis, respectively. Relative fold change (Log2-transformed fold-change values, centered at 0) of gene expression in FMD group versus control diet group (bottom left) for genes associated with neuroinflammation, microglial activation, anti-neuroinflammation, tau phosphorylation, and general association with AD pathogenesis. Values in histogram were calculated from fold change in Table S1. “0” value is equivalent to no change between FMD group and control diet group. (R) Experimental timeline and gene expression (top left and right) in cortex samples of 8.5-month-old male 3xTg controls (n = 9) and 3xTg males after four cycles of FMD and 2 days of refeeding (n = 9). Yellow-, green-, blue-, rose-, gray-, and lavender-highlighted gene names in heatmap correspond with genes associated with neuroinflammation, microglial activation, neuroinflammation and microglial activation, anti-neuroinflammation, tau phosphorylation, and general association with AD pathogenesis, respectively. Relative fold change (Log2-transformed fold-change values, centered at 0) of gene expression in FMD group versus control diet group (bottom left) for genes associated with neuroinflammation, microglial activation, anti-neuroinflammation, tau phosphorylation, and general association with AD pathogenesis. Values in histogram were calculated from fold change in Table S1. “0” value is equivalent to no change between FMD group and control diet group. Data are presented as mean ± SEM. (B) *p < 0.05, compared with WT; one-way ANOVA followed by Tukey’s multiple comparisons test. (D-F and H-J) *p < 0.05, **p < 0.01, ****p < 0.0001; unpaired two-tailed student’sttest. (K and L) *p < 0.05, **p < 0.01, ***p < 0.001, and ****p < 0.0001; one-way ANOVA followed by Tukey’s multiple comparisons test. (M-P) Two mice were analyzed per group, n = 20–35 cells per group. **p < 0.01, ***p < 0.001; two-way ANOVA followed by Tukey’s multiple comparisons test. Images were taken at 20× magnification unless otherwise noted. Scale bar, (C, G, K, L) 100 μm and (G) 30 μm. RNA-seq libraries were sequenced 1 × 50 bp on an Illumina HiSeq3000 system
Figure 6.
Figure 6.. Short-term cycles of FMD regulate Nox2 cortex levels in 3xTg and E4FAD mice, while NOX2 deletion or inhibition improves cognitive behavior, mitigates pathology progression, and reduces microglia activation
(A) Diagram describing the dual positive and negative function of microglia. Microglia are involved in neuronal development and repair, but their production of O2 into ONOO can promote toxicity and lead to neurodegeneration. (B) Quantification of Nox2 (ng/mL) in cortex extract of 8.5-month-old female 3xTg controls (n = 4) and 3xTg females after one 4-day cycle of FMD with no refeeding (n = 10). (C) Quantification of Nox2 (ng/mL) in cortex extract of 8.5-month-old female C57B/6 WT (n = 5) and 8.5-month-old 3xTg female control (n = 6) and FMD after five cycles of FMD and no refeeding after last cycle (n = 4) groups. (D) Quantification of Nox2 (ng/mL) in cortex extract of 8.5-month-old male C57B/6 WT (n = 8) and 8.5-month-old 3xTg male control (n = 10) and FMD after five cycles of FMD and no refeeding after last cycle (n = 4) groups. (E) Quantification of Nox2 levels in cortex extract of control (n = 5) and FMD (n = 4) ~7-7.5-month-old female E4FAD mice after 4 months of biweekly FMD cycles (measured as Nox2/Vinculin protein expression levels). (F) Western blot image used for quantifying Nox2 levels in whole-cortex extract of control (n = 5) and FMD (n = 4) ~7- to 7.5-month-old female E4FAD mice. Vinculin was loading control (bottom). (G) 3xTg/Nox2-KO mice generation and experimental design. The experimental design of the tests conducted on 3xTg/Nox2-KO and control mice is depicted, as well as a schematic representation of the breeding strategy used to develop 3xTg/Nox2-KO mice and corresponding WT (mixed background 129/B6/B6). Some mice were euthanized for pathology at 13–14 months, while those used for fear-conditioning (FC) tests were aged until 15–18 months. (H) Representative images showing CD11b-ir microglia in hippocampus sections of 13- to 14-month-old male WT (129/B6 background), 3xTg, and 3xTg/Nox2-KO mice (top). Quantification of density of CD11b-ir cells in hippocampus CA1 and subiculum combined brain regions of WT (129/B6 background), 3xTg, and 3xTg/Nox2-KO (bottom left; n = 4–8 animals per group). Percentage of different microglia activation stages (from 1 to 4) of WT (129/B6 background), 3xTg, and 3xTg/Nox2-KO mice (bottom right; n = 4–8 animals per group). (I) WT (129/B6 background), 3xTg, and 3xTg/Nox2-KO male mice were tested with the Y-maze apparatus (12.5 months of age). SAB scores obtained through Y-maze task are shown (n = 7–23 per group). (J) WT (129/B6 background), 3xTg, and 3xTg/Nox2-KO male mice (15–18 months of age) FC tests. Freezing times (%) 24-h post shock for FC are shown (n = 6–22 per group) (left). WT (129/B6 background), 3xTg, and 3xTg/Nox2-KO male mice (15–18 months of age) underwent FC tests. Freezing times (%) 48-h post shock for FC are shown (n = 6–22 per group) (right). (K) Representative images showing AT8 antibody (recognizes abnormally phosphorylated tau) immunoreactivity in hippocampus of 13- to 14-month-old male 3xTg and 3xTg/Nox2-KO mice (left). Quantification of total AT8-immuno-reactive cells in hippocampus of 13- to 14-month-old male 3xTg and 3xTg/Nox2-KO mice (n = 10–13/group) (right). (L) Experimental design of apocynin treatment. Eight-month-old WT (129/B6 background) and 3xTg mice were treated with apocynin-dissolved drinkable water or apocynin-free water for 6 months. During the final 4 weeks of treatment, the animals were tested using the Y-maze apparatus, and NOR and Rotarod assays. After completion of the behavioral tasks, the mice were euthanized and their brains analyzed. (M) Comparison of SAB scores between WT (129/B6 background) vehicle, 3xTg vehicle, and 3xTg apocynin-treated mice using the Y-maze apparatus (n = 10–13 animals per group). (N) Comparison of RI values between WT (129/B6 background) vehicle, 3xTg vehicle, and 3xTg apocynin- treated mice during NOR test (n = 10–13 animals per group). (O) Percentage of different microglia activation stages (from 1 to 4) of WT (129/B6 background) vehicle, 3xTg vehicle, and 3xTg apocynin-treated mice (n = 5–10 animals/group). Data are presented as mean ± SEM. (H and O) *p < 0.05, **p < 0.01, ***p < 0.001 compared with WT; #p < 0.05, ##p < 0.01 for 3xTg/Nox2-KO versus 3xTg, one-way ANOVA followed by Tukey’s multiple comparisons test (H, bottom left) and Fisher’s least significant difference test (H, bottom right, and O). (B, E, and K) *p < 0.05, unpaired two-tailed student’s t test. (C and D) *p < 0.05, **p < 0.01, ***p < 0.001 compared with WT; one-way ANOVA followed by Tukey’s multiple comparisons test. (I, J, M, and N) *p < 0.05, **p < 0.01, ***p < 0.001; one-way ANOVA followed by Fisher’s least significant difference test. Images were taken at 20× magnification. Scale bar, 100 μm.
Figure 7.
Figure 7.. Safety and feasibility of FMD cycles as a treatment for patients with aMCI or mild AD
(A) A phase I/II randomized and placebo-controlled (single-blind) clinical study for 40 patients with aMCI or mild AD was designed for 12 monthly FMD cycles; 28/40 enrolled patients were randomly assigned to a placebo (control) diet arm (n = 16) or an FMD (ProLonAD) arm (n = 12). In the placebo arm, a gray square indicates that, for 5 days a month, patients are assigned a diet in which lunch or dinner is replaced with a meal based on pasta or rice with vegetables, without added supplements. In the FMD arm, a black square indicates a 5-day FMD cycle, followed by a striped box that indicates 25 days of a normal diet. White box indicates an in-between period between FMD cycles. Primary and secondary endpoints collected at each visit (per FMD cycles completed) is described in lower right-hand corner. (B) Graphical representation of the effects of FMD on the E4FAD and the 3xTg mouse models of AD, through which it mediates AD-associated pathology, neuroinflammation, NSCs, and Nox2 levels.

References

    1. ‘t Hart BA, Copray S, and Philippens I (2014). Apocynin, a low molecular oral treatment for neurodegenerative disease. BioMed Res. Int, 298020. - PMC - PubMed
    1. Abels ER, Maas SLN, Nieland L, Wei Z, Cheah PS, Tai E, Kolsteeg CJ, Dusoswa SA, Ting DT, Hickman S, et al. (2019). Glioblastoma-associated microglia reprogramming is mediated by functional transfer of extracellular miR-21. Cell Rep. 28, 3105–3119.e7. - PMC - PubMed
    1. Alves S, Churlaud G, Audrain M, Michaelsen-Preusse K, Fol R, Souchet B, Braudeau J, Korte M, Klatzmann D, and Cartier N (2017). Interleukin-2 improves amyloid pathology, synaptic failure and memory in Alzheimer’s disease mice. Brain 140, 826–842. - PubMed
    1. Anders S, Pyl PT, and Huber W (2015). HTSeq–a Python framework to work with high-throughput sequencing data. Bioinformatics 31, 166–169. - PMC - PubMed
    1. Anderson AJ, Cummings BJ, and Cotman CW (1994). Increased immunoreactivity for Jun- and Fos-related proteins in Alzheimer’s disease: association with pathology. Exp. Neurol 125, 286–295. - PubMed

Publication types

Associated data