. 2022 Sep 27;40(13):111412.
doi: 10.1016/j.celrep.2022.111412.

A nuclear cAMP microdomain suppresses tumor growth by Hippo pathway inactivation

Affiliations

A nuclear cAMP microdomain suppresses tumor growth by Hippo pathway inactivation

Marek M Drozdz et al. Cell Rep. .

Abstract

Cyclic AMP (cAMP) signaling is localized to multiple spatially distinct microdomains, but the role of cAMP microdomains in cancer cell biology is poorly understood. Here, we present a tunable genetic system that allows us to activate cAMP signaling in specific microdomains. We uncover a nuclear cAMP microdomain that activates a tumor-suppressive pathway in a broad range of cancers by inhibiting YAP, a key effector protein of the Hippo pathway, inside the nucleus. We show that nuclear cAMP induces a LATS-dependent pathway leading to phosphorylation of nuclear YAP solely at serine 397 and export of YAP from the nucleus with no change in YAP protein stability. Thus, nuclear cAMP inhibition of nuclear YAP is distinct from other known mechanisms of Hippo regulation. Pharmacologic targeting of specific cAMP microdomains remains an untapped therapeutic approach for cancer; thus, drugs directed at the nuclear cAMP microdomain may provide avenues for the treatment of cancer.

Keywords: CP: Molecular biology; Hippo pathway; PKA; YAP; cAMP; nucleus; sAC; tumor suppression.


Conflict of interest statement

Declaration of interests J.H.Z. is a paid consultant and is on the medical advisory board of Hoth Therapeutics, is on the medical advisory board of SHADE, Inc., and is an inventor on US patent 8859213 on the use of antibodies directed against sACs for the diagnosis of melanocytic proliferations. O.E. is a cofounder and equity holder in Volastra Therapeutics and OneThree Biotech, an equity holder and SAB member in Owkin, Freenome, Genetic Intelligence, and Acuamark DX, and receives funding from Eli Lilly, Janssen, and Sanofi. T.M. is consultant for Leap Therapeutics, Immunos Therapeutics, and Pfizer, is a cofounder of Imvaq Therapeutics, has equity in Imvaq Therapeutics, reports grants from Bristol-Myers Squibb, Surface Oncology, Kyn Therapeutics, Infinity Pharmaceuticals, Peregrine Pharmeceuticals, Adaptive Biotechnologies, Leap Therapeutics, and Aprea, and is an inventor on patent applications related to work on oncolytic viral therapy, alphavirus-based vaccines, neo-antigen modeling, CD40, GITR, OX40, PD-1, and CTLA-4.

Figures
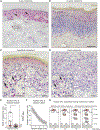
Figure 1.
Figure 1.. A nuclear cAMP microdomain is lost upon melanoma invasion
(A) Subcellular sAC localization in in situ human melanoma; arrows point to examples of nuclear sAC-positive cells. Scale bar: 50 μm. (B) Loss of nuclear sAC upon deep dermal invasion; black line denotes transition from superficial to deep melanoma component, while red line marks the leading edge of the tumor. Scale bar: 500 μm. (C) Maintenance of nuclear sAC in superficial component of invasive melanoma (indicated by arrows). Scale bars: 25 μm. (D) Loss of nuclear sAC in the deep dermal component of invasive melanoma (indicated by arrows). Scale bars: 50 μm. (E) Correlation between melanoma depth and the presence of nuclear sAC-positive melanocytes. Welch’s t test; **p ≤ 0.01. Box extends from 25th to 75th percentiles, with median indicated inside. Whiskers extend from minimum to maximum value with individual data points shown. n = 34 individual melanoma biopsies. (F) Increasing Breslow depth correlates with loss of nuclear sAC-positive cells in human melanoma. Points represent observed values (%), and solid line represents regression model estimates with 95% confidence interval (CI) as shaded regions. Significance testing (p < 0.001) was performed using likelihood-ratio test. (G) Schematic of nuclear sAC expression during different stages of melanoma invasion. See also Table S1.
Figure 2.
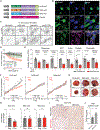
Figure 2.. The nuclear cAMP microdomain suppresses tumor growth in vitro and in vivo
(A) cDNA schematics of sAC cAMP microdomain constructs. NLS, nuclear localization signal; NES, nuclear export signal; mito P1, mitochondrial P1 localization signal; LacZ, beta galactosidase encoding gene; TET on, doxycycline-activated promoter; HA, hemagglutinin tag. (B) Microscopy images of melanoma clones showing targeted localization of sAC as detected with anti-HA antibody (green). DAPI (blue) used to label nuclei. Anticytochrome c antibody (magenta) used to label mitochondria. Scale bar: 10 μm. (C) In vitro colony formation by mouse melanoma cells in Matrigel after 7 days ± doxycycline (DOX; 1 μg/mL). Scale bar: 100 μm. (D) Viability, based on relative ATP, of mouse melanoma colonies as in (C). n = 3 or more biological replicates; error bars, SEM; two-way ANOVA. (E) Viability of cancer cell lines following nuclear sAC expression as in (D). Error bars, SEM; Student’s t test, n = 3 biological replicates. (F) Melanoma tumor growth ± sAC microdomain expression. Switch to DOX containing chow at arrow/red vertical line. Data normalized to day 0 (day when mice changed to DOX containing chow). Reg, regular chow, gray. Dashed lines, SEM; mixed effect ANOVA, with Sidak correction for multiple comparisons. NLS-sAC, n = 15 animals per cohort; NES-sAC and mito-sAC, n = 10 animals per cohort. (G) Gross tumor images from (F). Scale bar: 1 cm. (H) Weight of NLS-sAC, NES-sAC, and mito-sAC tumors from mice fed Reg (Reg, gray bars) or DOX-containing (DOX, red bars) chow. Weight was normalized to regular chow (set to 1). Error bars, SEM; Student’s t test. NLS-sAC Reg, n = 9 animals; NLS-sAC DOX and NES-sAC, n = 10 animals per cohort; mito-sAC n = 5 animals per cohort. (I) Microscopic image of Ki67 immunohistochemistry (IHC) analysis. Scale bar: 100 μm. (J) Quantitation of Ki67-positive nuclei in tumor sections from in vivo experiment represented as a fold change over corresponding control cohort. Mean with data points for individual tumors are shown. NLS-sAC, n = 5 biological replicates, NES-sAC, n = 4 biological replicates. Error bars, SEM; Student’s t test. (ns, p > 0.05; *p ≤ 0.05; **p ≤ 0.01; ***p ≤ 0.001; ****p ≤ 0.0001). See also Figures S1-S3.
Figure 3.
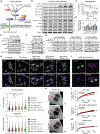
Figure 3.. The nuclear cAMP microdomain alters chromatin accessibility and inhibits pro-tumorigenic gene expression profiles via Hippo pathway
(A) Gene set enrichment analysis (GSEA) of global expression changes in NLS-sAC- (DOX) and NES-sAC- (DOX) versus control-expressing (no DOX) tumors. (B) Overlap of differential chromatin accessibility following NLS-sAC or LacZ expression. (C) Volcano plot of differential chromatin accessibility of DNA elements in NLS-sAC-expressing melanoma cells. (D) Change in transcription factor accessibility remodeling following NLS-sAC expression. The 27 most significant transcription factors (FDR <1 × 10⁻⁵) are reported, with their consensus motif sequence logos indicated on the right. Error bars, 95% CI. (E) GSEA following NLS-sAC expression in mouse melanoma cells in vitro. (F) RT-PCR confirmation of genes with reduced expression identified by RNA-seq in (E). n = 3 biological replicates. Hippo pathway genes labeled as red bars. Represented as DOX/no DOX. Mean values; error bars, SEM. Student’s t test. (*p ≤ 0.05; **p ≤ 0.01; ***p ≤ 0.001; ****p ≤ 0.0001). See also Figures S4-S6.
Figure 4.
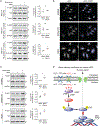
Figure 4.. The nuclear cAMP/PKA/LATS signaling cascade inhibits YAP by inducing S397 phosphorylation and nuclear export
(A) Schematic of canonical Hippo signaling. (B) Western blot analysis of nuclear cAMP induced phosphorylation of LATS1, YAP, and TAZ (n ≥ 3 biological replicates; representative shown). (C) Viability of mouse melanoma colonies in Matrigel following either YAP or TAZ knockdown, assessed by ATP content. (–, red), parental cell line; (shCTRL, black), parental cell line transduced with scrambled shRNA; (shTAZ, blue); (shYAP, green). n ≥ 4 biological replicates; error bars, SEM; two-way ANOVA. (D) NLS-sAC reduces Ctgf and Cyr61 expression in parental lines (–, red) and in cells transduced with scrambled shRNA (shCTRL, gray), as measured by qRT-PCR. Knockdown of YAP (shYAP, green), but not TAZ (shTAZ, blue), abolishes nuclear cAMP effect on the expression of these genes. Expression relative to cells without DOX treatment (n ≥ 4 biological replicates; error bars, SEM; Student’s t test). (E) Phosphorylation of S397 induced by nuclear cAMP does not require S127 phosphorylation (n = 3 biological replicates; representative shown). S127A, FLAG-tagged YAP with S127 mutated to alanine; Endo, endogenous YAP. (F) Fractionation of melanoma cells demonstrates the presence of LATS in both the cytoplasmic (C) and nuclear (N) fractions. Active LATS (phosphorylated on both S909 and T1079) is enriched in the nuclear fraction of cells after NLS-sAC expression (DOX; 24 h). Histone H3 and beta-tubulin markers for nuclear and cytoplasmic fractions, respectively (n = 3 biological replicates; representative shown). (G) Nuclear cAMP-induced phosphorylation of YAP at S397 is abolished by treatment with the sAC inhibitor LRE1, the PKA inhibitor KT5720, and the LATS kinase inhibitor TRULI (n = 3 biological replicates; representative shown). (H) Microscopic images showing loss of nuclear YAP upon NLS-sAC induction and inhibition of YAP nuclear loss by sAC, PKA, and LATS inhibitors (LRE, KT5720, and TRULI, respectively). Scale bar: 20 μm. (I) Microscopic images of YAP (purple) nuclear expression following NLS-sAC expression in the presence or absence of a nucleus-targeted protein kinase A inhibitor (NLS-PKI; green). Scale bar: 20 μm. (J) Quantification of YAP localization represented as nuclear to cytoplasmic ratio (N/C; top panel) following nuclear cAMP induction alone (DOX, 24 h) or in the presence of sAC inhibitor (LRE1), PKA inhibitors (KT5720 and NLS-PKI), or LATS inhibitor (TRULI); total YAP level for all conditions shown (bottom panel). Dashed line within each violin plot, median; dotted lines, quartiles; error bars, SEM; one-way ANOVA with Sidak’s correction for multiple comparisons. n = 3–6 separate experiments. Total cell number per group: 446 untreated; 477 DOX 24 h; 221 DOX 24 h/LRE1 1 h; 252 DOX 24 h/KT5720 1 h; 212 DOX 24 h/TRULI 1 h; and 143 DOX 24 h/NLS-PKI (+). (K) Microscopic image examples of FRAP analysis of EYFP-tagged YAP. Bleached nucleus is marked by an arrowhead. Scale bar: 10 μm. (L) FRAP analysis of EYFP-YAP following NLS-sAC expression in the presence or absence of the nuclear export inhibitor leptomycin B (without leptomycin B: n = 3 separate experiments, 47 nuclei total per group; with leptomycin B: n = 2 separate experiments, 13 nuclei total per group; error bars, SEM; mixed effect ANOVA). (M) FRAP analysis of EYFP-tagged YAP-S397A showing no changes in nuclear YAP recovery after NLS-sAC expression (n = 3 separate experiments, 52 untreated nuclei and 32 DOX-treated nuclei; error bars, SEM; mixed effect ANOVA). (ns, p > 0.05; *p ≤ 0.05; **p ≤ 0.01; ***p ≤ 0.001; ****p ≤ 0.0001). See also Figures S7 and S8.
Figure 5.
Figure 5.. Nuclear sAC inhibits tumor growth in a YAP S397 phosphorylation-dependent manner
(A) Colony growth in Matrigel, assessed by ATP content, of the parental (−) NLS-sAC melanoma line or melanoma cells overexpressing either wild type (WT)-YAP or mutant YAPs (S127A, S397A, or 5SA). n = 6 biological replicates; error bars, SEM; ANOVA. (B) Tumor growth following NLS-sAC induction in WT-YAP-, S397A-YAP-, or 5SA-YAP-expressing melanoma cells. Switch to DOX chow (red) is indicated by the arrow/red line. Reg, regular chow, gray. Error bars, SEM; mixed effect ANOVA, with Sidak’s correction for multiple comparisons; n = 5 animals per cohort, except 5SA-YAP, where n = 4. (ns, p > 0.05; *p ≤ 0.05; **p ≤ 0.01; ***p ≤ 0.001; ****p ≤ 0.0001). See also Figure S9.
Figure 6.
Figure 6.. The endogenous sAC agonist bicarbonate induces YAP S397 phosphorylation in melanoma
(A) Left panel, representative western blots showing YAP S397 phosphorylation in mouse melanoma lines in response to 10 μM IBMX with or without bicarbonate ion (HCO3), an agonist of sAC, for 30 min. Right panel, quantification of P-397 band volumes normalized to total YAP band intensity expressed as the fold change of bicarbonate + IBMX (+,+) relative to IBMX alone (−,+). n ≥ 3 biological replicates. Student’s t test. (B) Microscopy images of endogenous sAC localization in human melanoma cell lines. Scale bar: 10 μm. (C) Left panel, representative western blots showing YAP S397 phosphorylation in human melanoma lines incubated in control media or in the presence of 50 μM IBMX with or without bicarbonate ion (HCO3), an agonist of endogenous sAC, for 30 min. Right panel, quantification of P-397 band volumes normalized to total YAP band intensity expressed as the fold change of bicarbonate + IBMX (+,+) relative to IBMX alone (−,+). n ≥ 3 biological replicates. Student’s t test. (D) Model of Hippo pathway inhibition by nuclear cAMP. (ns, p > 0.05; *p ≤ 0.05; **p ≤ 0.01).
Figure 7.
Figure 7.. Nuclear cAMP- and YAP-dependent signaling are inversely correlated in human melanoma
(A) Heatmaps comparing the relative upregulation and downregulation of genes in hyperactive YAP-expressing MeWo cells (rows) versus NLS-sAC-expressing (columns) in vivo mouse melanoma tumors (left panel) and in vitro mouse melanoma cell lines (right panel). The number of genes observed in each quadrant is indicated. (B) Spearman correlation between inferred NLS-sAC and YAP activities across 45 melanoma cell lines from the Cancer Cell Line Encyclopedia (CCLE). Three approaches were used to derive the activity signatures, sigs. 1–3 (see method details, genomic data analysis section). (C) Heatmap showing Z score-transformed mRNA expression values for melanocytic and neural crest differentiation signature genes (motif 1) and transforming growth factor beta (TGF-β)-like signal signature genes (motif 2), defined by Hoek et al. (2006), in 45 melanoma cell lines (columns). Inferred NLS-sAC and YAP activities in each cell line are indicated at the top.

References

    1. Abbas O, Miller DD, and Bhawan J (2014). Cutaneous malignant melanoma: update on diagnostic and prognostic biomarkers. Am. J. Dermatopathol 36, 363–379. 10.1097/DAD.0b013e31828a2ec5. - DOI - PubMed
    1. Acin-Perez R, Salazar E, Brosel S, Yang H, Schon EA, and Manfredi G (2009a). Modulation of mitochondrial protein phosphorylation by soluble adenylyl cyclase ameliorates cytochrome oxidase defects. EMBO Mol. Med 1, 392–406. 10.1002/emmm.200900046. - DOI - PMC - PubMed
    1. Acin-Perez R, Salazar E, Kamenetsky M, Buck J, Levin LR, and Manfredi G (2009b). Cyclic AMP produced inside mitochondria regulates oxidative phosphorylation. Cell Metab. 9, 265–276. 10.1016/j.cmet.2009.01.012. - DOI - PMC - PubMed
    1. Baljinnyam E, De Lorenzo MS, Xie LH, Iwatsubo M, Chen S, Goydos JS, Nowycky MC, and Iwatsubo K (2010). Exchange protein directly activated by cyclic AMP increases melanoma cell migration by a Ca2+-dependent mechanism. Cancer Res. 70, 5607–5617, Epub 2010 Jun 15. 10.1158/0008-5472.can-10-0056. - DOI - PubMed
    1. Barnhill RL, Busam KJ, and Piepkorn MW (2013). Pathology of Melanocytic Nevi and Melanoma (Springer; ). 10.1007/978-3-642-38385-4. - DOI

Publication types