. 2022 Sep 27;40(13):111404.
doi: 10.1016/j.celrep.2022.111404.

FOXA1 regulates alternative splicing in prostate cancer

Affiliations

FOXA1 regulates alternative splicing in prostate cancer

Marco Del Giudice et al. Cell Rep. .

Abstract

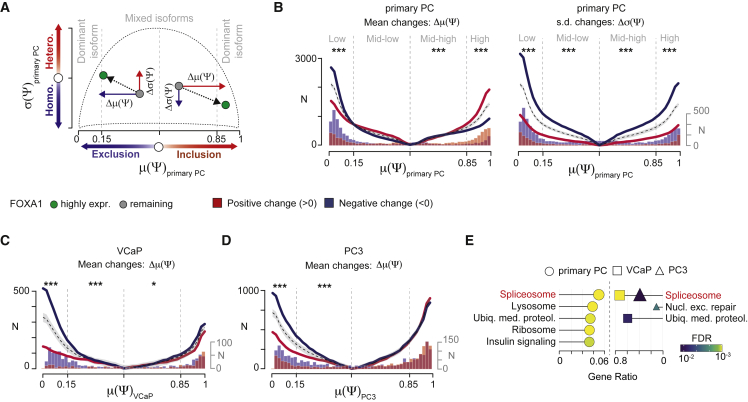
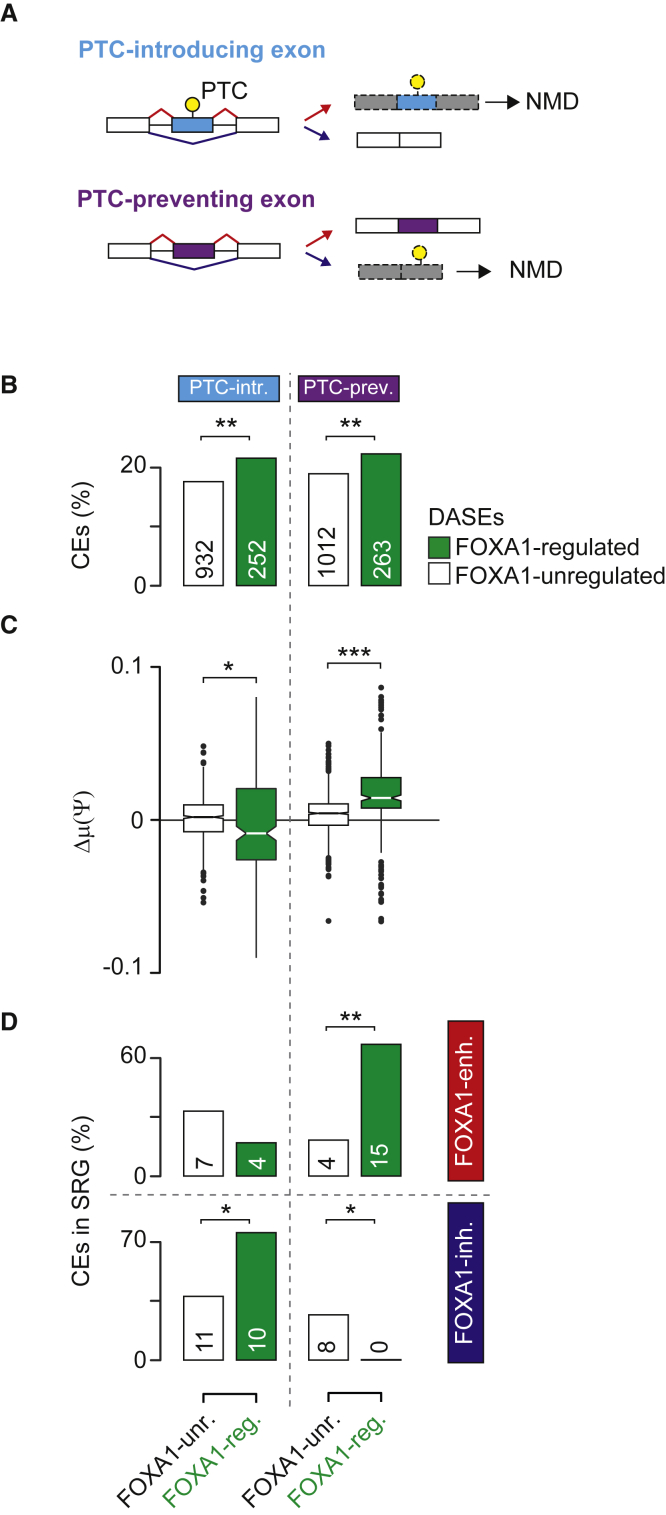
Dysregulation of alternative splicing in prostate cancer is linked to transcriptional programs activated by AR, ERG, FOXA1, and MYC. Here, we show that FOXA1 functions as the primary orchestrator of alternative splicing dysregulation across 500 primary and metastatic prostate cancer transcriptomes. We demonstrate that FOXA1 binds to the regulatory regions of splicing-related genes, including HNRNPK and SRSF1. By controlling trans-acting factor expression, FOXA1 exploits an "exon definition" mechanism calibrating alternative splicing toward dominant isoform production. This regulation especially impacts splicing factors themselves and leads to a reduction of nonsense-mediated decay (NMD)-targeted isoforms. Inclusion of the NMD-determinant FLNA exon 30 by FOXA1-controlled oncogene SRSF1 promotes cell growth in vitro and predicts disease recurrence. Overall, we report a role for FOXA1 in rewiring the alternative splicing landscape in prostate cancer through a cascade of events from chromatin access, to splicing factor regulation, and, finally, to alternative splicing of exons influencing patient survival.

Keywords: CP: Cancer; CP: Molecular biology; FLNA; FOXA1; HNRNPK; SRSF1; alternative splicing; biomarkers; nonsense-mediated decay; poison exons; prostate cancer; splicing factors.


Conflict of interest statement

Declaration of interests The authors declare no competing interests.

Figures

None
Graphical abstract
Figure 1
Figure 1
FOXA1 transcriptionally controls splicing-related genes in PC (A) Results of multivariable covariance analysis between the cumulative expression of SRGs and the expression of TFs in primary PCs, mCRPC, and NEPC. Color key indicates the standardized β coefficients of the model. (B) Enrichment of spliceosome genes with active TF binding sites within chromatin-accessible promoters (yellow) and enhancers (blue) for the VCaP- and LNCaP-based architectural datasets. The fraction of spliceosome genes with active TF-bound regions for each TF is shown. (C) Framework used to select FOXA1-controlled SRGs. p values refer to a two-tailed test of equal proportion comparing the proportion of active FOXA1 binding sites on SRG promoters (yellow) and enhancers (blue). DE, differentially expressed. (D) Bar plots indicate fold change (FC) in expression levels of FOXA1-controlled SRGs upon FOXA1 depletion in VCaP and PC3 cells. Color code indicates DEseq2 adjusted p value. Bottom annotations depict the active FOXA1-bound regulatory regions for each SRG. (E) ChIP-seq density read tracks of H3K27ac, H3K4me3, CTCF (two overlayed experiments) and FOXA1 (five overlayed experiments) in VCaP cells are shown together with recurrent accessible regions of primary PC from assay for transposase-accessible chromatin using sequencing experiments, active FOXA1 binding sites and RNA PolII chromatin interaction analysis by paired-end tag sequencing-derived FOXA1-bound regulatory regions. (F) Representative western blotting images (left panel) of whole-cell lysates from PC3 cells transfected with 2 μg of plasmid DNA vectors encoding FOXA1 or vector only (VO) control using antibodies to FOXA1 and ACTB. ACTB-normalized mean fold change in protein expression compared with control are shown below the upper blot image. Bar plots (right panel) depict the mean fold change in expression of candidate SRGs measured by qRT-PCR upon FOXA1 overexpression (biological triplicates). Error bars correspond to standard error of the mean. Two-tailed t test was used to compare conditions (p ≤ 0.05).
Figure 2
Figure 2
FOXA1 calibrates the alternative splicing equilibrium of PC by enhancing the production of dominant isoforms (A) Overview of alternatively spliced exon trajectories in the space defined by mean and standard deviation (SD) of exon inclusion levels (Ψs). Color codes indicate positive (red) and negative (blue) changes of mean and SD of Ψs between FOXA1 highly expressing tumors and remaining ones. (B) Cumulative distribution plots depict the number (N) of exons with either positive (red) or negative (blue) changes ranging from μ(Ψ)primary PC of 0.5 (i.e., mixed isoforms) to the boundaries of 0 and 1 (i.e., dominant isoforms). Dashed lines represent the expected mean cumulative distribution of events with inclusion changes generated by 1,000 Monte Carlo simulations. Gray area represents confidence intervals (5%–95%). Histograms of the number of exons with positive and negative changes are superimposed on the x axis. On left panel, a preponderance of blue over red indicates that FOXA1 mostly inhibits exon inclusion, whereas the dominance of red compared with blue indicates a major enhancement of exon inclusion by FOXA1. On right panel, a preponderance of blue over red indicates that exons were more uniformly spliced across tumors by FOXA1, whereas the dominance of red compared with blue indicates more heterogeneous inclusion upon high FOXA1 expression. (C and D) Cumulative distribution plots depict differentially alternatively spliced events (N) with positive (red) and negative (blue) mean inclusion changes upon FOXA1 depletion in VCaP (C) and PC3 (D) cells ranging from mixed (i.e., μ(Ψ) = 0.5) to dominant (i.e., μ(Ψ) = {0,1}) isoform population. Histograms of the number of exons with positive and negative changes are superimposed on the x axis. A preponderance of blue over red indicates that FOXA1 mostly inhibits exon inclusion. (E) Over representation analysis performed on genes harboring FOXA1-regulated AS events in primary PCs and cell lines. Shape size and gene ratio indicate the number (from 12 to 59) and the fraction of selected genes in each pathway, respectively. Color key represents the statistical significance (FDR) of the enrichment. Only top 5 enriched pathways (FDR < 0.1), if any, are shown and sorted by statistical significance. For (B–D), stars indicate the significance of two-tailed exact binomial tests comparing the abundances of exons with positive and negative changes against a null hypothesis with probability = 0.5 in four groups of Ψs. ∗∗p <10−2 and ∗∗∗p < 10−3.
Figure 3
Figure 3
FOXA1 controls nonsense-mediated decay determinant exons (A) Overview of selective inclusion of premature termination codon (PTC) introducing, or preventing, CEs triggering NMD. (B) Bar plots show the proportion of PTC-introducing and PTC-preventing exons among FOXA1-regulated and FOXA1-unregulated exons. Numbers of exons in each category are indicated. (C) Distribution of mean inclusion changes of NMD-determinant FOXA1-regulated and FOXA1-unregulated exons. (D) Bar plots show the proportion of PTC-introducing and PTC-preventing exons among FOXA1-regulated and FOXA1-unregulated exons. Exons are stratified according to their positive (red) and negative (blue) mean inclusion change upon high expression of FOXA1. The number of exons in each category is indicated. Stars indicate statistical significance of two-tailed Fisher’s exact test (B and D) and Wilcoxon rank-sum test (C). p < 0.05, ∗∗p < 10−2, ∗∗∗p < 10−3.
Figure 4
Figure 4
FOXA1 mediates exon silencing by controlling trans-acting factors within an exon definition mechanism (A) Length distributions of exon and flanking introns for FOXA1-regulated and -unregulated cassette exons. p values of two-tailed Wilcoxon rank-sum test are reported if significant. (B) Distribution of smoothed conservation scores (PhyloP, 100 vertebrates) of FOXA1-regulated and -unregulated exons in exonic and flanking intronic regions. (C) Bar plots show the fraction of SACS marked exons in FOXA1-regulated and FOXA1-unregulated exons (left panel). Color indicates SACS type. Corresponding histone modifications and categories of marked exons are reported as described in Agirre et al. (2021). (D) RNA splicing map of multivalent RNA motifs enriched at FOXA1-regulated exons. Left color-coded panel indicates the regions at exon/intron junctions where motifs were enriched at inhibited (blue) or enhanced (red) exons. The right panel depicts the nucleotide-resolution RNA splicing map of each motif at the FOXA1-regulated exons, and their flanking exons. The color key indicates whether the position-specific contribution originates from enhanced (E) (red), inhibited (I) (blue), or both (yellow) sets. Maximum RNA motifs enrichment score of the top tetramer, which is used for all tetramers, is reported on the right. nt, nucleotides. (E) Heatmap shows the association between enriched multivalent RNA motifs and cognate SRGs that were differentially expressed in primary PCs or mCRPCs in terms of matching score (MS).
Figure 5
Figure 5
FOXA1-regulated NMD-determinant exons predict PC patient prognosis (A) Kaplan-Meier plots of disease-free survival for primary PC patients stratified according to the 25th and 75th percentile of the cumulative inclusion levels of NMD-determinant exons that are inhibited or enhanced by high FOXA1 expression. Numbers of patients at risk (Nrisk) are reported at each time point on the x axis. Univariate HRs with 95% confidence intervals (CI) and two-tailed log rank test p values are shown where statistically significant. (B) Bar plots show the number of FOXA1-inhibited or -enhanced NMD-determinant exons with a significant harmful (HR > 1, top panel) or favorable (HR < 1, bottom panel) impact on patient disease-free survival (two-tailed log rank test p < 0.05). (C) Kaplan-Meier plots of disease-free survival for primary PC patients with low and high inclusion of the six most prognostic harmful exons (FDR < 0.05). Number of patients at risk (Nrisk) are reported at each time point on the x axis. Univariate HRs with 95% CI and two-tailed log rank test FDR are shown. (D) Results of multivariable covariance analysis between FOXA1 expression and the inclusion levels of the six most prognostic harmful exons. Color key indicates the standardized β coefficients of the model. (E) Kaplan-Meier plots of disease-free survival for primary PC patients stratified on the optimal FLNA exon 30 inclusion level (i.e., Ψ ≥ 0.258, maximally selected rank statistics = 5.35). Number of patients at risk (Nrisk) are reported at each time point on the x axis. Univariate HRs with 95% CI and two-tailed log rank test FDR are shown. (F) Bar plots show the proportions of high FOXA1 expressing and remaining tumors with FLNA exon 30 Ψ ≥ 0.258. (G) Bar plots show Ψs of FLNA exon 30 in PC3 cells measured by ddPCR upon FOXA1 depletion with one siRNA duplex (si1, 40 nM for 72 h). For (F) and (G), two-tailed t test was used to compare conditions: ∗∗∗p < 0.001.
Figure 6
Figure 6
FLNA exon 30 inclusion promotes PC cell growth and is controlled by SRSF1 (A) Bar plot shows mean fold change in PC3 cell growth (left panel) measured by MTT assay following transfection with 100 ng of plasmid DNA vector encoding FLNA with or without exon 30 (i.e., FLNA+ex30 or FLNAΔex30, respectively, or VO control, biological triplicates). Bar plot shows mean fold change in PC3 clonogenic potential (middle and right panels) measured by crystal violet assays following transfection with 2 μg of plasmid DNA vector encoding FLNA with or without exon 30 (i.e., FLNA+ex30 or FLNAΔex30, respectively, or VO control). Both colony number (middle panel) and staining intensity (right panel) are shown (five biological replicates). Two-tailed t test was used to compare conditions. (B) Results of multivariable covariance analysis between FLNA exon 30 inclusion levels and SRG expression levels. Color key indicates the standardized β coefficients of the model. (C) Distribution of FLNA exon 30 inclusion levels in primary PC patients stratified by high or low expression (≥75th and ≤25th percentile, respectively) of FOXA1 and SRSF1. Two-tailed Wilcoxon rank-sum test was used to compare conditions. Only significant results are reported. (D) SRSF1 eCLIP density read distribution in HepG2 cells in the alternatively spliced region of FLNA exon 30. Significant crosslinked sites detected by iCounts for SRSF1 are shown in black. (E and F) Bar plots show Ψs of FLNA exon 30 in PC3 cells upon depletion of SRSF1 with one siRNA duplex (40 nM for 72 h) in PC3 cells quantified by (E) endpoint PCR splicing assays using the QIAxcel capillary electrophoresis device and (F) by ddPCR. Representative capillary gel electrophoretogram (QIAxcel) shows two bands representing FLNA transcripts including or excluding exon 30 which were quantified to determine Ψ (E) (left panel). Two-tailed t test was used to compare biological triplicates of the different conditions.

References

    1. Agirre E., Oldfield A.J., Bellora N., Segelle A., Luco R.F. Splicing-associated chromatin signatures: a combinatorial and position-dependent role for histone marks in splicing definition. Nat. Commun. 2021;12:682. - PMC - PubMed
    1. Aran D., Sirota M., Butte A.J. Systematic pan-cancer analysis of tumour purity. Nat. Commun. 2015;6:8971. - PMC - PubMed
    1. Aran D., Hu Z., Butte A.J. xCell: digitally portraying the tissue cellular heterogeneity landscape. Genome Biol. 2017;18:220. - PMC - PubMed
    1. Baca S.C., Takeda D.Y., Seo J.-H., Hwang J., Ku S.Y., Arafeh R., Arnoff T., Agarwal S., Bell C., O’Connor E., et al. Reprogramming of the FOXA1 cistrome in treatment-emergent neuroendocrine prostate cancer. Nat. Commun. 2021;12:1979. - PMC - PubMed
    1. Baek D., Green P. Sequence conservation, relative isoform frequencies, and nonsense-mediated decay in evolutionarily conserved alternative splicing. Proc. Natl. Acad. Sci. USA. 2005;102:12813–12818. - PMC - PubMed

Publication types

MeSH terms