. 2022 Sep 27;40(13):111427.
doi: 10.1016/j.celrep.2022.111427.

Motor cortical influence relies on task-specific activity covariation

Affiliations

Motor cortical influence relies on task-specific activity covariation

Claire L Warriner et al. Cell Rep. .

Abstract

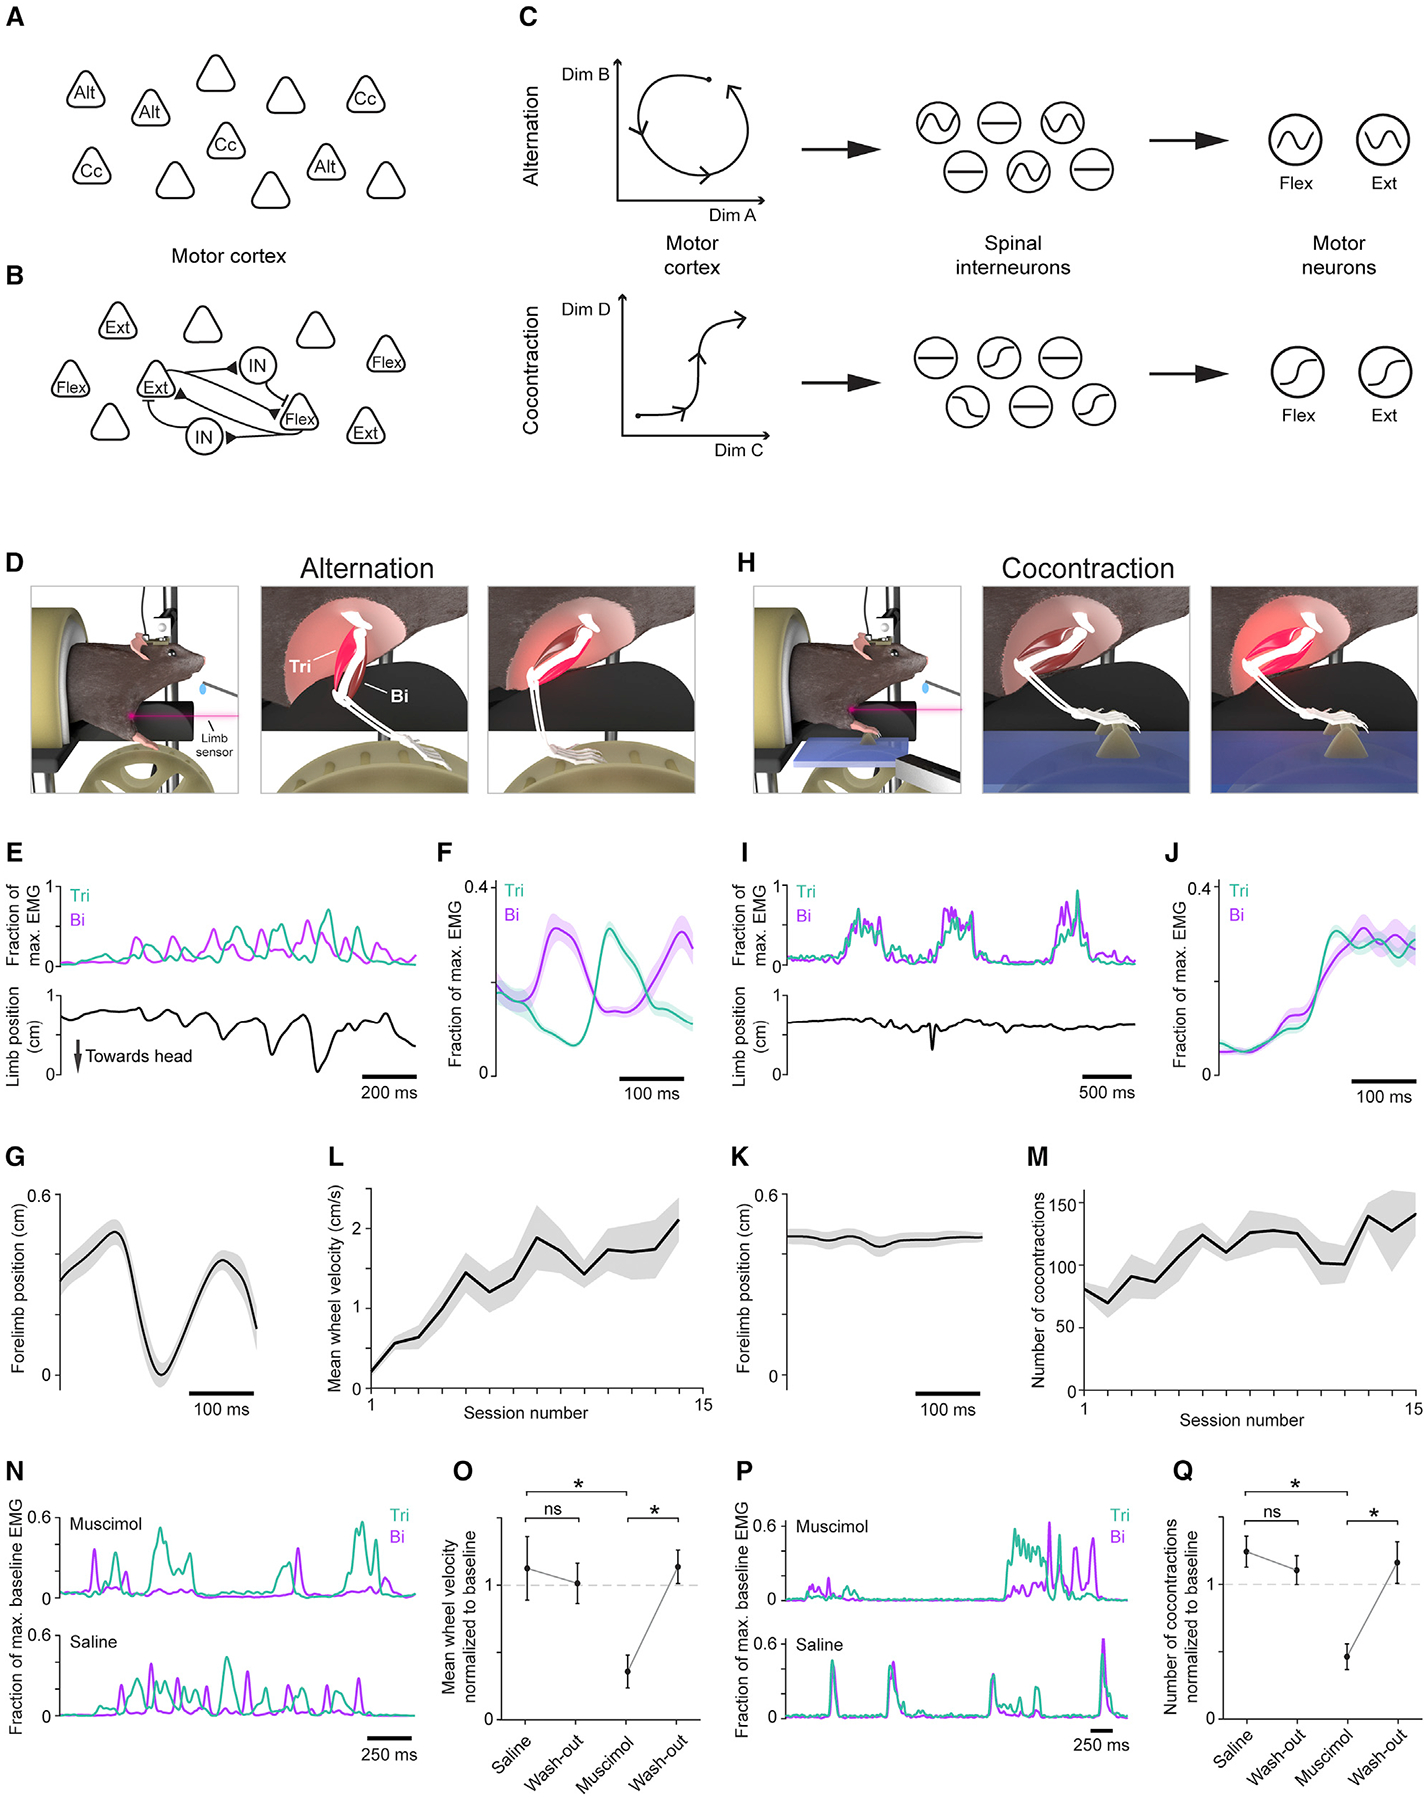
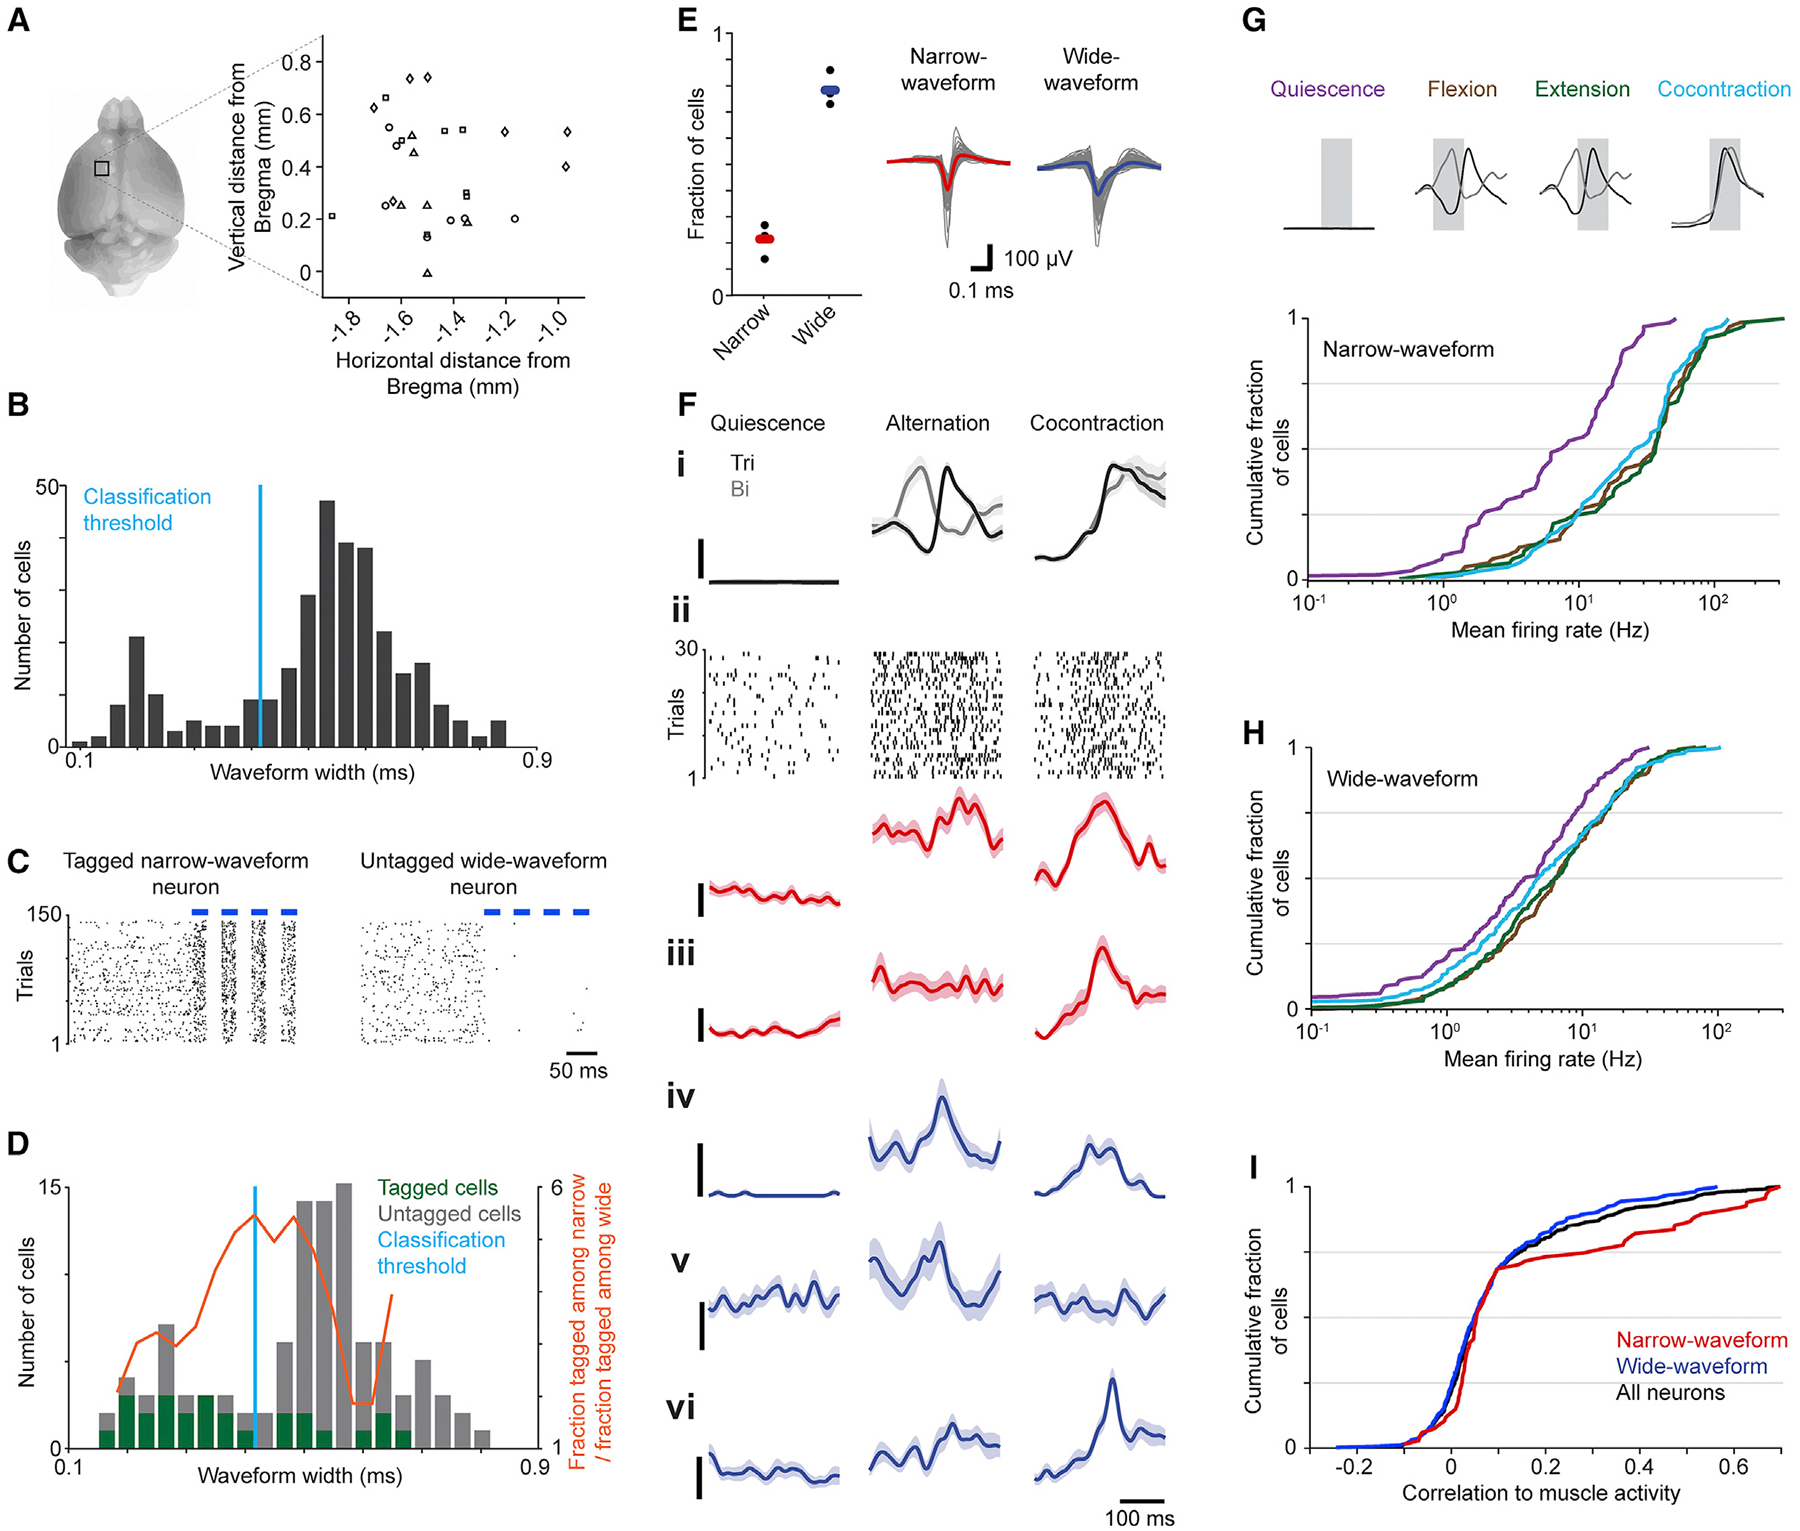
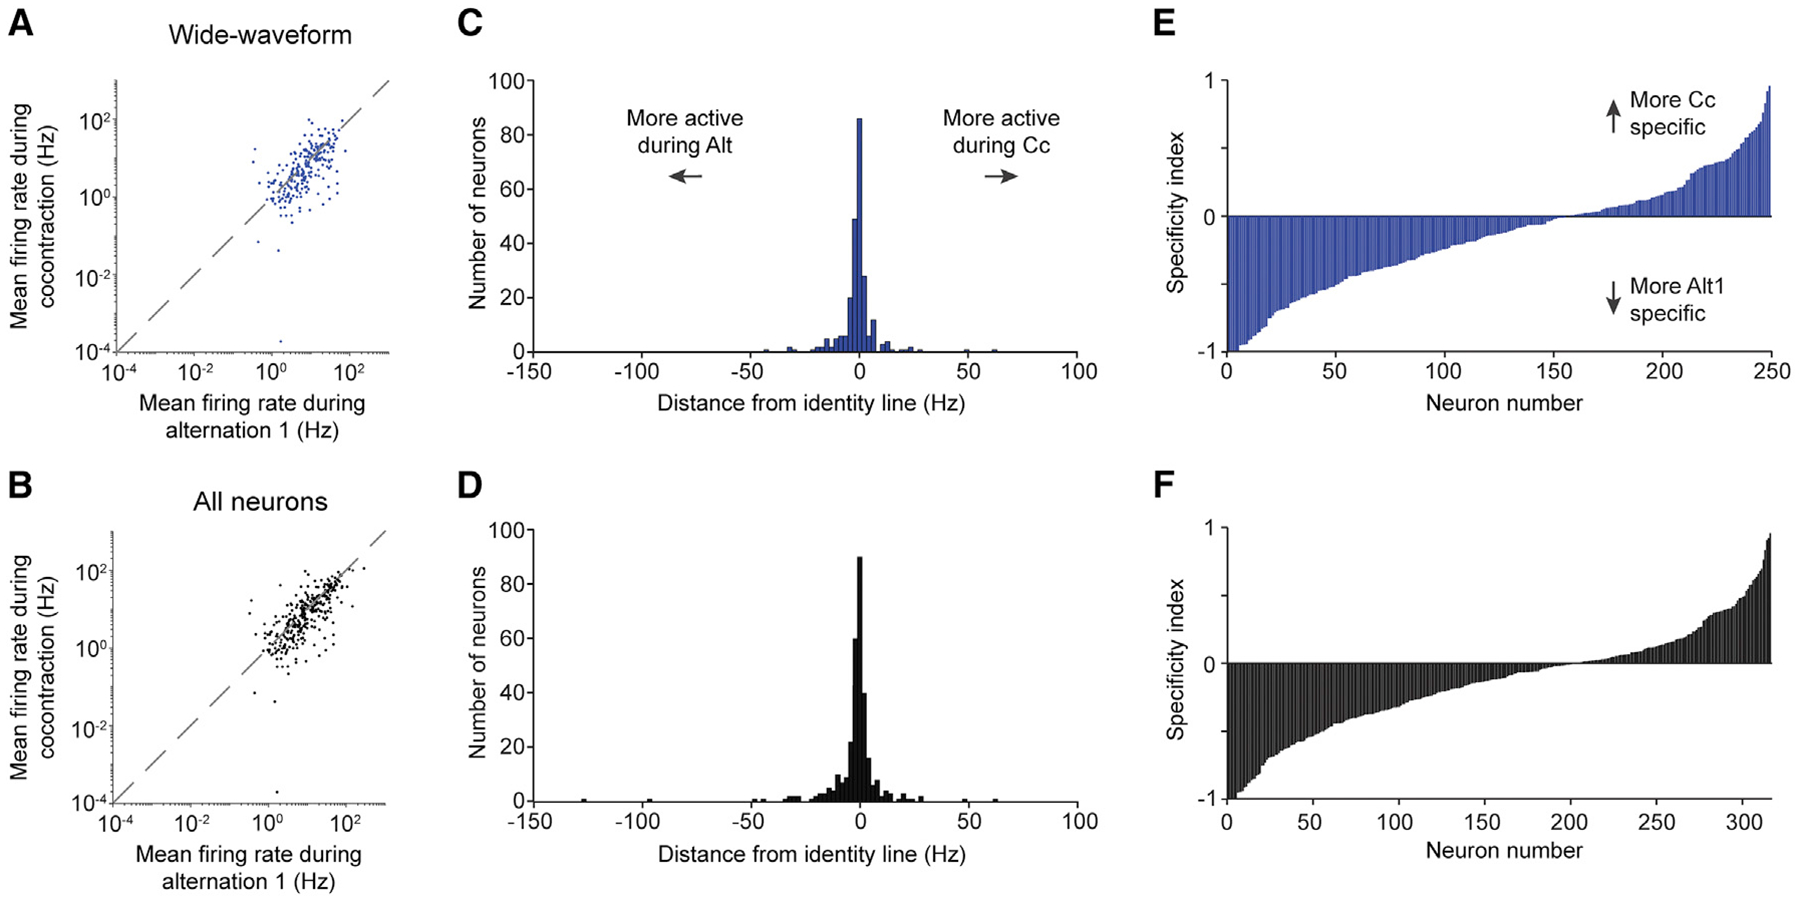
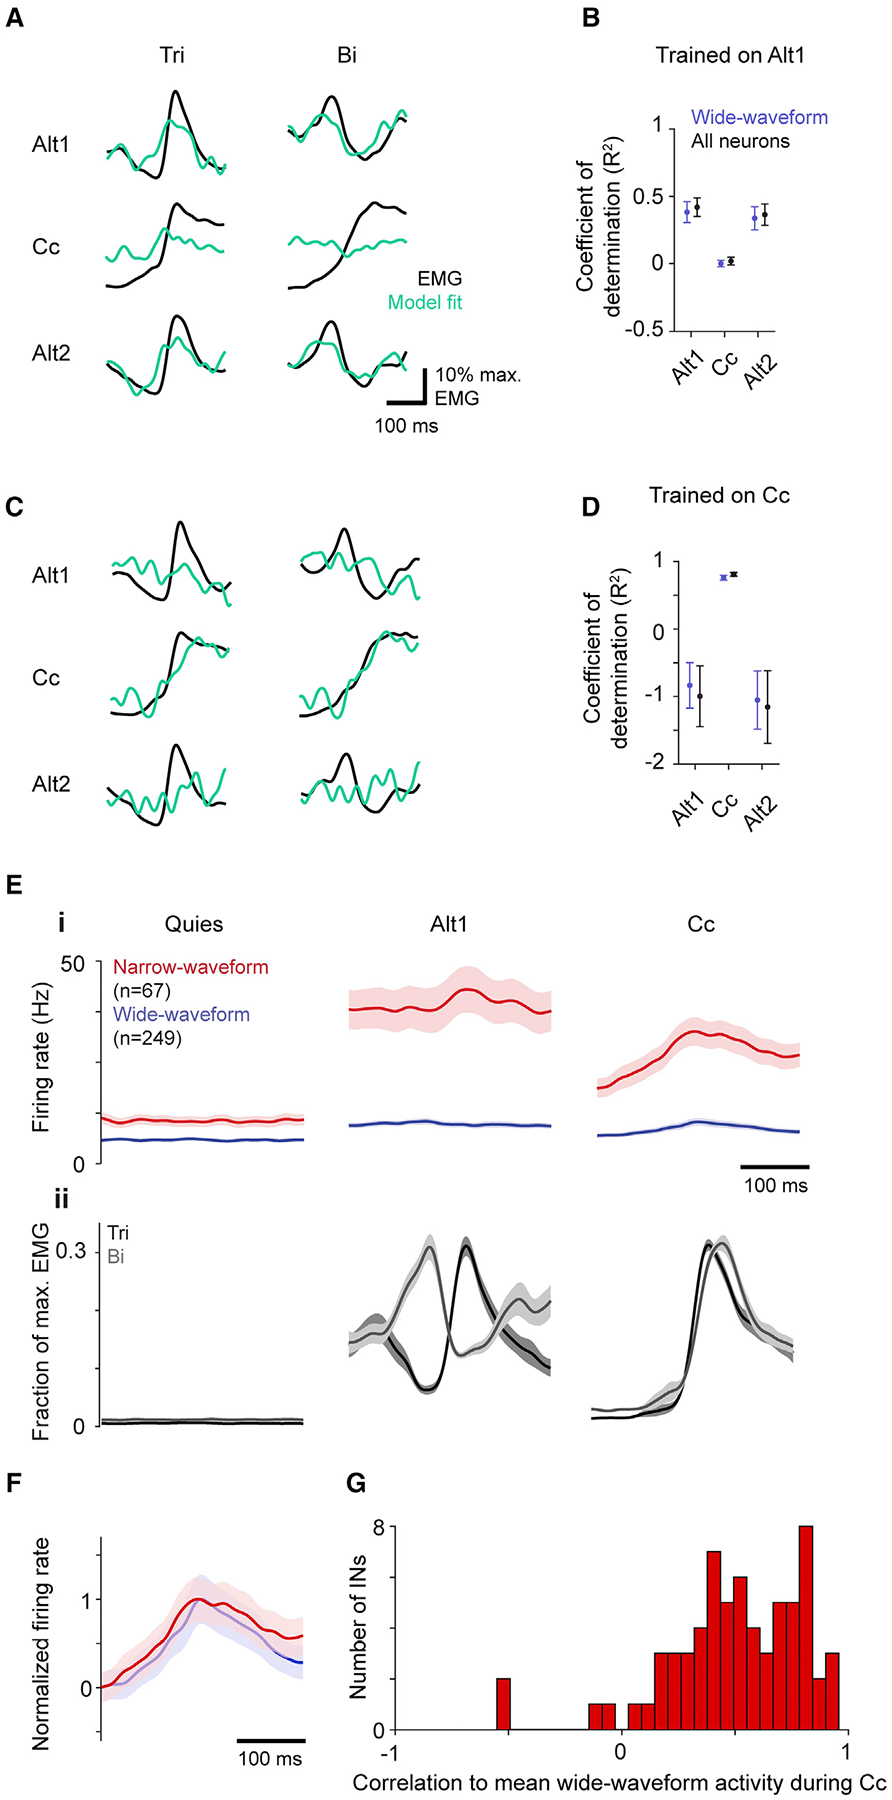
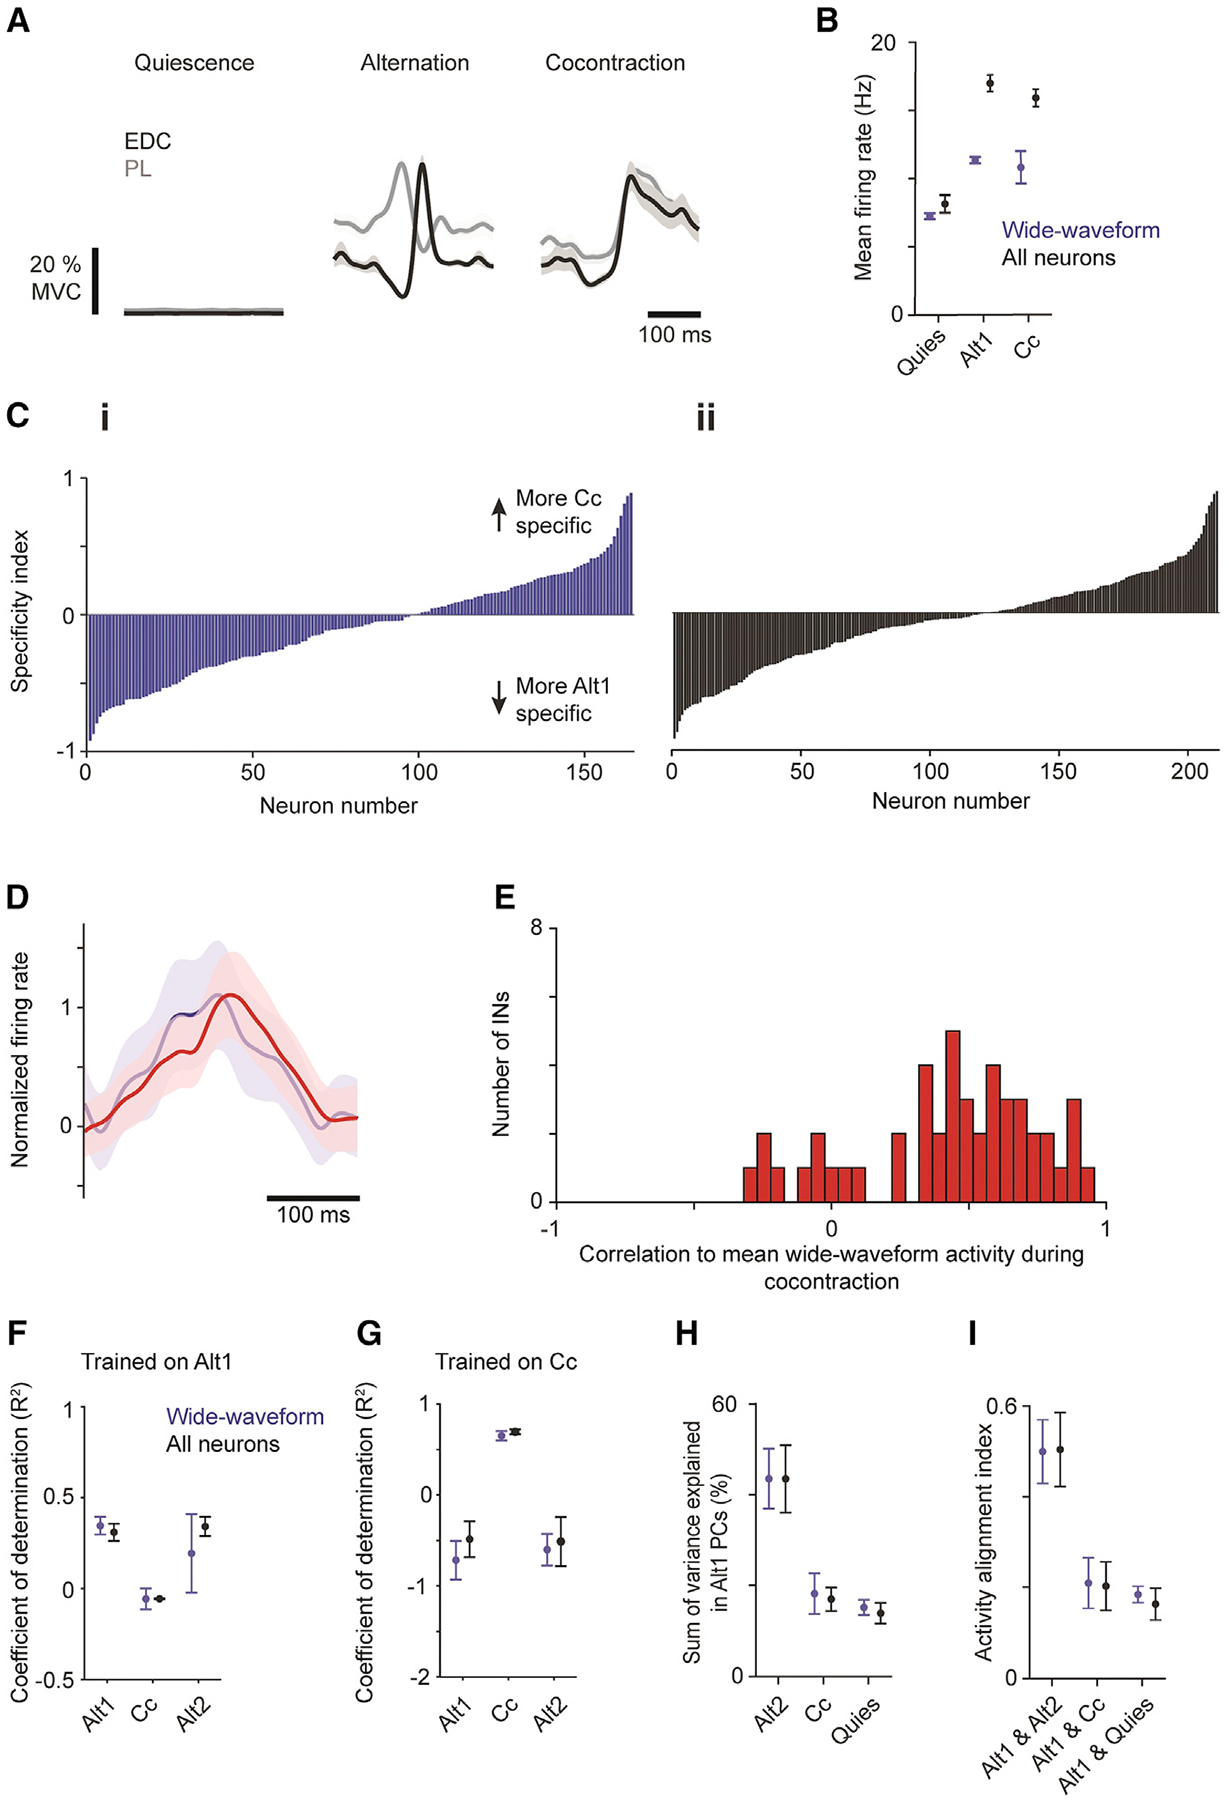
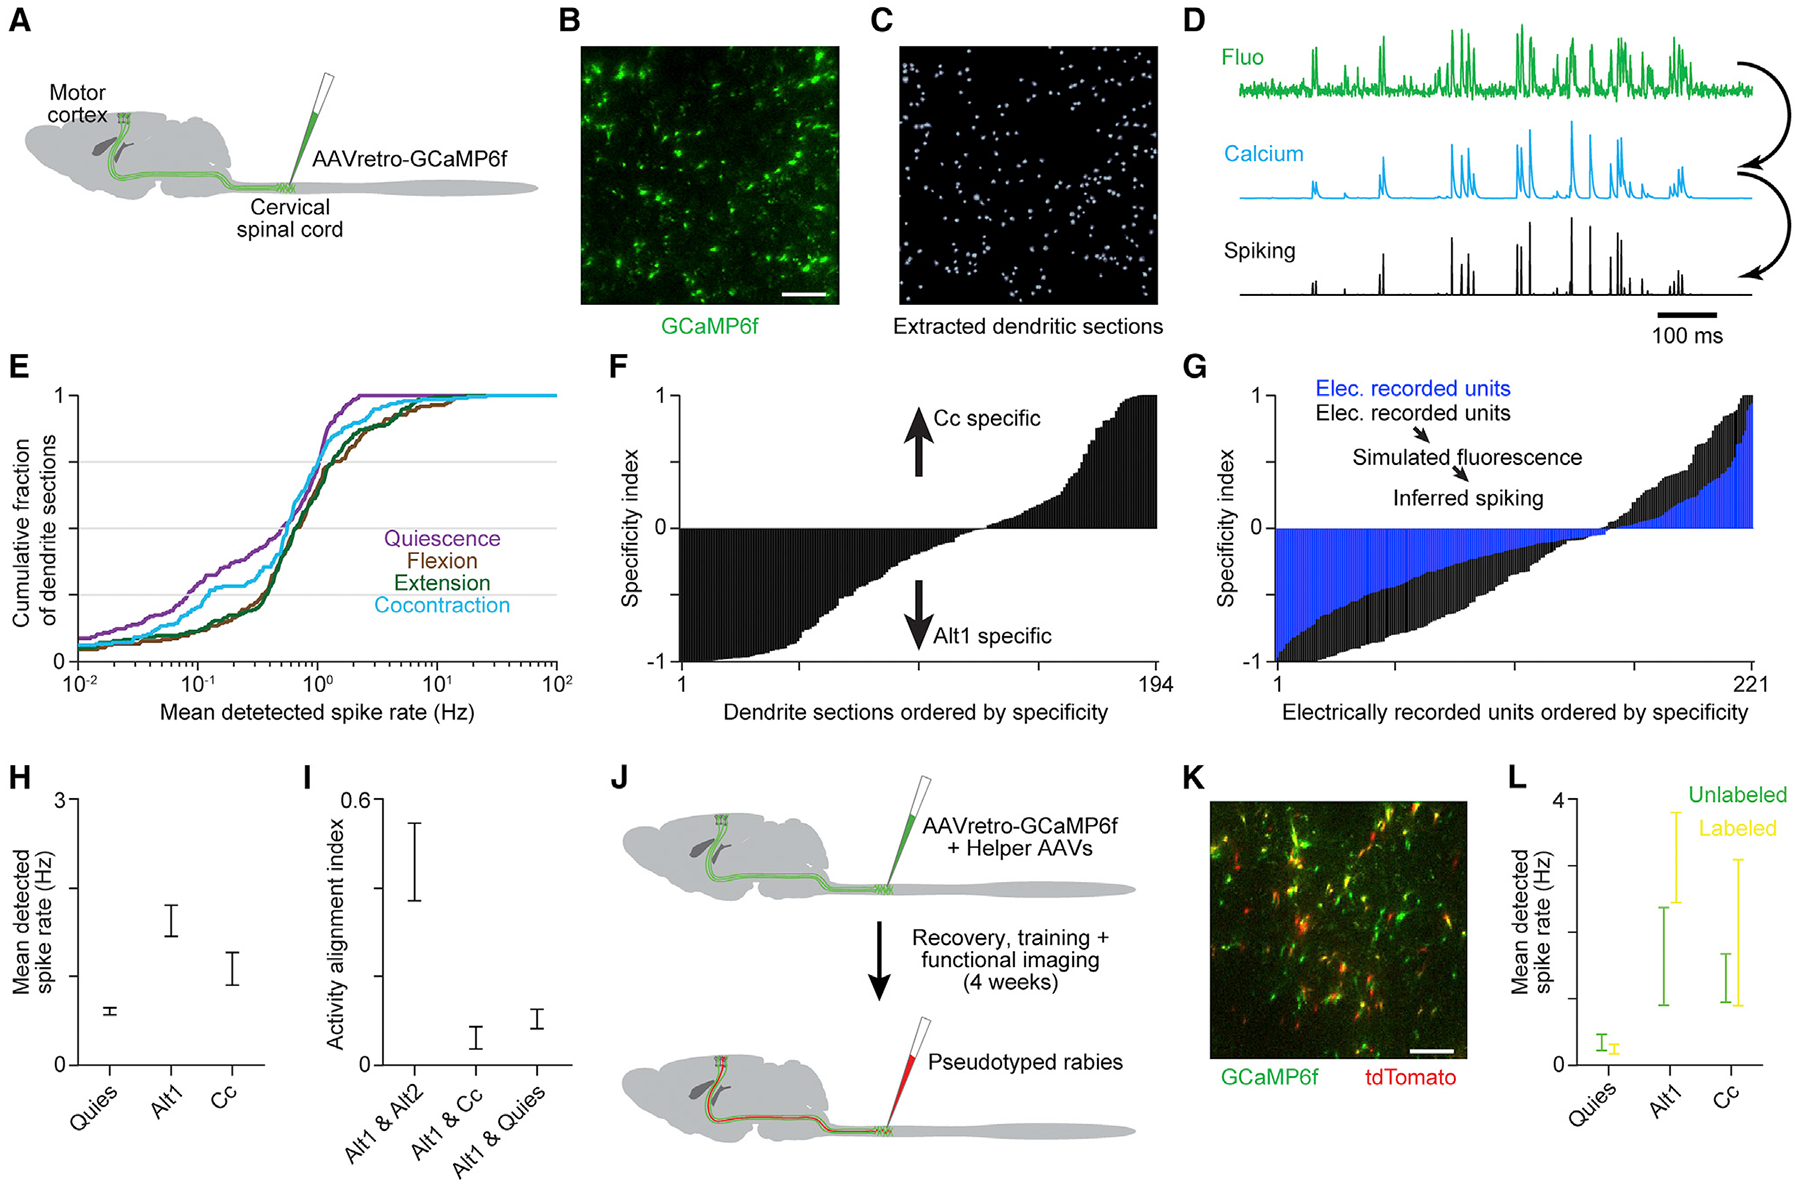
During limb movement, spinal circuits facilitate the alternating activation of antagonistic flexor and extensor muscles. Yet antagonist cocontraction is often required to stabilize joints, like when loads are handled. Previous results suggest that these different muscle activation patterns are mediated by separate flexion- and extension-related motor cortical output populations, while others suggest recruitment of task-specific populations. To distinguish between hypotheses, we developed a paradigm in which mice toggle between forelimb tasks requiring antagonist alternation or cocontraction and measured activity in motor cortical layer 5b. Our results conform to neither hypothesis: consistent flexion- and extension-related activity is not observed across tasks, and no task-specific populations are observed. Instead, activity covariation among motor cortical neurons dramatically changes between tasks, thereby altering the relation between neural and muscle activity. This is also observed specifically for corticospinal neurons. Collectively, our findings indicate that motor cortex drives different muscle activation patterns via task-specific activity covariation.

Keywords: CP: Neuroscience; EMG; alternation; antagonist muscles; caudal forelimb area; cocontraction; motor cortex; mouse; neural activity; neural activity subspace.


Conflict of interest statement

Declaration of interests The authors declare no competing interests.

Figures

Figure 1.
Figure 1.. Alternation and cocontraction behavioral paradigm
(A–C) Schematics depicting models in which motor cortex mediates cocontraction (Cc) and alternation (Alt) through task-specific pyramidal neurons (A), concurrent activation of flexion (Flex) and extension (Ext) related pyramidal neurons gated by interposed interneurons (B), or task-specific activity covariation (C). (D and H) Schematic depicting the alternation (D) and cocontraction (H) tasks and associated muscle activity (bright red). (E, F and I, J) EMG from triceps (Tri) and biceps (Bi) activity during the alternation (E–F) and cocontraction (I–J) tasks. (E) and (I) show example EMG time series with limb position below. (F) and (J) show trial-averaged EMG mean ± SEM (n = 30 trials) from an individual session. (G, K) Trial-averaged limb position ± SEM (n = 30 trials) aligned to triceps onset from alternation (G) and cocontraction (K) epochs from the same time points as shown in (F) and (J), respectively. (L and M) Mean ± SEM (n = 5 mice) of mean wheel velocity during alternation training (L) and number of cocontraction events during cocontraction training (M). (N–Q) Examples of triceps (Tri) and biceps (Bi) activity after injection of muscimol (top) or saline (bottom) during alternation (N) and cocontraction (P). Mean ± SEM (n = 5 mice) for mean wheel velocity during alternation, normalized to baseline, which is defined as mean performance over the three sessions preceding injection (O; one-tailed paired t test: saline and wash-out p = 0.642, muscimol and wash-out p = 0.002, saline and muscimol p = 0.023) and cocontraction (Q; saline and wash-out p = 0.766, muscimol and wash-out p = 0.004, saline and muscimol p = 0.004).
Figure 2.
Figure 2.. Neural activity during task performance
(A) Depiction of recording sites in left CFA for each mouse (symbols signify each of four mice). (B) Distribution of trough-to-peak waveform widths. (C) Spike rasters from an optically tagged narrow-waveform neuron (left) and an untagged wide-waveform neuron (right) during light stimulation (blue bars). (D) Distribution of waveform widths for neurons that were optically tagged (26/104) or untagged (78/104). (E) Fractions of neurons assigned to each subtype for each mouse (left; black dots). Bars show means across mice. Mean waveforms (right) for narrow-waveform (n = 67) and wide-waveform neurons (n = 249), with overall mean bold and colored. (F) Trial-averaged EMG and neural activity ± SEM (n = 30 trials) during muscle quiescence, alternation, and cocontraction epochs. (i) Activity in triceps (Tri) and biceps (Bi). (ii) Spike raster and trial-averaged firing rate for a narrow-waveform neuron. (iii-vi) Trial-averaged firing rates for an additional narrow-waveform (iii, red) and three wide-waveform neurons (iv-vi, blue). Scale bars represent 10% of maximal EMG activity (top) and 20 Hz (below), respectively. (G and H) Cumulative histograms of mean firing rates during quiescence, flexion, extension, and cocontraction for narrow-waveform (G) and wide-waveform (H) neurons. Means are from time series segments shaded gray (top). (I) Cumulative histogram of the correlation of neuronal firing rates with muscle activity across the entire session.
Figure 3.
Figure 3.. Neurons demonstrate a continuum of task specificity
(A and B) Mean firing rate during the first epoch of alternation versus that during cocontraction for wide-waveform neurons (A) and all neurons (B). (C and D) Distribution of the distance of each point in (A) and (B) from the identity line. (E and F) Specificity index for wide-waveform (E) and all neurons (F). Neurons are separately ordered by ascending index value in each plot.
Figure 4.
Figure 4.. Neural activity does not conform to existing hypotheses
(A and C) Example of ridge regression model fit to trial-averaged triceps (Tri) and biceps (Bi) activity for models trained on activity from the first alternation epoch (A) or the cocontraction epoch (C). (B and D) Mean ± SEM (n = 4 mice) R2 for models trained to fit activity for all six muscles from the first alternation epoch (B) and cocontraction (D) using wide-waveform or all neurons, when tested on activity from the three different epochs. (E) Trial-average activity ± SEM (i) during muscle quiescence, alternation, and cocontraction of narrow-waveform (n = 67 neurons from four mice) and of wide-waveform neurons (n = 249 neurons), with corresponding muscle activity (ii). (F) Trial-average activity ± SEM of narrow- and wide-waveform neurons normalized to their respective minima and maxima averaged across all four mice. (G) Distribution of correlation coefficients for each narrow-waveform neuron’s activity to the mean wide-waveform activity during cocontraction.
Figure 5.
Figure 5.. Task-specific motor cortical activity covariation
(A–C) Mean ± SEM (n = 4 mice) cumulative variance explained by the top principal components (PCs) for neural activity from different task epochs (A) and variance explained by the top PCs of Alt1 among all neurons (B) and wide-waveform neurons (C). (D and E) Mean ± SEM (n = 4 mice) summed variance explained by the top six Alt1 PCs (D) and of the alignment of firing rates in Alt1 with other epochs (E). (F and G) Neural activity projected into the top three PCs of the shared Alt1 and Cc activity space for all (F) and wide-waveform neurons (G). Colors consistent with (A)–(C).
Figure 6.
Figure 6.. Motor cortical activity during wrist alternation and cocontraction also reflects task-specific covariation
(A) Trial-averaged muscle activity ± SEM (n = 30 trials) for EDC and PL during muscle quiescence (left), alternation (middle), and cocontraction (right) epochs. (B) Mean ± SEM firing rates from three animals during three task epochs for wide-waveform (n = 164 neurons) and all neurons (n = 211 neurons). (C) Specificity index for neurons separately in ascending order for wide-waveform (i) and all neurons (ii). (D) Trial-averaged activity ± SEM of narrow-waveform (red; n = 47 neurons) and wide-waveform (blue; n = 164 neurons) neurons normalized to their respective minima and maxima. (E) Distribution of correlation coefficients for each narrow-waveform neuron’s activity to the mean wide-waveform activity during cocontraction. (F and G) Mean ± SEM (n = 3 mice) R2 for models trained to fit activity for all six muscles from the first alternation epoch (F) and cocontraction (G) using wide-waveform or all neurons when tested on activity from the three different task epochs. (H and I) Mean ± SEM (n = 3 mice) summed variance explained by the top six Alt1 principal components (PCs; H) and of the alignment of firing rates in Alt1 with other epochs (I).
Figure 7.
Figure 7.. Corticospinal neuron activity during alternation and cocontraction
(A) An rAAV2-retro was injected into cervical spinal segments to induce GCaMP6f expression in corticospinal neurons. (B and C) Example of fluorescence (B) and dendritic cross-sections (C) from a horizontal imaging region ~350 μm below pia. Scale bar, 50 μm. (D) Example fluorescence, estimated calcium change, and estimated spiking time series. (E) Cumulative histogram of detected spike rates for qualifying dendritic sections during distinct behavioral epochs. (F) Specificity index for qualifying dendritic sections, in ascending order. (G) Specificity index for electrically recorded putative pyramidal neurons, and the same neurons after simulating calcium-sensitive fluorescence based on their spiking and inferring spiking from simulated fluorescence. (H) Mean ± SEM detected spike rate across qualifying dendritic sections during distinct behavioral epochs. (I) Mean ± SEM (n = 9 imaging planes) activity alignment for corticospinal dendritic sections. (J) Schematic of injections for imaging experiments in which rabies-driven tdTomato labeling of GAD+ spinal neuron-contacting corticospinal neurons was registered to GCaMP6f after functional measurements were completed. (K) Example of GCaMPf and tdTomato fluorescence from a horizontal imaging region. Scale bar, 50 μm. (L) Mean ± SEM for tdTomato-labeled (n = 28) and unlabeled (n = 19) dendritic sections during quiescence, alternation, and cocontraction. Neither group showed significant changes between alternation and cocontraction (two-tailed t test, p > 0.05).

References

    1. Aimonetti JM, and Nielsen JB (2002). Cortical excitability and motor task in man: an investigation of the wrist extensor motor area. Exp. Brain Res 143, 431–439. - PubMed
    1. Akay T, Acharya HJ, Fouad K, and Pearson KG (2006). Behavioral and electromyographic characterization of mice lacking EphA4 receptors. J. Neurophysiol 96, 642–651. - PubMed
    1. Ames KC, and Churchland MM (2019). Motor cortex signals for each arm are mixed across hemispheres and neurons yet partitioned within the population response. Elife 8, e46159. - PMC - PubMed
    1. Ayling OGS, Harrison TC, Boyd JD, Goroshkov A, and Murphy TH (2009). Automated light-based mapping of motor cortex by photoactivation of channelrhodopsin-2 transgenic mice. Nat. Methods 6, 219–224. - PubMed
    1. Azim E, Jiang J, Alstermark B, and Jessell TM (2014). Skilled reaching relies on a V2a propriospinal internal copy circuit. Nature 508, 357–363. - PMC - PubMed

Publication types

LinkOut - more resources